Crude Corner: Oil Industry Insights, Market Analysis and Price Outlook

Join countless traders worldwide who use
the Hawkeye algorithms day in and day out to gain a powerful edge

Crude Corner: Oil Industry Insights, Market Analysis and Price Outlook

WTI Light Sweet Crude Oil Futures Analysis

July – CLN20 Contract

Crude Corner Outlook:

The mid $35.00 – $36.00 price area will likely contain selling pressure into July trading activity. Above which, the $44.00 price area is likely and able to be obtained within several weeks.

Near-Term Bullish Scenario:

The $38.00 price area can contain initial strength, beyond which the mid $40.00 price area is likely and able to contain session strength. Closing above the $40.00 price area indicates the $44.00 price area in several days which sets the stage for the $49.00 price area to follow.

Near-Term Bearish Scenario:

Breaking below the mid $35.00 price area indicates a test of the mid $34.00 price area intraday. Closing below the mid $35.00 price area indicates a June high has already been placed. The mid $31.00 price area then expected by the end of the week and the mid $23.00 price area within several weeks.

Check out our Crude Corner charts for our long-term market analysis outlook AND our Crude Corner weekly / daily breakout charts with KEY Active Support & Resistance price areas.

Want to learn more about how Hawkeye can help you spot opportunities in the oil market? Tap here to view a no-cost presentation right now!

Crude Corner: Oil Industry Insights, Market Analysis and Price Outlook

WTI Light Sweet Crude Oil Futures Analysis

July – CLN20 Contract

For Today:

The $36.00 price area will likely contain selling pressure. The mid $37.00 price area is likely and able to contain buying throughout the balance of June.

Near-Term Bullish Scenario:

Breaking above the mid $37.00 price area allows for upward momentum towards the mid $39.00 price area. A daily settlement above the mid $37.00 price area signifies near-term target at the mid $42.00 price area within a week or so. Long-term upside target at the mid $55.00 price area is then likely over several weeks.

Near-Term Bearish Scenario:

Breaking below the $36.00 price area allows for a retest of the $35.00 price area. Closing below the mid $35.00 price area would allow for a retest of the mid $33.00 price area which will likely contain near term selling.

Check out today’s pre-market multiple timeframe charts for areas of confluence AND this week’s Crude Corner breakout chart displaying key support & resistance areas.

Want to learn more about how Hawkeye can help you spot opportunities in the oil market? Tap here to view a no-cost presentation right now!

“Crude Corner”: Oil Industry Insights, Market Analysis and Price Outlook

To call this ride crude oil has been on “wild” is clearly an understatement. From prices trading at nearly NEGATIVE $40.00 a barrel when approaching expiration of the May contract, to the Saudi & Russian price war, pared with the global economic shutdowns generating over supply and completely depleting demand – to a historic comeback of prices rallying nearly 90% during the calendar month of May. This year thus far has undoubtedly been the wildest ride of my trading career!

The craziest part of all of this is the insane opportunities the market continues to present. To think looking back that I’ve made less money in calmer seas than these rough unpredictable times makes this all that more exciting. Adversity often presents opportunity, and that’s exactly what is happening throughout all of this craziness.

I suspect the crude oil market is most likely coming due for a short-term correction. A base of support is much needed to be formed which the market is currently lacking. The July contract has been rallying on average approximately $4.00 per week to the upside for the past 4 straight weeks in a row.

I believe the market will have a greater chance of following through with it’s current rally trajectory if along the way there are bottoms placed and solidified. The $36.00 – the mid $37.00 price area will likely determine if this rally has a pullback or if it continues on its current upward path.

If buying strength weakens we could see a healthy correction to as deep as the $26.00 price area. This formation of a secondary, higher bottom would confirm buyer’s interest in driving this current rally onward and upward.

If the $31.00 price area is broken through, the $26.00 price area will most likely be able to contain remaining selling. The next 2 bullish target’s I’m looking at are at the mid $37.00 price area and further to the upside between the $39.00 – $40.00 price area.

There is a confluence of intraday upside resistance / supply that would need to be successfully broken through on multiple timeframe Hawkeye Zones at $37.33 – this break would be key to see the next suspected upside target at the $39.00 price area.

Check out this week’s Crude Corner Passive Breakout Trade Idea(s) offering both bullish and bearish scenarios. This strategy suggests 3 contracts for each trade. 1 Stop with 3 Targets. If there are open position(s) at 1400 EST on Friday or on the last day of the trading week, I would recommend closing them out before the weekend.

PLEASE NOTE: I would strongly recommend the use of confirmation tools and the implementation of your unique trade management plan before entering any trade.

“Strive not to be a success, but rather to be of value.” ~ Albert Einstein

Wishing you a blessed and profitable week!

Anthony
Crude Corner

Want to learn more about how Hawkeye can help you spot opportunities in the oil market? Tap here to view a no-cost presentation right now!

Crude Corner: Oil Industry Insights, Market Analysis and Price Outlook

Oil futures moved lower on Thursday after industry data showed a surprise increase in United States crude stocks, which offset hopes for a demand recovery as coronavirus lockdowns ease.

For the week ending May 22 United States stockpiles rose by 7.9 million barrels, the United States Energy Information Administration said. Analysts had been expecting a draw of 1.3 million barrels.

Data from industry group API showed United States crude stocks rose 8.7 million barrels in the week to May 22, against analyst expectations for a 1.9 million-barrel draw.

Also weighing on prices was uncertainty about Russia’s commitment to continuing deep output cuts ahead of a June 9 meeting of the Organization of the Petroleum Exporting Countries and its allies, a grouping dubbed OPEC+.

Saudi Arabia and some other OPEC oil producers are considering extending record high output cuts until the end of 2020 but have yet to win support from Russia, according to OPEC+ and Russian sources.

Reportedly, Russian President Vladimir Putin and Saudi Crown Prince Mohammed bin Salman agreed during a telephone call on further “close coordination” on output restrictions on Wednesday.

With United States WTI holding above $30 a barrel, OPEC+ will be watching to see whether United States shale oil producers, who have breakeven prices in the high $20 to low $30 range, step up production.

YEARLY Crude Oil Cycles

  • The 10 year cycle makes a high on May 3 and then sells off sharply into May 25 after which it rallies from a major low.
  • The 20 year cycle rallies sharply into May 19 then trades sideways into month end.
  • The 30 year cycle rallies into May 14 then sells off into the end of the month.
  • The 10 and 30 year cycles both head down from the 14th May.

Key turning point dates:

  • May 4
  • May 18
  • May 29

MONTHLY Crude Oil Outlook ( JULY – CLN20 )

The $12.00 price area can absorb annual selling pressures. Above which the $39.00 price area remains a several week target. If achieved, then the mid $55.00 price area would likely be in reach over the next several months.

Bullish Outlook:

The mid $26.00 price area can likely absorb selling pressure throughout the balance of May. Above which the $39.00 price area is the next near term several week target.

A daily settlement above the $39.00 price area indicates a good annual low has been made. Then the mid $55.00 price area would be attainable within several weeks.

Bearish Outlook:

A daily settlement below the mid $26.00 price area would likely yield a $12.00 price area retest within several weeks, which would likely bottom out selling pressure for the remainder of the year.

WEEKLY Crude Oil Outlook ( JULY – CLM20 )

The main trend remains bearish according to the weekly swing chart, however, momentum has been trending to the upside since the formation of the closing price reversal bottom the week-ending May 1.

The market has a lot more work to do before the trend changes to bullish on the weekly chart. A trade through the last main top at $54.86 will change the main trend to bullish. A move through $17.27 will signal a resumption of the downward trend.

The minor range is $37.64 to $17.27. It’s 50% level at $27.46 remains it’s support. This price is actually controlling the near-term direction of the market.

The short-term range is $54.86 to $17.27. It’s 50% level at $36.07 which services as the first upside bullish target.

The main range is $62.95 to $17.27. It’s retracement zone at $40.11 to $45.50 is the major upside target. This zone likely controls the longer-term direction of the market.

Technical Forecast

Given the price action over the last three weeks, the direction of the July WTI crude oil futures contract the week-ending May 29 is likely to be determined by trader reaction to the steep uptrending Gann angle at $33.27.

Bullish Scenario

A sustained move over $27.46 will indicate the presence of buyers. This could trigger a rally into the downtrending Gann angle at $28.86. Since the main trend is down, sellers could come in on the first test of $28.86, however, overtaking it could trigger an acceleration to the upside with near-term targets the minor top at $35.18 and the 50% level at $36.07.

Bearish Scenario

A sustained move under $33.27 will signal the presence of sellers. This could trigger the start of a steep break with the first target $27.46, followed by another uptrending Gann angle at $25.27.

Technical Summary

Counter-trend upside momentum has been driving up July WTI crude oil since the week-ending May 1 at a pace of $4.00 per week. If this upside momentum is to continue the week-ending May 29 then the market is going to have to hold above $33.27. A failure to hold $33.27 will indicate that momentum is weakening. This could trigger a near-term correction towards $25.27.

May Crude Corner Weekly Passive Breakout Trade Recap

5 Trades Utilizing ONLY 3 Contracts Per Trade
Paid $17,340.00 of PASSIVE PROFIT in May

Crude Corner CLOSED Swing Trade … $55,800.00 in 11 DAYS!!!

Sunday evening May 10, 2020 @ 1800 EST we entered a swing trade position.

Position Size: 10 Contracts

Trade Directions: LONG

Contract: CLN20

Entry Price: $26.04

Target Price: $36.04

Stopped Out @ $31.62

Trade Duration: 11 Days

This HAWKEYE powered trading strategy is the flagship of our service, we take only the highest probability of successful passive trades for massive income. These trades occur on average approximately 1 once a month, but when they do, they pay BIG!!!

Want to learn more about how Hawkeye can help you spot opportunities in the oil market? Tap here to view a no-cost presentation right now!

“Crude Corner”: Oil Industry Insights, Market Analysis and Price Outlook

In the last two months, oil has hit two very different milestones.

In April, West Texas Intermediate, the United States oil benchmark, plunged below zero and into negative territory for the first time ever on record.

Meanwhile, May is shaping up to be WTI’s best month ever, going back to the contract’s inception in 1983.

This has been a never before seen, astonishing turnaround.

Improvements on both the demand and supply side of the equation have pushed prices higher.

Data shows that people in the United States and China are starting to hit the road again, while producers around the globe have cut output at record rates in an effort to prop up prices.

The latest figures from EIA show that United States production has dropped 1.6M BPD below the March high of 13.1M BPD.

Exxon, Chevron and ConocoPhillips are among the companies that have scaled back operations.

The contract has jumped more than 70% in May and posted four straight weeks of gains, but some traders warn that the near-term outlook for oil remains uncertain, and that prices could head back into the $20’s after settling around $33 last Friday.

Additionally, part of WTI’s blistering rally this month is due to the historic low from which it bounced.

Prices are still about 50% below January’s high of $65.65, significantly cutting into profits for energy companies, which are often saddled with debt.

A number of United States energy companies have already filed for bankruptcy protection, including Whiting Petroleum, which was once a large player in the Bakken region.

If prices stay at depressed levels, there could be more financial casualties.

Still, the market has shown signs of rebalancing itself, and analysts say that if demand continues to improve and producers keep wells shut-in, the worst of what we’ve seen in recent months could be over for oil.

YEARLY Crude Oil Cycles

  • The 10 year cycle makes a high on May 3 and then sells off sharply into May 25 after which it rallies from a major low.
  • The 20 year cycle rallies sharply into May 19 then trades sideways into month end.
  • The 30 year cycle rallies into May 14 then sells off into the end of the month.
  • The 10 and 30 year cycles both head down from the 14th May.

Key turning point dates:

  • May 4
  • May 18
  • May 29

MONTHLY Crude Oil Outlook ( JULY – CLN20 )

The $12.00 price area can absorb annual selling pressures. Above which the mid $39.00 price area remains a several week target. Potentially the mid $55.00 price area would then be in reach over the next several months.

Bullish Outlook:

he mid $27.00 price area can likely absorb selling pressure throughout the balance of May. Above which the mid $39.00 price area is the next near term several week target.

A daily settlement above the mid $39.00 price area indicates a good annual low has been made. Then the mid $55.00 price area would be attainable within several more weeks, likely making the high for the remainder of the year.

Bearish Outlook:

A daily settlement below the mid $27.00 price area would likely yield a $12.00 price area retest within several weeks, which would likely bottom out selling pressure for the remainder of the year.

WEEKLY Crude Oil Outlook ( JULY – CLM20 )

he main trend remains bearish according to the weekly swing chart, however, momentum has been trending to the upside since the formation of the closing price reversal bottom the week-ending May 1.

The market has a lot more work to do before the trend changes to bullish on the weekly chart. A trade through the last main top at $54.86 will change the main trend to bullish. A move through $17.27 will signal a resumption of the downward trend.

The minor range is $37.64 to $17.27. It’s 50% level at $27.46 remains it’s support. This price is actually controlling the near-term direction of the market.

The short-term range is $54.86 to $17.27. It’s 50% level at $36.07 which services as the first upside bullish target.

The main range is $62.95 to $17.27. It’s retracement zone at $40.11 to $45.50 is the major upside target. This zone likely controls the longer-term direction of the market.

Technical Forecast

Given the price action over the last three weeks, the direction of the July WTI crude oil futures contract the week-ending May 29 is likely to be determined by trader reaction to the steep uptrending Gann angle at $33.27.

Bullish Scenario

A sustained move over $33.27 will indicate the presence of buyers. If this creates enough upside momentum then look for the rally to extend into $36.07. This is a potential trigger point for an acceleration into $40.11 to $40.86.

Bearish Scenario

A sustained move under $33.27 will signal the presence of sellers. This could trigger the start of a steep break with the first target $27.46, followed by another uptrending Gann angle at $25.27.

Technical Summary

Counter-trend upside momentum has been driving up July WTI crude oil since the week-ending May 1 at a pace of $4.00 per week. If this upside momentum is to continue the week-ending May 29 then the market is going to have to hold above $33.27. A failure to hold $33.27 will indicate that momentum is weakening. This could trigger a near-term correction towards $25.27.

May Crude Corner Weekly Passive Breakout Trade Recap

$18,140 of PASSIVE PROFIT over the past 3 WEEKS:

5/4/20 – 5/8/20 Weekly Trade Strategy Paid $6,460:

5/11/20 – 5/15/20 Weekly Trade Strategy Paid $6,080:

5/18/20 – 5/22/20 Weekly Trade Strategy Paid $5,600:

Crude Corner CLOSED Swing Trade … $55,800.00 in 11 DAYS!!!

On Sunday evening May 10, 2020 @ 1800 EST we entered a swing trade position.

Position Size: 10 Contracts

Trade Directions: LONG

Contract: CLN20

Entry Price: $26.04

Target Price: $36.04

Stopped Out @ $31.62

Trade Duration: 11 Days

This HAWKEYE powered trading strategy is our flagship, we take only the highest probability of successful passive trades for massive income.

These trades occur on average less than 20 times annually, but when they do, they pay us very well.

Want to learn more about how Hawkeye can help you spot opportunities in the oil market? Tap here to view a no-cost presentation right now!

Crude Corner: Oil Industry Insights, Market Analysis and Price Outlook

Crude Corner Swing Trade Position Update

On Sunday evening May 10, 2020 at 1800 EST, we entered a swing trade position.

Position Size: 10 Contracts

Trade Directions: Long

Contract: CLN20

Purchase Price: $26.04

Position Stopped Out at $31.57

Total trade profit: $55,800 inside of two weeks!

This particular trading strategy is the flagship of this system. We recommend only the highest probability of successful passive trades for massive income. These trades occur on average less than twice a month, but when they pay… they pay BIG!

Crude Corner Weekly Trade Recap … 5/18 – 5/22

Our bullish breakout confirmed a long entry at $30.75. We entered the trade with 3 targets: one contract to be executed at each target.

Once the first target contract was filled, we moved our stop to break even as there was no reason to risk our profit on the table for the remainder of the week.

Targets 2 and 3 later in the week were successfully filled.

So the total take for last week executing this strategy paid us $5,600.

Not too shabby for just having to set up the trade, move your stop to break even, step aside and let it ride!

Have you taken advantage of any of these crude oil moves?

If so, hit leave a comment and tell us what trade you took and how you did!

Oil prices rose to the highest level since March on Thursday, supported by lower United States crude inventories, OPEC-led supply cuts and recovering demand as governments ease restrictions imposed on people’s movements due to the coronavirus crisis.

In the latest sign the supply glut is easing, United States crude inventories fell approximately million barrels last week. Meanwhile, analysts had been expecting an increase.

The rally in the crude futures is beginning to approach levels in which United States shale production declines will begin to slow and possibly reverse as low cost producers attempt to generate revenue.

At the same time, there is evidence of recovering in fuel consumption.

Top United States airlines and Air Canada on Tuesday reported slower ticket cancellations and an improvement in bookings on some routes, though executives said overall demand remained relatively weak.

The Organization of the Petroleum Exporting Countries, Russia and other allies, known as OPEC+, agreed to cut supply by a record 9.7 million barrels per day from May 1.

So far in May, OPEC+ has cut oil exports by about 6 million BPD, according to companies that track the flows, suggesting a strong start in complying with the deal. OPEC says the market has responded well.

Unemployment Remains a Concern

With now nearly 39 million American workers on unemployment and countless Americans who are either ineligible to collect or are still waiting for their unemployment to be processed – growing recession / depression concerns linger.

YEARLY Crude Oil Cycles

  • The 10 year cycle makes a high on May 3 and then sells off sharply into May 25 after which it rallies from a major low.
  • The 20 year cycle rallies sharply into May 19 then trades sideways into month end.
  • The 30 year cycle rallies into May 14 then sells off into the end of the month.
  • The 10 and 30 year cycles both head down from the 14th May.

Key turning point dates:

  • May 4
  • May 18
  • May 29

MONTHLY Crude Oil Outlook ( JULY – CLN20 )

The mid $12.00 price area can absorb annual selling pressures. Above which the mid $39.00 price area remains a several week target. Potentially the mid $55.00 price area is in reach over the next several months.

Bullish Outlook:

The $28.00 price area can likely absorb selling pressure throughout the balance of May. Above which the mid $39.00 price area is the next near term several week target.

A daily settlement above the mid $39.00 price area indicates a good annual low has been made. Then the mid $55.00 price area would be attainable within several more weeks, likely making the high for the remainder of the year.

Bearish Outlook:

A weekly settlement below the $28.00 price area would most likely yield a $12.00 price area retest within several weeks, which would likely bottom out selling pressure for the remainder of the year.

WEEKLY Crude Oil Outlook ( JULY – CLM20 )

The main trend remains bearish according to the weekly swing chart, however, momentum has been trending higher since the formation of the closing price reversal bottom from the week-ending May 1.

The main trend will change to bullish on a trade through the nearest swing top at $54.86. This is highly unlikely, but there is room for a normal 50% to 61.8% retracement.

A trade through $17.27 will negate the closing price reversal bottom and will signal a resumption of the downward trend.

The minor trend is also bearish. A trade through $35.18 will change the minor trend to bullish. This will confirm the shift in near-term momentum. The minor range is $37.64 to $17.27. It’s 50% level at $27.46 is controlling the near-term direction of the market.

The short-term range is $54.86 to $17.27. It’s 50% level at $36.07 is the primary upside target. The weekly gap at $37.64 to $41.88 is another potential resistance zone. The main range is $62.95 to $17.27. It’s retracement zone at $40.11 to $45.50 is controlling the longer-term direction of the market.

Weekly Forecast

Based on last week’s price action, the direction of the July WTI crude oil market for the week-ending May 22 is likely to be determined by trader reaction to the 50% level at $27.46.

Bullish Scenario

A sustained move over $27.46 will indicate the presence of buyers. This could trigger a rally into the downtrending Gann angle at $28.86. Since the main trend is down, sellers could come in on the first test of $28.86, however, overtaking it could trigger an acceleration to the upside with near-term targets the minor top at $35.18 and the 50% level at $36.07.

Bearish Scenario

A sustained move under $27.46 will signal the presence of sellers. The first downside target is a downtrending Gann angle at $24.95. Crossing to the weak side of this angle will put the market in a bearish position with the first target a minor 50% level at $23.14, followed by the main bottom at $17.27.

Want to learn more about how Hawkeye can help you spot opportunities in the oil market? Tap here to view a no-cost presentation right now!

“Crude Corner”: Oil Industry Insights, Market Analysis and Price Outlook

Crude Corner Weekly Trade Recap: 5/11 – 5/15

Our bullish breakout confirmed a long entry at $27.15. We entered the trade with 3 targets — one contract to be executed at each target. Our first target was acquired at $28.35, locking in $1,200.

Once that target contract was filled, we moved our stop to break even as there was no reason to risk our profit on the table for the remainder of the week. Targets 2 and 3 were never successfully filled.

This being a passive, weekly trade strategy we closed out our 2 remaining contracts at the closing price of the 1400 EST candle on Friday afternoon at $29.59 paying us a generous $4,880.

That puts the total take for last week at just over $6,000 using this strategy!

Not too shabby for just having to set up the trade, move your stop to break even and close out the open contracts Friday afternoon.

The First Signs Of Real Oil Demand Recovery Are Here

United States West Texas Intermediate (WTI) crude oil futures are breaking out to the upside of a seven-session trading range, solidifying its third consecutive weekly higher close. The catalyst behind last week’s strength is a report that showed China’s daily crude oil throughput rebounded in April from a 15-month low in March as refiners cranked up operations to meet renewed fuel demand after lockdowns imposed to prevent the spread of the coronavirus outbreak were eased. Friday’s move was impressive, but upside momentum had been building most of the week with the market underpinned by a friendly government inventories report, the announcement of government crude oil purchases for its strategic reserve and a dampening of concerns over rising supply by the International Energy Agency (IEA).

China’s Daily Crude Oil Throughput Rebounds

China processed a total of 53.85 million tonnes of crude oil last month, data from the National Bureau of Statistics (NBS) showed on Friday, equivalent to about 13.1 million barrels per day (BPD). That was some 11% higher than 11.78 million BPD in March. The agency said on Friday it had adjusted the database of industrial enterprises it uses to help compile a range of production numbers. On that basis, April’s crude oil throughput was 0.8% above the year-ago level, it said; a Reuters calculation using NBS data from last year put the rise at 3.4%. Additionally, state-backed refiners have pushed up crude oil processing rates to around 79% in May, according to estimates from consultancy Longzhong Information Group, close to January’s 82% level before extensive movement restrictions were imposed to prevent the coronavirus spreading.

US to Buy Up to 1 Million Barrels of Oil for Emergency Reserve

The U.S. Energy Department said on Wednesday it will buy up to 1 million barrels of sweet crude for the government’s emergency petroleum reserve as part an effort to help producers struggling as the coronavirus strangles oil demand. The purchase of up to 1 million barrels “will serve as a test of the current conditions of physical crude oil available to the SPR as opposed to the financial market trading WTI NYMEX futures contracts,” the department said in a release. The department will purchase the oil from small to midsize domestic producers, it said.

Upbeat Supply/Demand Estimates

Oil prices are also being underpinned after a drop in U.S. crude stocks and an IEA forecast for lower global stockpiles in the second half. On Wednesday, the U.S. government reported that crude inventories fell for the first time in 15 weeks. Meanwhile, the International Energy Agency (IEA) on Thursday again forecast a record drop in demand in 2020 though it trimmed its estimate of the fall citing easing lockdown measures.

YEARLY Crude Oil Cycles

  • The 10 year cycle makes a high on May 3 and then sells off sharply into May 25 after which it rallies from a major low.
  • The 20 year cycle rallies sharply into May 19 then trades sideways into month end.
  • The 30 year cycle rallies into May 14 then sells off into the end of the month.
  • The 10 and 30 year cycles both head down from the 14th May.

Key turning point dates:

  • May 4
  • May 18
  • May 29

MONTHLY Crude Oil Outlook ( JULY – CLN20 )

The $12.00 price area can absorb annual selling pressures. Above which the mid $40.00 price area remains a several week target. Potentially the mid $55.00 price area is in reach over the next several months.

Bullish Outlook:

The mid $28.00 price area can likely absorb selling pressure throughout the balance of May. Above which the mid $40.00 price area is the next near term several week target.

A daily settlement above the mid $40.00 price area indicates a good annual low has been made. Then the mid $55.00 price area would be attainable within several months, likely making the high for the remainder of the year.

Bearish Outlook:

A weekly settlement below the mid $28.00 price area would likely yield a mid $12.00 price area retest within several weeks, which would likely bottom out selling pressure for the remainder of the year.

WEEKLY Crude Oil Outlook ( JULY – CLM20 )

The main trend remains bearish according to the weekly swing chart, however, momentum has been trending higher since the formation of the closing price reversal bottom from the week-ending May 1.

The main trend will change to bullish on a trade through the nearest swing top at $54.86. This is highly unlikely, but there is room for a normal 50% to 61.8% retracement.

A trade through $17.27 will negate the closing price reversal bottom and will signal a resumption of the downward trend.

The minor trend is also bearish. A trade through $35.18 will change the minor trend to bullish. This will confirm the shift in near-term momentum. The minor range is $37.64 to $17.27. It’s 50% level at $27.46 is controlling the near-term direction of the market.

The short-term range is $54.86 to $17.27. It’s 50% level at $36.07 is the primary upside target. The weekly gap at $37.64 to $41.88 is another potential resistance zone. The main range is $62.95 to $17.27. It’s retracement zone at $40.11 to $45.50 is controlling the longer-term direction of the market

Weekly Forecast

Based on last week’s price action, the direction of the July WTI crude oil market for the week-ending May 22 is likely to be determined by trader reaction to the 50% level at $27.46.

Bullish Scenario

A sustained move over $27.46 will indicate the presence of buyers. This could trigger a rally into the downtrending Gann angle at $28.86. Since the main trend is down, sellers could come in on the first test of $28.86, however, overtaking it could trigger an acceleration to the upside with near-term targets the minor top at $35.18 and the 50% level at $36.07.

Bearish Scenario

A sustained move under $27.46 will signal the presence of sellers. The first downside target is a downtrending Gann angle at $24.95. Crossing to the weak side of this angle will put the market in a bearish position with the first target a minor 50% level at $23.14, followed by the main bottom at $17.27.

Crude Corner Swing Trade Position

We acquired a LONG position at the open of the globex session on 5/10/20 @ 1800 EST. We purchased (10) CLN20 July WTI Light Sweet Crude Oil Futures Contracts @ $26.04. Our position is currently +/- $6.00 in the profit heading strong towards our $36.04 profit target. Our stop is already in the money and we are looking forward to closing out another passive trading for massive income crude oil trade for 2020!!!

Want to learn more about how Hawkeye can help you spot opportunities in the oil market? Tap here to view a no-cost presentation right now!

Crude Corner: Oil Industry Insights, Market Analysis and Price Outlook

Oil prices have rebounded from their recent lows and hopefully the worst is now over. The oil market appears like it may have already turned the corner. Perhaps we are in the inflection right now as we speak.

Prices recovered faster than many were forecasting due to lower-than-expected supply coupled with better-than-expected demand.

Data from the United States Energy Information Administration on Wednesday showed that the United States production is now 1.5 million barrels per day below its March all-time high level of 13.1 million BPD.

Beginning May 1, OPEC and its oil-producing allies took 9.7 million BPD offline, and on this past Monday Saudi Arabia, the group’s leader, said it would scale back production further in an effort to boost prices. The EIA’s data also showed that gasoline demand is beginning to recover as states start to ease shelter-in-place restrictions.

In April, May’s expiring West Texas Intermediate crude oil contract plunged below zero and into negative territory for the first time on record, but prices have since recovered and on Thursday the contract for June delivery traded around $26. Brent crude, the international benchmark, traded around $30.

By the end of 2021, WTI could be trading as high as $60, and Brent as high as $65, but there is some caution warranted. In order for the market to rebalance there needs to be a continued drawdown in inventories, and the production that has already come offline needs to stay offline for at least a sustainable period of time.

As we emerged from lockdown we got an immediate pop exhibited in this week’s trading.

Despite WTI’s rebound, prices are still about 60% below the January high level of the mid $65.00 price area, which has pressured producers as companies struggle to break even. Once demand catches up and producers look to adding supply again, access to capital markets will likely be limited.

Most investors have had enough of the energy sector. They already had enough going into this, and if they hadn’t had enough before they’re unlikely to be interested this time around. What that tells you, when they need to grow production they’re going to have to grow it out of cash flow, which means we’re going to see higher prices in the pipeline.

YEARLY Crude Oil Cycles

  • The 10 year cycle makes a high on May 3 and then sells off sharply into May 25 after which it rallies from a major low.
  • The 20 year cycle rallies sharply into May 19 then trades sideways into month end.
  • The 30 year cycle rallies into May 14 then sells off into the end of the month.
  • The 10 and 30 year cycles both head down from the 14th May.

Key turning point dates:

  • May 4
  • May 18
  • May 29

MONTHLY Crude Oil Outlook ( JULY – CLN20 )

The mid $12.00 price area can absorb annual selling pressures. Above the $29.00 price area remains a near term target. Potentially the mid $55.00 price area is in reach over the next several months.

Bullish Outlook:

The $29.00 price area can likely absorb buying pressure throughout the balance of May. Once tested, the market is susceptible to falling back to key support at the mid $12.00 price area within several weeks.

On the other hand, a daily settlement above the $29.00 price area indicates a good annual low has been made. A daily settlement above the $41.00 price area would then be expected within several weeks and then the mid $55.00 price area would be attainable within several months, likely making the high for the remainder of the year.

Bearish Outlook:

A weekly settlement below the mid $12.00 price area would likely yield a $5.00 price area retest within several weeks, the lowest price support presently found on any chart without revisiting negative price territories.

WEEKLY Crude Oil Outlook ( JUNE – CLM20 )

The main trend is bearish according to the weekly swing chart, but the closing price reversal bottom from the week ending May 1 and its subsequent confirmation, helped shift momentum to the upside.

The actual main trend will change to bullish on a trade through the last main bottom at $54.86. This is highly unlikely, however, there is room to the upside for the market to complete a normal 50% to 61.8% retracement.

A trade through $17.27 will negate the closing price reversal bottom and signal a resumption of the bearish trend.

The minor trend is also bearish. A trade through $35.18 will change the minor trend to bullish. This will confirm the shift in momentum to bullish. The minor range is $37.64 to $17.27. Its 50% level at $27.46 is providing resistance. This price level is also controlling the short-term direction of the market.

The short-term range is $54.86 to $17.27. Its 50% level at $36.07 is the next potential upside target. The main range at $40.11 to $45.50 is the major upside target.

Weekly Forecast

Based on last week’s price action, the direction of the July WTI crude oil market the week-ending May 15 is likely to be determined by a downtrending Gann angle at $26.95.

Bullish Scenario

A sustained move over $26.95 will indicate the presence of buyers. This could lead to a labored rally with targets including a 50% level at $27.46, followed by another downtrending Gann angle at $30.86. This is a potential trigger point for an acceleration to the upside with the next target a 50% level at $36.07.

Bearish Scenario

A sustained move under $26.95 will signal the presence of sellers. The first target is a minor pivot at $22.93, followed by the reversal bottom at $17.27.

Technical Outlook

In order to generate the momentum needed to drive this market away from the late April bottom, the buying is going to have to be strong enough to overcome the pair of downtrending Gann angles at $26.95 and $30.86.

Want to learn more about how Hawkeye can help you spot opportunities in the oil market? Tap here to view a no-cost presentation right now!

“Crude Corner”: Oil Industry Insights, Market Analysis and Price Outlook

The markets have been rallying for two weeks as investors have keyed in on signs of a slowdown in production and the easing of coronavirus-related restrictions across the globe. Back-to-back smaller than expected crude oil inventory builds have been supportive, but the rise in distillate stockpiles offset that news.

Positive geopolitical developments could be the bullish wildcard next week. On Friday, the markets garnered a little support after United States and Chinese officials discussed a trade deal agreed before the coronavirus outbreak, with both sides agreeing to implement the agreement.

We’re seeing a lot of short-covering, but traders have been reluctant to go long given the bearish fundamentals. This may change if prices pullback into a value area. Furthermore, traders are not going to gain confidence in playing the long side until they start to see that the attempts to reopen the economy are proving to be successful.

Despite the recent strength, traders should continue to look for heightened volatility and the possibility of a wicked two-sided trade as some momentum traders get bullish on the easing of restrictions and some turn bearish again as inventories continue to build.

The assumptions on the supply side that are driving prices higher right now are certainly supported by data. There has already been a massive decline in the rig count, taking the number of active rigs in America to new lows. That has a big impact on where we will be in the future, but unless there is enough demand to eat into the existing glut, that won’t make much difference to the short-term storage issue.

On the demand side, things aren’t as clear-cut. I hope and pray that things go smoothly as some states begin to reopen, but there is a chance that it is just too soon. If so and coronavirus cases spike, that anticipation of big increases in demand disappears and oil will likely collapse again. Even if the worst-case scenario doesn’t unfold though, reopening is a gradual process and it is hard to imagine that gasoline demand will be robust enough initially to allow for a further jump in crude over the next several weeks. Retail gasoline sales while better than they were, remain weak.

YEARLY Crude Oil Cycles

  • The 10 year cycle makes a high on May 3 and then sells off sharply into May 25 after which it rallies from a major low
  • The 20 year cycle rallies sharply into May 19 then trades sideways into month end.
  • The 30 year cycle rallies into May 14 then sells off into the end of the month.
  • The 10 and 30 year cycles both head down from the 14th May.

Key turning point dates:

  • May 4
  • May 18
  • May 29

MONTHLY Crude Oil Outlook ( JULY – CLN20 )

The $13.00 price area can absorb annual selling pressures. Above the mid $29.00 price area remains a several week target. Potentially the mid $55.00 price area is in reach over the next several months.

Bullish Outlook:

The mid $29.00 price area can likely absorb buying pressure throughout the balance of May. Once tested, the market is susceptible to falling back to key support at the $13.00 price area within several weeks.

On the other hand, a daily settlement above the mid $29.00 price area indicates a good annual low has been made. Then the mid $41.00 price area would be expected within several weeks and the mid $55.00 price area then attainable within several months, likely making the high for the remainder of the year.

Bearish Outlook:

A weekly settlement below the $13.00 price area would likely yield a $5.00 price area retest within several weeks, the lowest price support presently found on any chart without revisiting negative price territories.

WEEKLY Crude Oil Outlook ( JULY – CLM20 )

The main trend is bearish according to the weekly swing chart, but the closing price reversal bottom from the week ending May 1 and its subsequent confirmation, helped shift momentum to the upside.

The actual main trend will change to bullish on a trade through the last main bottom at $54.86. This is highly unlikely, however, there is room to the upside for the market to complete a normal 50% to 61.8% retracement.

A trade through $17.27 will negate the closing price reversal bottom and signal a resumption of the bearish trend.

The minor trend is also bearish. A trade through $35.18 will change the minor trend to bullish. This will confirm the shift in momentum to bullish. The minor range is $37.64 to $17.27. Its 50% level at $27.46 is providing resistance. This price level is also controlling the short-term direction of the market.

The short-term range is $54.86 to $17.27. Its 50% level at $36.07 is the next potential upside target. The main range at $40.11 to $45.50 is the major upside target.

Weekly Forecast

Based on last week’s price action, the direction of the July WTI crude oil market the week-ending May 15 is likely to be determined by a downtrending Gann angle at $26.95.

Bullish Scenario

A sustained move over $26.95 will indicate the presence of buyers. This could lead to a labored rally with targets including a 50% level at $27.46, followed by another downtrending Gann angle at $30.86. This is a potential trigger point for an acceleration to the upside with the next target a 50% level at $36.07.

Bearish Scenario

A sustained move under $26.95 will signal the presence of sellers. The first target is a minor pivot at $22.93, followed by the reversal bottom at $17.27.

Technical Outlook

In order to generate the momentum needed to drive this market away from the late April bottom, the buying is going to have to be strong enough to overcome the pair of downtrending Gann angles at $26.95 and $30.86.

Want to learn more about how Hawkeye can help you spot opportunities in the oil market? Tap here to view a no-cost presentation right now!

“Crude Corner”: Oil Industry Insights, Market Analysis and Price Outlook

Oil prices traded in positive territory on Thursday, but retreated from session highs during afternoon trading.

Several bullish factors supported prices, including United States companies cutting production, Saudi Arabia raising their official oil selling price and gasoline demand improving as economies around the world begin to start the reopening process.

WTI – CLM20, the United States benchmark, gained 1.5%, or 36 cents, to trade at $24.26 per barrel.

Earlier in Thursday’s session WTI had been up more than 11%, hitting a session high of $26.74.

This week, WTI has gained more than 27%, putting it on pace for one of its best weeks on record going back to the contract’s inception in 1983.

Of course, given the more than 50% decline this year a smaller move now accounts for a significantly larger percentage change.

Data from the Energy Information Administration showed that for the week ending May 1 production declined by 200,000 barrels per day to 11.9M BPD, which is more than 1M BPD below March’s record high.

Exxon, Chevron and ConocoPhillips are among the companies that have cut production in the face of depressed prices.

While inventory in the United States is still rising, it’s now at a slower pace.

Last week, stockpiles grew by 4.6M Barrels, which was smaller than the 8.67M Barrels build analysts had been expecting.

While the demand for gasoline is still well below its highs, government data showed that it is starting to turn a corner as states start to open up their economies.

All eyes were on yesterday morning’s Unemployment Claims Report.

With now 33.5+ Million Americans put on unemployment within the last 7 weeks, and countless people who have been unable to successfully file, things to come remain rather grim looking.

So the question is … Is this rally overdone?

Given WTI’s nearly 40% gain this month, some say the rally is overdone, especially as storage around the world continues to fill.

Looking forward to June’s contract expiration may likely cause some anxiety in the market after what transpired last month when May’s contract expiration traded negative.

Time will tell as it always does!

YEARLY Crude Oil Cycles

  • The 10 year cycle makes a high on May 3 and then sells off sharply into May 25 after which it rallies from a major low.
  • The 20 year cycle rallies sharply into May 19 then trades sideways into month end.
  • The 30 year cycle rallies into May 14 then sells off into the end of the month.
  • The 10 and 30 year cycles both head down from the 14th May.

Key turning point dates:

  • May 4
  • May 18
  • May 29

MONTHLY Crude Oil Outlook ( JULY – CLN20 )

The mid $13.00 price area can absorb annual selling pressures. Above the $30.00 price area remains a several week target. Potentially the 57.00 price area is in reach over the next several months.

Bullish Outlook:

The $30.00 price area can likely absorb buying pressure throughout the balance of May. Once tested, the market is susceptible to falling back to key support at the mid $13.00 price area within several weeks.

On the other hand, a daily settlement above the $30.00 price area indicates a good annual low has been made. Then the $42.00 price area would be expected within several weeks and the $57.00 price area then attainable within several months, then likely making the high for the remainder of the year.

Bearish Outlook:

A weekly settlement below mid $13.00 price area would likely yield a $5.00 price area retest within several weeks, the lowest price support presently found on any chart without revisiting negative price territories.

WEEKLY Crude Oil Outlook ( JUNE – CLM20 )

The main trend remains bearish according to the weekly swing chart. The market isn’t close to turning the main trend to bullish, but there is room for a normal 50% to 61.80% retracement. A trade through $6.50 will signal a resumption of the downtrend.

Based on last week’s price action, the direction of the June WTI crude oil market for this week-ending May 8 is likely to be determined by trader’s reaction to the pivot at the $20.00 price area.

Watch the price action and read the order flow at the $20.00 price area all week. Trader’s reaction to this level will set the tone. The market could get bullish over the $20.00 price area and bearish under the $11.00 price area

Bullish Scenario

A sustained move over the $20.00 price area will indicate the bulls are getting stronger. If this move is able to generate enough upside momentum then look for the rally to possibly extend into the resistance cluster at the $30.00 price area.

Bearish Scenario

A sustained move under the $20.00 price area will signal the presence of bears. The first downside target is a steep downtrending angle at the $11.00 price area. Crossing to the weak side of this angle will put the market in a bearish position with the next target the $6.50 price area.

Want to learn more about how Hawkeye can help you spot opportunities in the oil market? Tap here to view a no-cost presentation right now!

“Crude Corner”: Oil Industry Insights, Market Analysis and Price Outlook

United States West Texas Intermediate Crude Oil Futures were up for a third straight session when closing out last week’s trading activity as major producers began output cuts to offset a slump in fuel demand triggered by the coronavirus pandemic, while reported data showed United States Crude Inventories grew less than expected.

Futures prices are now within striking distance of the close on April 20 which is the day before the steep drop that saw nearby May futures plunging into negative territory for the first time in history. This move would diminish the impact of the historic break in crude oil just two weeks ago.

OPEC+ Production Cuts Began

Reflecting the output cuts agreed between OPEC and other major producers like Russia, a grouping known as OPEC+, the imbalance between oil supply and demand is set to be halved to 13.6 million barrels per day (BPD) in May, and drop further to 6.1 million BPD in June.

U.S. Firms Cutting Production

Traders are saying production cuts of almost 10 million bpd by OPEC and it’s allies or about 10% of global production, which is due to take effect from May 1, are not going to have that much of an impact on prices without the United States curbing its own output.

While storage is rapidly filling up, production cuts by U.S. shale producers, are estimated at 300,000 BPD for May and June, should help slow the flow of excessive inventory into the reserve tanks.

Additionally, regulators in the U.S. state of Texas, the country’s biggest oil producer, will hold a vote on May 5 on whether to enact output curtailments. Officials in the states of North Dakota and Oklahoma are also examining ways to legally allow output cuts.

Oversupply Concerns Dampened

Storage concerns continue to weigh on markets with the International Energy Agency (IEA) warning that global capacity could reach its maximum by mid-June and that energy demand could slump by a record 6% in 2020 due to lockdowns. Nevertheless, WTI and Brent crude oil are rallying because of an easing of worries over rising United States stockpiles.

It started late Tuesday last week with the release of the American Petroleum Institute (API) weekly inventories report that showed a smaller than expected build, and continued on Wednesday when the United States Energy Information Administration (EIA) reported numbers below forecasts.

According to the EIA, United States crude inventories grew by 9 million barrels last week to 527.6 million barrels, well below the 10.4 million-barrel rise analysts had expected.

United States gasoline stockpiles fell by 3.7 million barrels from record highs the previous week, with a slight rise in fuel demand offsetting a rebound in refinery output.

Demand Destruction Will Continue to Weigh on Prices

Prices are likely to fall further this year even as countries begin to ease restrictions imposed to counter the viral outbreak and the output cuts by big producers will not fix the supply glut.

The estimated shortfall this year is expected to be about 30 million BPD of demand. The impact of the coronavirus pandemic has obliterated demand with much of the world’s population still under some form of economic and/or social lockdown.

Short-Term Outlook

Gains are likely to be capped and selling pressure may resume over the short-run since the 30 million BPD plunge in demand is three times the size of the OPEC+ output cuts.

Prices could remain underpinned over the near-term, however, because of signs of a tightening of United States supply. Bullish traders and domestic oil companies are hoping this develops into a worthy trend. Nonetheless, industry professionals would like to see more aggressive cuts in production by United States producers.

What we’re seeing in the futures market is most likely profit-taking and light short-covering. Storage capacity is getting close to overflowing, but at a slower speed so short-sellers are merely making adjustments.

The smaller inventory builds should be noted but we’re going to need to see a continuation of this trend in the coming weeks to suggest the worst might be behind us. However, the reality is the already-stretched storage capacity is getting fuller and fuller every week, a rise in prices cannot be sustainable for long as the problem is still far from being resolved.

YEARLY Crude Oil Cycles

  • The 10 year cycle makes a high on May 3 and then sells off sharply into May 25 after which it rallies from a major low.
  • The 20 year cycle rallies sharply into May 19 then trades sideways into month end.
  • The 30 year cycle rallies into May 14 then sells off into the end of the month.
  • The 10 and 30 year cycles both head down from the 14th May.

Key turning point dates:

  • May 4
  • May 18
  • May 29

MONTHLY Crude Oil Outlook ( JULY – CLN20 )

The mid $14.00 price area can absorb annual selling pressures. Above the $31.00 price area remains a several week target. Potentially the 57.00 price area is in reach over the next 3-5 months.

Bullish Outlook:

The $31.00 price area can likely absorb buying pressure throughout the balance of May. Once tested, the market is susceptible to falling back to key support at the mid $14.00 price area within several weeks.

On the other hand, a daily settlement above the $31.00 price area indicates a good annual low has been made. Then the $43.00 price area would be expected within several weeks and the $57.00 price area then attainable within several months, likely the high for the year.

Bearish Outlook:

A weekly settlement below mid $14.00 price area would likely yield a $5.00 price area retest within several weeks, the lowest price support presently found on any chart without revisiting negative price territories.

WEEKLY Crude Oil Outlook ( JUNE – CLM20 )

The main trend remains bearish according to the weekly swing chart. The market isn’t close to turning the main trend to bullish, but there is room for a normal 50% to 60% retracement. A trade through $6.50 will signal a resumption of the downtrend.

Based on last week’s price action, the direction of the June WTI crude oil market for this week-ending May 8 is likely to be determined by trader’s reaction to the pivot at the $20.00 price area.

Watch the price action and read the order flow at the $20.00 price area all week. Trader’s reaction to this level will set the tone. The market could get bullish over the $20.00 price area and bearish under the $11.00 price area.

Bullish Scenario

A sustained move over the $20.00 price area will indicate the bulls are getting stronger. If this move is able to generate enough upside momentum then look for the rally to possibly extend into the resistance cluster at the $30.00 price area.

Bearish Scenario

A sustained move under the $20.00 price area will signal the presence of bears. The first downside target is a steep downtrending angle at the $11.00 price area. Crossing to the weak side of this angle will put the market in a bearish position with the next target the $6.50 price area.

Want to learn more about how Hawkeye can help you spot opportunities in the oil market? Tap here to view a no-cost presentation right now!

“Crude Corner”: Oil Industry Insights, Market Analysis and Price Outlook

Oil and gas exploration and production companies are slated to lose a staggering $1 trillion in revenues in 2020. The industry, which includes oil majors, made $2.47 trillion in revenues globally last year. But this year it’s projected to bring in $1.47 trillion, reflecting a 40% decline year-on-year.

This comes as the coronavirus pandemic and ensuing lockdowns cripple demand and force companies to slash spending and cancel projects. Before the virus began to hit economies, revenues for 2020 were expected to reach $2.35 trillion. Returns for 2021 are now also projected lower, at $1.79 trillion compared to a forecast of $2.52 trillion before the pandemic.

Crude Oil Inventories reported on Wednesday rose LESS THAN forecasted. A 9M Barrel build as opposed to a predicted 11.2M Barrel build. This, in conjunction with the talks of a soft reopenings for economies around the world and the OPEC+ deal cuts going into effect May 1, prices have started to rally

Jobless claims continue to rise. New claims reached 3.84 million last week, bringing the total to 30.3 million for the last six weeks. The number of total claims makes this the worst unemployment crisis in United States history. The greatest consumers in the world are jobless and confined. To see these weekly jobless claims begin to reverse would give crude oil a great boost!

CLM20 has been Blacklisted, I spoke with TradeStation to try to get some clarification as to when client’s will be able to trade the front month CL contract again – the June CLM20 Contract has been blacklisted due to last week’s little adventure into the negatives. The July contract CLN20 is able to be traded today and as long as the market remains stable moving forward it will be able to be traded as the “front month” after the June contract expires.

Long-Term MONTHLY Price Outlook

The $12.00 price area can potentially absorb annual selling pressure, above which the mid $29.00 price area remains a several week target, the $57.00 price area is potentially in reach over the next several months.

Upside, the mid $29.00 price area can absorb buying pressure through the remaining May trading sessions, with a daily settlement above the mid $29.00 price area indicating a good annual low has been placed.

The $57.00 price area then becomes a several month target where the broader market can potentially place this calendar year’s high.

Downside, a daily settlement below the $12.00 price area will most likely yield a single digit or even a potentially negative price area retest within several days to follow.

Mid – Term WEEKLY Price Outlook … 4 / 27 – 5 / 1

The main trend remains bearish according to the weekly swing chart.

A trade through the $6.00 price area will signal a resumption of the downtrend.

The main trend will change to bullish on a trade through the last main top at the $55.00 price area. However, this is extremely unlikely.

The minor trade range is between the $34.00 price area to $6.00 price area.

It’s 50% level or pivot point is at the $20.00 price area.

The short-term trade range is between the $55.00 price area to the $6.00 price area.

It’s 50% level comes in at the $31.00 price area.

The main trade range is the $64.00 price area to $6.00 price area.

It’s 50% to 60% retracement zone which is between the $35.00 price area and the $42.00 price area serves as a major price resistance.

Weekly Technical Forecast

Based on last week’s price action, the direction of the June WTI crude oil futures contract for the week-ending May 1 is likely to be determined by trader reaction to a downtrending angle at the $15.00 price area.

Weekly Bullish Scenario

A sustained move over the $15.00 price area will indicate the presence of buyers.

If this move creates enough upside momentum then look for a surge into the minor pivot at the $20.00 price area.

Since the main trend remains bearish, sellers are likely to come in on the first test of this level.

In attempts of the bears trying to overtake it, could potentially trigger an acceleration to the upside with the next major target coming in at the $31.00 price area.

Weekly Bearish Scenario

A sustained move under the $15.00 price area will signal the strong return of sellers.

The daily chart indicates there is plenty of room to the downside with the next downtrending target angle coming in at negative price areas.

Short – Term DAILY Price Outlook … May 1, 2020

For Friday, the $12.00 price area remains a long-term support level that can absorb not only daily selling, but also selling pressure throughout the balance of May’s trading activity as long as the market continues placing weekly and monthly settlements above the $12.00 price area.

The next several weeks are likely to yield an upside potential of testing the $30.00 price area.

Upside today, the $19.00 price area most likely contains initial strength, beyond which the $24.00 price area is able to contain the balance of the session’s strength.

A settlement today above the $24.00 price area indicates potentially reaching the $30.00 price area within several days.

Downside today, a weekly settlement below the $12.00 price area allows a further fall to the single digit price area within days.

Want to learn more about how Hawkeye can help you spot opportunities in the oil market? Tap here to view a no-cost presentation right now!

“Crude Corner”: Oil Industry Insights, Market Analysis and Price Outlook

The late-week rally we experienced last week was likely being fueled by short-covering rather than speculative buying.

Nothing has changed in the fundamentals to turn the energy complex bullish in the last several days.

Oil remains under pressure and will continue to be for a little while, as world economies are attempting to reopen very slowly in the United States and Western Europe, although resumption in China still remains further down the line.

With May 1 approaching fast, the big question is how will the supply side deliver?

Prices could continue to firm up for this week if more OPEC+ members announce early production cuts.

An escalation of military activity in the Middle East would also be a driving factor for high prices.

However, the wildcard will be the announcement of oil output cuts made by the United States oil producers.

This news could potentially trigger a steep short-covering rally.

The demand destruction is expected to continue, but may slow down a bit if the COVID-19 curve continues to flatten.

Once the coronavirus is under control, output should rebound as well as prices, but don’t expect output or prices to return to pre-virus levels for quite some time.

Rising Tensions In The Middle East Threaten Supplies

After June futures hit $6.50 per barrel and the nearby futures contract went off the board, prices rose in reaction to an announcement from President Donald Trump in which he instructed the United States Navy to fire on any Iranian ships that harass them in the Gulf, although he added later he was not changing the military’s rules of engagement.

This ratchets up tensions once again between the United States and Iran.

However, given the glut we have in the oil market, it is difficult to see this offering lasting support to the market, unless the situation does escalate further.

From A Purely Technical Perspective…

Look out for a strong bullish upside bias to develop on a sustained move above the $20.00 price area…

And look out for a strong bearish downside bias to continue on a sustained move below the $15.00 price area.

April Crude Oil YEARLY Cycles

  • The 10 year cycle makes a high on April 15, then pulls back into April 19 then makes a major top on May 2.
  • The 20 year cycle makes a major low on April 11 then rallies into the April 25.
  • The 30 year cycle continues its sell off into April 18 then rallies into the end of the month.

April is the second most bullish month of the year for crude oil.

With that said, there’s really no clear correlation to support that statement.

But, there is a seasonal tendency for oil prices to rally during the latter part of this month.

Key turning point dates:

  • April 3
  • April 16 to 17 – close to 10 and 30 year cycles
  • April 23 to 24 – close to 20 year cycle

Long-Term MONTHLY Price Outlook

The $12.00 price area can potentially absorb annual selling pressure, above which the $30.00 price area remains a several week target, the $57.00 price area is potentially in reach over the next several months.

Upside, the $30.00 price area can absorb buying pressure through May trading sessions, a daily settlement above the $30.00 price area indicates a good annual low has been placed.

Then the $57.00 price area becomes a several month target where the broader market can potentially place this calendar year’s high.

Downside, a daily settlement below the $12.00 price area will most likely yield a $1.00 price area test within several days to follow, the lowest price support presently found on any chart.

Further downside action would likely result in another negative price retest like we saw during the last week on the CLK20 expiring contract.

Mid – Term WEEKLY Price Outlook … 4 / 27 – 5 / 1

The main trend remains bearish according to the weekly swing chart.

A trade through the $6.00 price area will signal a resumption of the downtrend.

The main trend will change to bullish on a trade through the last main top at the $55.00 price area.

However, this is extremely unlikely.

The minor trade range is between the $34.00 price area to $6.00 price area.

It’s 50% level or pivot point is at the $20.00 price area.

The short-term trade range is between the $55.00 price area to the $6.00 price area.

It’s 50% level comes in at the $31.00 price area.

The main trade range is the $64.00 price area to $6.00 price area.

It’s 50% to 60% retracement zone which is between the $35.00 price area and the $42.00 price area serves as a major price resistance.

Weekly Technical Forecast

Based on last week’s price action, the direction of the June WTI crude oil futures contract for the week-ending May 1 is likely to be determined by trader reaction to a downtrending angle at the $15.00 price area.

Weekly Bullish Scenario

A sustained move over the $15.00 price area will indicate the presence of buyers.

If this move creates enough upside momentum then look for a surge into the minor pivot at the $20.00 price area.

Since the main trend remains bearish, sellers are likely to come in on the first test of this level.

In attempts of the bears trying to overtake it, could potentially trigger an acceleration to the upside with the next major target coming in at the $31.00 price area.

Weekly Bearish Scenario

A sustained move under the $15.00 price area will signal the strong return of sellers.

The daily chart indicates there is plenty of room to the downside with the next downtrending target angle coming in at negative price areas.

Short – Term DAILY Price Outlook … April 28, 2020

For Tuesday, the $12.00 price area remains a long-term support level that can absorb not only daily selling, but also selling pressure throughout the balance of May’s trading activity as long as the market continues placing weekly and monthly settlements above the $12.00 price area.

Upside today, the $17.00 price area would most likely contain initial strength, beyond which the $19.00 price area is able to contain the balance of the session’s strength.

A settlement today above the $19.00 price area indicates potentially reaching the $22.00 price area within several days and a next $30.00 price area target could then potentially be within reach by the end of next week.

Downside today, opening / breaking below the $12.00 price area allows a further fall to the $11.00 price area intraday.

A weekly settlement today below the $12.00 price area critical support will likely allow for further bearish downside back into the single digit prices again, potentially as low as the $1.00 price area by the week’s end.

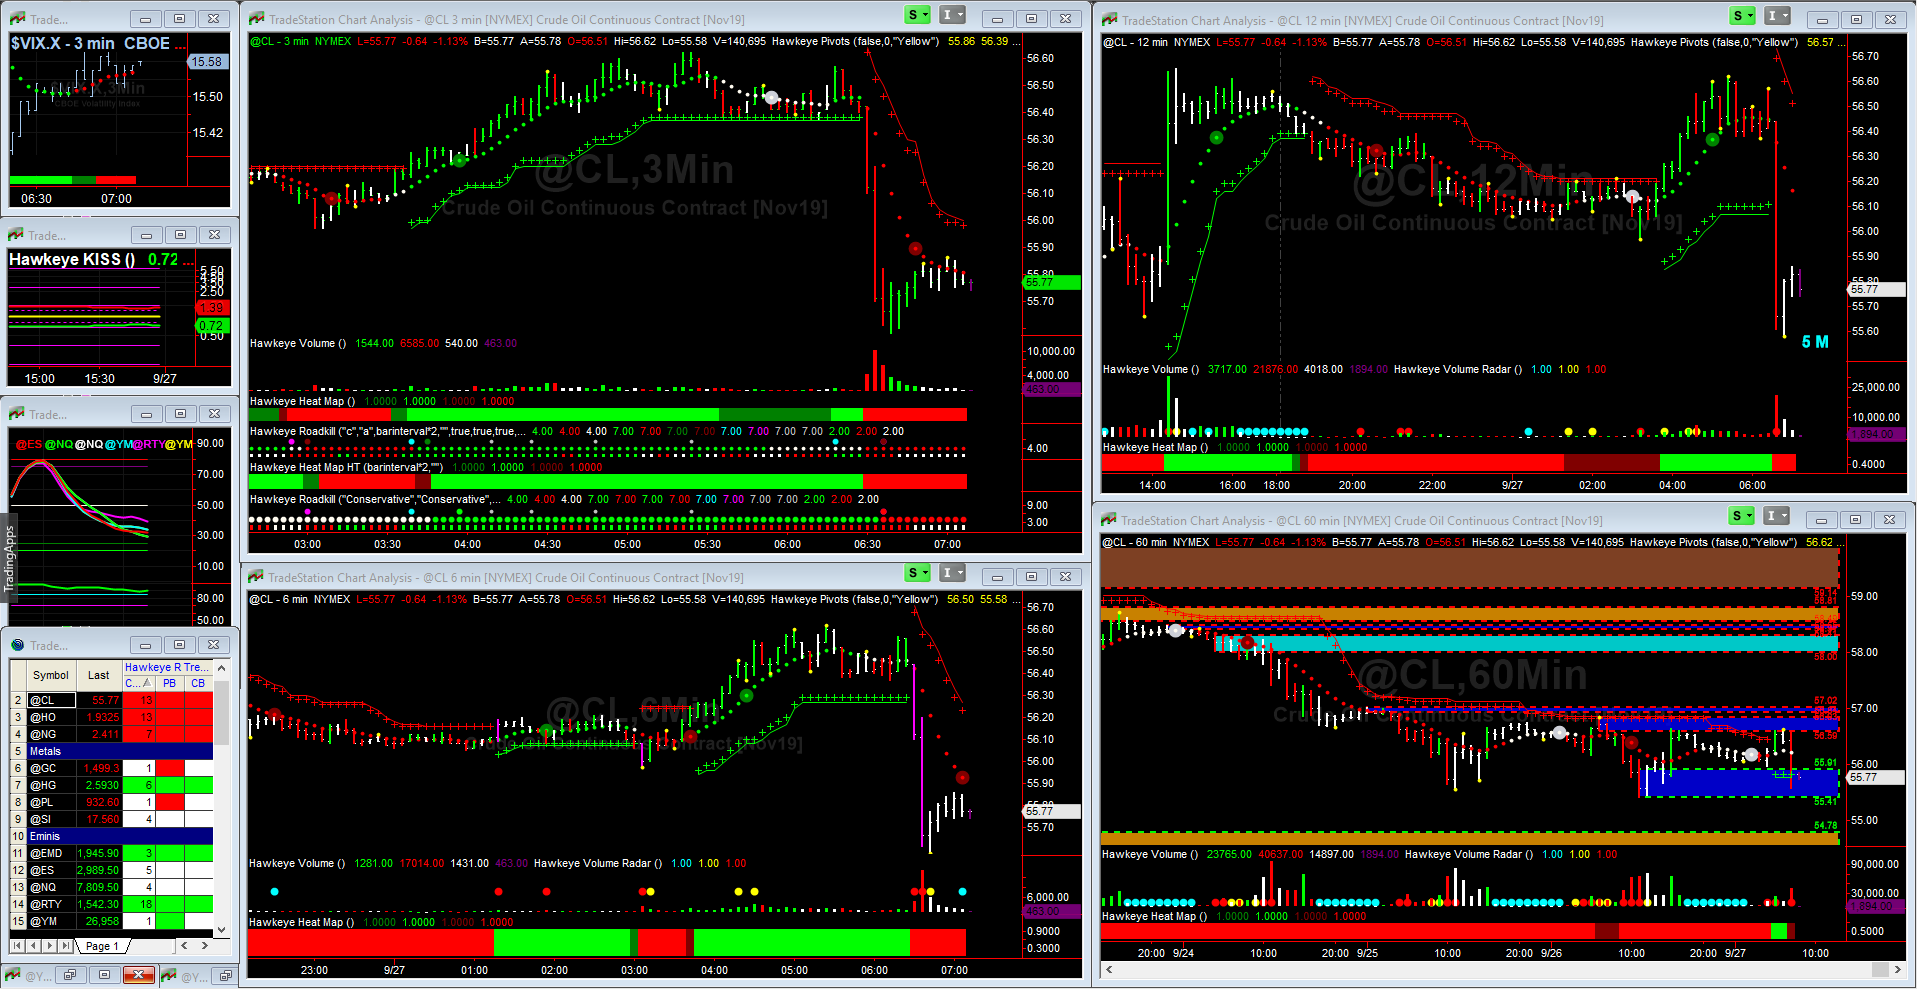
Let’s reflect on Monday’s charts above.

The price action on the 240 minute chart(s) exited congestion during the pre-market hours on Monday morning on the currently traded and 2 future expiring contracts.

A successful retest of the $12.00 price area held prices from falling further.

Today’s closing price on the closest expiring contract CLM20 was $12.93.

Fresh Hawkeye Demand Zone(s) on the 240 / 480 / 960 Minute and Daily Charts all held selling pressure from falling further during Monday’s trading session.

Confluence among Hawkeye Supply and Demand Zones stacks the odds in our favor of predicting price action and are key for establishing price targets.

The Zones on the 240, 480 & 960 Minute charts all presented clear target(s) to have taken a short position when price exited congestion on the 240 chart.

While there is clearly a bearish sediment in the market, the $12.00 price area remains a key area to hold and resume closing above in order to avoid retesting single digit prices again.

Want to learn more about how Hawkeye can help you spot opportunities in the oil market? Tap here to view a no-cost presentation right now!

“Crude Corner”: Oil Industry Insights, Market Analysis and Price Outlook

On Wednesday, the United States Energy Information Administration reported that U.S. crude inventories rose another 15 million barrels for the week ended April 17 to 518.6 million barrels.

That marked a 13-week climb and followed a record weekly increase of 19.2 million barrels a week earlier.

Another large oil build propels us closer to a record oil inventory level, which is now less than 17 million barrels away.

As refining activity dips to a new 12-year low, the crude build has actually been kept in check by lower oil imports – dropping below 5 million barrels per day for the first time in the weekly data since 1992.

Rising Unemployment, Rising Oil Inventory

The Labor Department reported that the number of Americans applying for state unemployment benefits totaled 4.427 million last week.

Combined with the prior four jobless claims reports, the number of Americans who have filed for unemployment over the last five weeks is 26.45 million.

That number far exceeds the 22.442 million jobs added to payrolls since November 2009, when the U.S. economy began to add jobs back after the recession.

The bottom line is that 26.45M people are NOT consuming products produced by crude oil.

They aren’t commuting, going to the gym, going out to dinner or leisurely traveling.

April Crude Oil YEARLY Cycles

  • The 10 year cycle makes a high on April 15, the pulls back into April 19 then makes a major top on May 2.
  • The 20 year cycle makes a major low on the April 11 then rallies into the April 25.
  • The 30 year cycle continues its sell off into April 18 then rallies into the end of the month.

Historically, April is the second most bullish month of the year for crude oil.

With that said, there’s really no clear correlation to support that statement right now.

But, there is a seasonal tendency for oil prices to rally during the latter part of this month.

Key turning point dates:

  • April 3
  • April 16 to 17 – close to 10 and 30 year cycles
  • April 23 to 24 – close to 20 year cycle

Long-Term MONTHLY Price Outlook

The $12.00 price area can potentially absorb annual selling pressure, above which the $28.00 price area remains a several week target, the $57.00 price area is potentially in reach over the next several months.

Upside, the $28.00 price area can absorb buying pressure through the remaining May trading sessions, with a daily settlement above the $28.00 price area indicating a good annual low has been placed.

The $57.00 price area then becomes a several month target where the broader market can potentially place this calendar year’s high.

Downside, a daily settlement below the $12.00 price area will most likely yield a $3.00 price area test within several days to follow, the lowest price support presently found on any chart.

Further downside would result in another negative price retest like we saw earlier in the week on the May CLK20 expiring contract.

WEEKLY Price Outlook … April 20 – 24, 2020

The main trend remains bearish according to the weekly swing chart.

The market is in no position to change the main trend to bullish, but holding the mid-March bottom at $21.00 price area which could help June WTI crude oil build a solid enough base to support a strong short-covering rally…

While the short-term trend also remains bearish.

Taking out the short-term top at the $34.00 price area won’t change the main trend to bullish, but it will shift momentum to the upside.

Taking out $21.00 price area will reaffirm the downward bearish trend.

The short-term range is between the $21.00 to $34.00 price range.

Its 50% level or pivot at the $28.00 price area is controlling the weekly direction of the market.

On the upside, the nearest 50% level resistance comes in at the $38.00 price area.

Based on the past week’s price action, the direction of the June WTI crude oil market for the week ending April 24 is likely to be determined by trader reaction to the pivot at the $28.00 price area.

Downside, a sustained move under the $28.00 price area will indicate the strong presence of sellers.

The first target is the main bottom at the $21.00 price area.

Penetrating this bottom will indicate the selling pressure is gaining traction.

Crossing to the weak side of the downtrending angle at $19.00 price area will put the June WTI futures contract in an extremely bearish position, most likely creating a further downside move.

Upside, a sustained move over the $28.00 price area will signal the presence of optimistic buyers.

If this move is able to create enough upside momentum then look for a potential spike into the $34.00 price area.

Short – Term DAILY Price Outlook … April 24, 2020

For Friday, the $12.00 price area remains a long-term support level that can absorb not only daily selling, but also selling pressure throughout the balance of May’s trading activity as long as the market continues placing weekly and monthly settlements above $12.00 price area.

The next several weeks are likely to yield an upside potential of testing the $30.00 price area.

Upside today, the $19.00 price area most would likely contain initial strength, beyond which the $22.00 price area is likely and able to contain the balance of the session’s strength.

A settlement today above the $22.00 price area indicates potentially reaching the $27.00 price area within several days.

Downside today, breaking below the $12.00 price area allows a further fall to the $11.00 price area intraday.

A weekly settlement today below the $12.00 price area will likely allow further downside to the $3.00 price area next week.

Want to learn more about how Hawkeye can help you spot opportunities in the oil market? Tap here to view a no-cost presentation right now!

“Crude Corner”: What In The History Of Crude Happened Yesterday?

While the markets were spiking last week thanks to some optimism on the COVID-19 vaccine and promising plans to begin a slow reopening of the United States economy, oil is once again marching to the beat of a different drum. 

Having suffered the most precipitous collapse ever with prices never seen before and even trading into the negative, something more positive is apparent. This is not reflected in the immediate trading price. Rather, this is being reflected in future expiring contract trading prices attempting to recover.

Want to learn more about how Hawkeye’s volume-based suite of indicators can help you spot opportunities on oil?

Click here to catch an in-depth class at no cost!

“Crude Corner”: This Week’s Crude Oil Roundup

Weekly Crude Oil Inventory Report

Oil dropped to its lowest level in more than 18 years during Wednesday’s trading session amid reports suggesting persistent oversupply and collapsing demand due to COVID-19 outbreak related economic lockdowns.

The American Petroleum Institute (API) said on Tuesday, United States crude inventories increased by a larger than expected amount of 13.1 million barrels. According to data from the United States Energy Information Administration, for the week ending April 10 inventory increased by 19.2 million barrels.

Analysts had been expecting a rise of 12.02 million barrels. There is no feasible agreement that could possibly cut supply by enough to offset such near-term demand losses.

Headlines Suppressing Demand

Consumer and manufacturing reports for March showed a significant hit to the economy from the COVID-19 outbreak was even swifter and deeper in the early weeks of the shutdown than anticipated.

March retail sales fell 8.7%, the most ever recorded in government history. The New York regional manufacturing activity hit an all-time low, declining a shocking 78.2%. Industrial production slipped 5.4%, the largest decline since 1946, and manufacturing was down 6.3%, a record reflecting in part the 28% decline in auto production as plants shut down.

The economic reports showed the double whammy of state shutdowns in mid-March on two pillars of the economy – the consumer and business. The reports were even more dire than expected, and foreshadow even worse declines in April’s activity, with state shutdowns affecting areas responsible for more than 90% of the economy.

Unemployment Suppressing Demand

The Labor Department reported that the number of Americans applying for state unemployment benefits totaled 5.245 million last week.

Combined with the prior three jobless claims reports, the number of Americans who’ve filed for unemployment over the last four weeks is 22.025 million.

That number is just below the 22.442 million jobs added to payrolls since November 2009, when the U.S. economy began to add jobs back after the recession.

Nearly an Entire Decade of Progress Set Back in Only 4 Weeks Time

In 4 weeks time we have nearly given back all of our employment progress made in the past decade. That’s 22 million cars that don’t get started and driven to work everyday, along with 22 million incomes that have been impacted causing no travel demand, creating limited forms of consumption. In conjunction with heavy over supply and forced suppressed demand due to shutdown orders, the foreseeable future for energy prices look very grim.

On The Charts

Upside Scenario: 38.21 can contain buying through May, once tested the market is susceptible to falling back to 21.83 within 2-3 weeks. On the other hand, a daily settlement above 38.21 would indicate a good low into summer activity, 57.50 then expected within 2-3 months.

Downside Scenario: A weekly settlement below 21.83 (and below the recent 21.51 low weekly- settlement) would indicate 12.17 within 3-5 weeks, the next long-term support threshold able to absorb selling through the year, and regarding 12.17, quite possibly the balance of the decade.

Want to learn more about how Hawkeye’s volume-based suite of indicators can help you spot opportunities on oil?

Click here to catch an in-depth class at no cost!

V-Swarm Identifies Weakness in CL Trade

v-swarm identifies weakness

In today’s update, I show a quick crude oil trade where Hawkeye V-Swarm identifies weakness in the trade. This allows me to exit with a small profit and stay out of trouble.

One of the most difficult aspects of trading is knowing when to cut a trade.

Especially when you have seen some profit and it begins to move against you (like it just did for me).

The greed in you wants to hold on to get the profit you once saw back.

Today I talk about how to know when to hold on to that trade vs when to close that trade down and put your money to work in a better opportunity.

V-Swarm Identifies Weakness

You see, volume is a leading indicator. Using volume correctly with price enables us to know the sentiment of the market on any timeframe. So when I saw Hawkeye V-Swarm (volume) showing me weakness in the trade was developing, I had time to adjust my stops and lock in profits in a trade that would have ended in a stop loss. V-swarm identifies weakness and strength in trends, so it can help improve your bottom line.

The Hawkeye Perspective

While in the longterm, the trade would probably work out (and it did), I followed my rules to stay safe and be able to trade another day. Sometimes, “you gotta know when to hold ’em, and know when to fold ’em”. In today’s example, I knew when to fold ’em and walk away.

If you want to learn more about trading with V-swarm and the Hawkeye way you can attend an on demand webinar here

This Gold Trade is Sick!

In today’s video update, I show a gold futures trade that is absolutely sick… in the best sense possible. The Hawkeye V-Swarm system identified the setup, entry and exit with almost $3000 potential profits in less than an hour.

Using a 3min chart of the GC (Feb 2020), I was watching for 6min, 12min and 60min alignment and confirmation for a trade entry. The 60min chart showed the highest probability would be a short.

Once above-average selling volume started to show on the 3min chart, the breakout began. The trade was confirmed with a “double-dot” roadkill signal. This showed alignment of the longer timeframe volume and momentum.

Within 45mins, the exit volume signal fired off, and the trade ended with 5.6 gold points. 1 gold point equals $100, so that was $560 per contract traded. With 5 contracts, that equates to $2800 in 45mins. That’s just sick!

Learn this and other strategies in our upcoming live online seminar, Project V-Swarm Live 2020. Early bird registration prices end on Jan 8th, so hurry and claim your seat today before the prices go up. Here is the link for more information.

Learn to trade the Hawkeye way.

Click Here for the Free Book (The Lost Art of Volume Price Analysis)

Or for a Trial of the Hawkeye Trading Software

Join Randy in the next free LIVE Hawkeye Demonstration Room held every Wednesday at 9.30am EST US. You will learn more about volume and volume price analysis and see more examples and live trade setups. It is open to all.

Click this link for more information or to join us in class.

Would You Like to Make $614/hr?

In today’s update, I show how the Hawkeye V-Swarm system identified a $614/hr trade setup. Would you like to make $614/hr? Watch today’s video and see how it’s done.

Chart Analysis

On the 3-minute ES (e-mini S&P) futures contract, the Hawkeye V-Swarm system identified a “triple-dot” long setup just after the market open today. A “triple-dot” signal is a term we use to show when the slower timeframe trend and volume align with the faster timeframe trend and volume. These are know as “roadkill” signals, and are extremely powerful entry signals.

Usually, we see “double-dot” signals, which are strong signals. But a “triple-dot” signal following ultra-high volume is powerful! It is a beautiful sign of volume and price working together to show high probability, low risk trade entries.

Our system rules are based on following the volume. So by following our simple rules, the trade identified a 3:1, 5:1, and 7:1 reward:risk ratio trade. The trade lasted 6.25 hours and yielded $3,837… or $614/hour. Wow, how would you like to make $614/hr?

The Hawkeye Perspective

Learn to trade the Hawkeye way. I invite you to join me for 2 full days of training, where I’ll show you how. This live training event is something you don’t want to miss. It’s called Project V-Swarm Live and I would love to meet you there. Reserve your seat now before prices increase on Jan 8th.

Learn to trade the Hawkeye way.

Click Here for the Free Book (The Lost Art of Volume Price Analysis)

Or for a Trial of the Hawkeye Trading Software

Join Randy in the next free LIVE Hawkeye Demonstration Room held every Wednesday at 9.30am EST US. You will learn more about volume and volume price analysis and see more examples and live trade setups. It is open to all.

Click this link for more information or to join us in class.

Gold and Oil Prices Surge on News of Iranian Airstrikes

Gold and oil prices surge on news of Iranian airstrikes. With gold pushing up close to 6-year highs, and oil hitting close to 2-year highs, there are plenty of opportunities to profit from in these markets. In today’s video, I’ll show you how.

Gold Breakout

On the daily charts, gold has broken out over 20 points, hitting over $1550 in overnight trading. I show on the intraday charts how this move could have been trading using Hawkeye software and strategies.

Crude oil also broke out over $64, and is showing bullish signs of a continuation to the $75 area. Again, Hawkeye software and strategies could have show exactly how to capture this huge surge in oil prices.

How do we know when markets are about to break? I’ll show you everything in our upcoming live training event you don’t want to miss. It’s called Project V-Swarm Live and I would love to meet you there.

Learn to trade the Hawkeye way. Gold and oil prices surge.

Click Here for the Free Book (The Lost Art of Volume Price Analysis)

Or for a Trial of the Hawkeye Trading Software

Join Randy in the next free LIVE Hawkeye Demonstration Room held every Wednesday at 9.30am EST US. You will learn more about volume and volume price analysis and see more examples and live trade setups. It is open to all.

Click this link for more information or to join us in class.

Learn to trade the Hawkeye way.

Quick $520 Trade Recap

In today’s video, I show a quick $520 trade recap in the NQ. I show how I entered and exited using volume. Plus I introduce 4 new volume indicators that can help build confidence to take the trade.

The trade lasted just shy of two hours, so $520 was great. That was using our standard rule-based entry. However I show four new indicators that would help build confidence in the trade. They are the Hawkeye Cumulative, Hawkeye Viper, Hawkeye PowerCycle, and Hawkeye PowerTrend.

All four of these new volume-based indicators will be free to everyone who attends the Online Project V-Swarm Live event Feb 6-7. CLICK HERE To learn more, or to register your seat.

Learn to trade the Hawkeye way. Quick $520 trade recap.

Click Here for the Free Book (The Lost Art of Volume Price Analysis)

Or for a Trial of the Hawkeye Trading Software

Join Randy in the next free LIVE Hawkeye Demonstration Room held every Wednesday at 9.30am EST US. You will learn more about volume and volume price analysis and see more examples and live trade setups. It is open to all.

Click this link for more information or to join us in class.

Learn to trade the Hawkeye way.

All I can say is “Wow”

Wow. All I can say is Wow. The markets continue to make all-time highs, even on low volume. Of course, low volume suggests that the smart money has taken a break and gone on vacation. But that doesn’t keep us from profiting from the very nice “Santa Claus Rally”. In today’s update, I rifle through the major markets showing why.

From the Charts

All the major stock indices have posted new highs this week. The S&P, Dow, Nasdaq, and Russell. Staying with the trend and trading your rules have show good fruit I hope. I know the rules I have shared with you are really making a difference, so I hope you are learning with me. All I can say is wow.

One last note is on Gold. I pointed out several weeks ago that gold was starting to glitter again HERE. For the past two days, gold has broken out of consolidation to the upside, and all the signs of a rally are in play. Intraday traders have done well trading to the long side.

The Hawkeye Perspective

How do we know when markets are about to break? I’ll show you everything in our upcoming live training event you don’t want to miss. It’s called Project V-Swarm Live and I would love to meet you there. Here is a link for more information about the event.

Learn to trade the Hawkeye way.

Click Here for the Free Book (The Lost Art of Volume Price Analysis)

Or for a Trial of the Hawkeye Trading Software

Join Randy in the next free LIVE Hawkeye Demonstration Room held every Wednesday at 9.30am EST US. You will learn more about volume and volume price analysis and see more examples and live trade setups. It is open to all.

Click this link for more information or to join us in class.

Learn to trade the Hawkeye way.

Quick $300 Crude Oil Trade

Today, I show a quick $300 crude oil trade. The setup was clean and the trade did take longer than expected. I didn’t hit my profit targets, but trade management kept me profitable.

As shown in the video, my entry was based on a solid base of buying volume (green bottoms) coming up to my Hawkeye Roadkill entry signal. Since volume was lower than normal due to Christmas week, I quickly moved my stop to breakeven.

As the trade progressed, I saw that locking in at least a 1:1 reward:risk level was prudent. So I ended the short trade with 6 ticks ($300 on 5 contracts). $300 in one hour is not a bad wage. So come to class, and learn to trade the Hawkeye way. This quick $300 crude oil trade was just an example of the potential.

Click Here for the Free Book (The Lost Art of Volume Price Analysis)

Or for a Trial of the Hawkeye Trading Software

Join Randy in the next free LIVE Hawkeye Demonstration Room held every Wednesday at 9.30am EST US. You will learn more about volume and volume price analysis and see more examples and live trade setups. It is open to all.

Click this link for more information or to join us in class.

Learn to trade the Hawkeye way.

I Love to Trade Crude Oil

I love to trade crude oil. And in today’s video, I’ll show you why. When you have a swarm of buyers coming in 15 minutes before your trade, it’s a compelling story to take the trade. Hawkeye tools lead the way.

I love to trade crude oil on the 3 minute chart. I show the entry just after a consolidation period and confirmed breakout, with strong volume support on multiple timeframes. This gives confidence to take the trade.

With 22 ticks of risk, I show a 3:1 reward:risk ratio and a 68 tick profit in 1 hour. I called the entry in our Inner Circle Skype Chat room at 09:04am. The trade entry signaled at 09:06am, with an exit at 10:03am. $680/contract traded. Simply following the rules. Learn to trade the Hawkeye way.

You too can learn to trade the Hawkeye way by getting your own copy of our tools during our 40% Off Black Friday sales going on right now in our Store.

Click Here for the Free Book (The Lost Art of Volume Price Analysis)

Or for a Trial of the Hawkeye Trading Software

Join Randy in the next free LIVE Hawkeye Demonstration Room held every Wednesday at 9.30am EST US. You will learn more about volume and volume price analysis and see more examples and live trade setups. It is open to all.

Click this link for more information or to join us in class.

Learn to trade the Hawkeye way.

Volatility is on the Move

Volatility is on the move. In today’s update, I want to show my expectations of where price should go, and why. When volatility spikes, markets tank. We have had extreme lows in volatility, and a short term correction was inevitable. But what else is in store?

Downward pressure

From the daily ES chart (S&P 500 e-mini), we see increasing volume and decreasing prices. Price has reached the weekly upper trendline, as shown in yesterday’s update. This should act as short-term support, as we see active demand in this area.

Also, we expect price to possibly retrace back up to the 3121 area, before continuing it’s route back down to 3031ish. This theory is supported by the upper trendline on the CBOE Volatility index ($VIX.X). Applying Hawkeye indicators to volatility has proven to be very enlightening.

The Hawkeye Perspective

With a phantom isolated high in place, we expect to see 3-5 daily price bars of correction. We also expect to see 2958 area hit IF our lower demand zone of 3020 is broken.

These charts help us to see and trade the faster intraday charts. I teach this and other strategies in our weekly training room. Please join us. Learn to trade the Hawkeye way.

You too can learn to trade the Hawkeye way by getting your own copy of our tools during our 40% Off Black Friday sales going on right now in our Store.

Click Here for the Free Book (The Lost Art of Volume Price Analysis)

Or for a Trial of the Hawkeye Trading Software

Join Randy in the next free LIVE Hawkeye Demonstration Room held every Wednesday at 9.30am EST US. You will learn more about volume and volume price analysis and see more examples and live trade setups. It is open to all.

Click this link for more information or to join us in class.

Learn to trade the Hawkeye way.

Gold is Starting To Glitter Again

Gold is back on my radar again, and is starting to glitter again. Today, after a long bearish trend, we saw a glimmer of bullish hope. I show you my analysis in today’s video.

The daily GLD (gold ETF) today showed a very nice bullish reversal bar. Technically, it isn’t very strong, but historically, it has proven to produce up to 4 points of correction.

In addition, the $HUI (Gold Bugs Index), which is well known as a leading gold indicator, also signaled a bullish reversal. And the GDX, gold miners ETF, like their brothers, signaled a bullish reversal bar on the daily charts.

While these might not be full blown key reversals, they do shine a bullish light on well beaten down gold market.

Gold is starting to glimmer again, and I expect to see at least 40 points of correction, and at least 3 -5 days of bullishness. Learn to trade the Hawkeye way.

Learn to trade the Hawkeye way.

Click Here for the Free Book (The Lost Art of Volume Price Analysis)

Or for a Trial of the Hawkeye Trading Software

Join Randy in the next free LIVE Hawkeye Demonstration Room held every Wednesday at 9.30am EST US. You will learn more about volume and volume price analysis and see more examples and live trade setups. It is open to all.

Click this link for more information or to join us in class.

Learn to trade the Hawkeye way.


Update: As of 11/18/2019, Gold has risen 20 points, and is continuing to show signs of bullishness. I previously posted “4” point potential profits, but it was a typo and should have read “40” point potential profits are expected.

A Very Crude Conversation

Today, I want to have a very crude conversation with you. Uh, crude oil that is! Crude oil inventories are out today and I want to let you know the Hawkeye perspective. Here is my video update for today:

The Hawkeye Perspective

Crude oil is continuing to fall in price in recent history. Ever since the Saudi oil field attacks, the price of crude oil has steadily dropped over $10/barrel. However, I see support has formed and I am getting indications that we might see price rising on the longer term picture.

The weekly and monthly charts show a consolidation wedge formation, with crude oil prices at the bottom of the wedge. If it holds, I expect to see price “bounce” off the lower channel back up to the middle, around the $55-$56 range. The most interesting indication is the Hawkeye Fatboy. It is showing that crude is extremely oversold and starting to build strength.

On the hourly chart, I see a change of character in buying pressure (volume). The London session was very bullish for crude oil. With inventories out today, and the expectation is for a reduction in stockpiles, I look for continued bullishness in price. The Hawkeye Zones puts the price targets at $53.80 and $54.30 to the upside. Downside targets would be back to $52.50.

Yes, it was a very crude conversation, but I trust it was informative. I hope to see you in my training room today. Learn to trade the Hawkeye way.

Click Here for the Free Book (The Lost Art of Volume Price Analysis)

Or for a Trial of the Hawkeye Trading Software

Join Randy in the next free LIVE Hawkeye Demonstration Room held every Wednesday at 9.30am EST US. You will learn more about volume and volume price analysis and see more examples and live trade setups. It is open to all.

Click this link for more information or to join us in class.

Learn to trade the Hawkeye way.

Crude Oil is in the News Again.

Crude oil is in the news again, with Saudi Arabia agreeing to a partial cease-fire with Yemen. Crude oil ($CL_F) responded with a 1% drop in prices. How do you view and trade this opportunity? I discuss this in today’s video update.

Using technical analysis, it’s easy to see the manipulation of price in the markets. Prior to the report, Hawkeye volume identified clear buying pressure during the London open. The intent was to bring price back to a region that is attractive to sellers, namely overhead supply. And that’s exactly what happend, as price rallied back to yesterday’s close.

Then it’s very easy to see the selling pressure put at that level. Hawkeye Volume and Hawkeye Zones working together to show the true market intent, over 2 hours in advance.

Supply regions are graphically shown using the Hawkeye Zones. I like to use it on a 60min chart, which I think acts like a “price magnet”.

Once you get a market event that produces a long-range bar (Hawkeye Widebar), we know exactly how to trade the resulting trend. Learn to trade the Hawkeye way.

Click Here for the Free Book (The Lost Art of Volume Price Analysis)

Or for a Free Trial of the Hawkeye Trading Software

Join Randy in the next free LIVE Hawkeye Demonstration Room held every Wednesday at 9.30am EST US. You will learn more about volume and volume price analysis and see more examples and live trade setups. It is open to all.

Click this link for more information or to join us in class.

Learn to trade the Hawkeye way.

Where can crude oil prices go?

With the Saudi drone strikes behind us, where can crude oil prices go next? And what other markets could the spike in oil prices influence? I delve into these and other questions in today’s Hawkeye update.

Crude oil has spiked up to the first resistance zone around $63-$64, which has contained the initial reaction to the weekend news event. Both Saudi and US officials said they will open strategic oil reserves to fill the supply gap, hoping to curb the rising price of oil. Saudi officials report that the production should be back online within 48 hours.

So the potential for oil to continue to rise, in my opinion, is good. I show two previous highs that mark potential targets for higher oil prices: $67 from the April 2019 high, and $78 from the October 2018 high.

Other implications can be found in the Defense and Energy sector ETFs. The ones I noted are $XAR (SPDR S&P Aerospace & Defense) and $XLE (SPDR S&P Select Energy). I also see intraday potential in leveraged ETFs, like OILU (ProShs UltraPro 3x Crude Oil) and OILD (ProShs UltraPro 3x Shrt Crude).

Click Here for the Free Book (The Lost Art of Volume Price Analysis)

Or for a Free Trial of the Hawkeye Trading Software

Join Randy in the next free LIVE Hawkeye Demonstration Room held every Wednesday at 9.30am EST US. You will learn more about volume and volume price analysis and see more examples and live trade setups. It is open to all.

Click this link for more information or to join us in class.

Learn to trade the Hawkeye way.

Saudi Attack Brings Uncertainty in Crude Prices

The recent attack on the Saudi oil production facilities in Abqaiq and Khurais caused the price of Crude Oil (@CL) to spike. Rising up to 18%, CL prices have broken out of daily consolidation, into overhead supply. This Saudi attack brings uncertainty in crude prices, and I share my analysis in today’s update.

While the daily price has broken our consolidation range, the weekly price has also broken it’s consolidation triangle. This was the bullish move we expected from CL, but definitely not the reason behind it.

It’s difficult to trade when global economic events occur, causing volatility to spike and prices to rise. But with the right training in risk management, you minimize any risk potential and are always ready for unintended consequences.

The potential consequences to this sudden move in oil will be noticeable. Look for oil exporting nations to benefit (CAD) and for oil importing nations to suffer (EUR). Risk-off currencies like USD and JPY will benefit while AUD and NZD would suffer.

Bottom line, the price of Crude will probably stay higher, and continue to increase if the break of supply isn’t fixed soon. This Saudi attack brings uncertainty in crude prices, that’s for sure. But if you know how to manage risk, you know how to trade. Learn to trade the Hawkeye way.

Click Here for the Free Book (The Lost Art of Volume Price Analysis)

Or for a Free Trial of the Hawkeye Trading Software

Join Randy in the next free LIVE Hawkeye Demonstration Room held every Wednesday at 9.30am EST US. You will learn more about volume and volume price analysis and see more examples and live trade setups. It is open to all.

Click this link for more information or to join us in class.

Learn to trade the Hawkeye way.

Crude Oil is Getting Ready for a Big Move

I’ve been watching crude oil for a while now. Today I see signs that crude oil is getting ready for a big move, and I wanted to point it out to you.

On a daily chart, crude oil has been in consolidation for a while. Shown by a series of descending highs and ascending lows, its forming a nice pennant flag. The energy is building as the price “coils up” inside the flag region, setting the stage for the next big move.

The Hawkeye Perspective
According to the 6 Ways teaching we give our students, I identified a bullish break of consolidation. While this technically is called a trend run, crude price still needs to break the Hawkeye stops in order for us to confirm the up trend.

Finally, volume has to be present to support the move. Right now, we see above average buying volume on the daily, and declining selling volume on the weekly. This weekly selling pressure is not producing lower lows in price, which actually is a bullish sign.

Based on this and our Zones indicator, we expect to see a potential move of crude oil back up to 60, 63 or even 74 in time. Learn to trade the Hawkeye way.

Click Here for the Free Book (The Lost Art of Volume Price Analysis)

Or for a Free Trial of the Hawkeye Trading Software

Join Randy in the next free LIVE Hawkeye Demonstration Room held every Wednesday at 9.30am EST US. You will learn more about volume and volume price analysis and see more examples and live trade setups. It is open to all.

Click this link for more information or to join us in class.

Learn to trade the Hawkeye way.

Killer Crude Oil Setup

Today I want to show you a killer crude oil setup that occurred live. Using supply and demand as targets, Hawkeye knows when to look for trades, and which direction to trade them.

In today’s video, I show the setup and trade results possible to anyone using these killer indicators.

You see, Hawkeye is designed with traders in mind. The Hawkeye Zones show active supply and demand zones and they draw automatically on any chart. Hawkeye Widebar gives us rules to trade by that help to keep us safe. Our Hawkeye Trend and Volume show us the direction of the trade and when to enter. Finally the Hawkeye Levels ATR shows us the risk we take, and the profit targets where we exit.

Hawkeye is a complete packge that helps to keep you safe in volatile markets. As a result, you can learn to trade with confidence and precision, regardless of the market you trade – futures, stocks, Forex, cryptos, options, or commodities. Learn today to trade the Hawkeye way.

Click Here for the Free Book (The Lost Art of Volume Price Analysis)

Or for a Free Trial of the Hawkeye Trading Software

Join Randy in the next free LIVE Hawkeye Demonstration Room held every Wednesday at 9.30am EST US. You will learn more about volume and volume price analysis and see more examples and live trade setups. It is open to all.

Click this link for more information or to join us in class.

Learn to trade the Hawkeye way.

Gold is on Fire – Hawkeye is Still Bullish on Gold

Gold is on Fire

Gold is on fire! Hawkeye identified a bullish trend in Gold (GC) on June 3rd, 2019. If taken, the trade is worth $21,270/contract today. Using the Hawkeye Profit Accelerator, that same trade would have built up to $148,890 as of today. Since the bullish trend is still in tact, we expect to see more in the future.

Obviously, the chart shown is a daily chart. So the margin and account size needed would not be suitable to a beginning trader. But consider the opportunities that each day provides to those who know what to look for. So look for these same type of setups and trades, which will occur on an intraday basis, and trade them the same way.

Personally, I prefer to use the 3 minute, 6 minute, and 12 minute charts for intraday trend trading. Look for opportunities within the bigger trends.

The idea is this: identify the trend, stick with the trend, and build your position on strength. We have a suite of indicators that help you do just that. Yes, gold is on fire. Learn to trade gold the Hawkeye way.

Click Here for the Free Book (The Lost Art of Volume Price Analysis)

Or for a Free Trial of the Hawkeye Trading Software

Join Randy in the next free LIVE Hawkeye Demonstration Room held every Wednesday at 9.30am EST US. You will learn more about volume and volume price analysis and see more examples and live trade setups. It is open to all.

Click this link for more information or to join us in class.

Learn to trade the Hawkeye way.

There’s Always a Bull Market Somewhere – Profit on Gold and Bonds.

Bull Market Somewhere

While the S&P and Dow make serious corrections, the Bond and Gold markets are ripping higher as traders seek a safety net. See Randy’s breakdown and analysis in today’s market update. There’s always a bull market somewhere.

While the Dow, S&P, and Nasdaq are all in correction mode, it makes trading much more difficult. It’s nice to know that there is always a bull market somewhere else. We found that in the precious metals and gold market. I expect to see @ES prices back to at least the 2900 level, but gold (@GC) should break back through the key 1500 level, and the 30 year bond (@US) should get to 164.

The @US is making a double-top so I expect it to pause, forming a pivot high. I will be looking for a 3-5 bar correction once this occurs.

Click Here for the Free Book (The Lost Art of Volume Price Analysis)

Or for a Free Trial of the Hawkeye Trading Software

Join Randy in the next free LIVE Hawkeye Demonstration Room held every Wednesday at 9.30am EST US. You will learn more about volume and volume price analysis and see more examples and live trade setups. It is open to all.

Click this link for more information or to join us in class.

Learn to trade the Hawkeye way.

Re-enter an Existing Trend the Hawkeye Way

In today’s article, let’s take a look at how to trade Forex based on Hawkeye volume-based trading principles. And in particular, let’s consider the case where we missed the initial entry and are looking to re-enter an existing trend a little later.

Re-Enter an Existing Trend

In Forex, we always begin with the Hawkeye Fatman indicator. It shows which currencies are relatively strong or weak with respect to all the other currencies. Below is a chart of today’s Fatman showing that the EUR is weak and the USD is strong. Based on this setup, we know that strength cycles constantly, and usually returns to fair value or to the opposite extreme. So in our charts, we look for a probable reversal of trend direction to start our trade.

Fatman chart

So the Fatman started to show a reversal setup around 0600, and we saw that the initial trade entry on our charts came around 0630, meaning we missed that initial entry! Bummer! What do we do?

Good question!

In our Hawkeye training room, we teach students to study VOLUME, and that is where we find our answer.

Volume is the Key

On the EURUSD chart below, we see the initial entry we missed, marked by the first green up-arrow. Since we missed the initial entry, all we need to do is wait for the pull back on the volume, which signifies buying weakness. When buying strength returns, the trend continues and signals our re-entry.

EUR 5min Chart

As you can see, there are several more opportunities to get into this trend if you missed any of the other previous entries.

The Hawkeye Perspective

As an advanced tip, use the Hawkeye Roadkill indicator. It identifies EVERY volume pull back on a trend, compares it to the longer time volume and signals the best time to enter or re-enter the existing trend. It is a fabulous tool that I would not trade without. But I wanted to make sure you knew how to spot a valid re-entry by just using volume.

I teach this and many other principles in our weekly Wednesday training room. So please come along and join the action.


Join me in the next free LIVE Hawkeye Demonstration Room held every Wednesday at 9.30am EST US. You will learn more about volume and volume price analysis and see more examples and live trade setups. It is open to all.  Click this link for more information or to join us in class.

Learn to trade the Hawkeye way.

Randy Lindsey
Hawkeye Traders, LLC

Gold At A Crucial Point Now

Last week we saw monthly Gold (GC) hitting a critical monthly trendline, as shown by the chart below. This trendline in Gold has been in place since 2011.

Historically, whenever Gold hits this trendline and fails to break it, the downtrend continues.

GC Monthly Chart

If we couple that with the US Dollar index (DX), the DX monthly chart below shows the current trend of weakness in the US Dollar.

However, we see this trend hitting support, with declining volume. If the DX were to continue lower, we need to see volume advancing, not declining.

DX Monthly Chart

Also, the Hawkeye Fatboy chart below shows that daily Gold is overbought and should start to lose strength, as it cycles back to fair value. This will be accelerated if the US Dollar starts to strengthen, and then Gold will begin to resume its longterm downtrend.

Hawkeye Fatboy

Looking at the daily Gold chart below, notice the volume weakness already beginning. Therefore, watch the daily GC chart for the current uptrend to be broken, with confirming selling volume.

GC Daily Chart

Hawkeye Perspective: Gold is at a critical point now, so watch for the daily Volume on Gold to see if strength or weakness will prevail during this time.

Remember, green buying volume shows strength, and red selling volume shows weakness. If the US Dollar starts to strengthen, this will accelerate the potential for a down move in Gold.


Join me in the next free LIVE Hawkeye Demonstration Room held every Wednesday at 9.30am EST US. You will learn more about volume and volume price analysis and see more examples and live trade setups. It is open to all.

Click this link for more information or to join us in class.

Learn to trade the Hawkeye way.

Randy Lindsey
Hawkeye Traders, LLC

A Rookie’s Mistake

Here is a common mistake that rookies make.

Gold Daily Chart

This is the daily gold chart, but it applies to all markets and all time frames.

A Rookie’s Mistake

Here is the mistake.

A Hawkeye Pivot is formed at the yellow arrow. Most rookie traders will draw a line off the high (the blue line).

WRONG.

You need to draw a line off the low of the bar as well (the yellow line). If it was just off the high of the bar then it was only touched twice.

BUT off the low it was hit eight times. So now you understand that this is a major resistance area.

BY DOING THIS YOU HAVE INCREASED HOW YOU PERCEIVE THIS AREA BY A FACTOR OF FOUR.

We demonstrate this and many other methods in our live demonstration room held every Wednesday, and this is open to everyone. Click this link for more information or to join us in class.

Good Fortune,

Nigel Hawkes
Hawkeye Traders

[The magenta and yellow arrows are for illustration only and do not form part of the software]

Where The Money Is.

One of the main questions I am asked is – what market shall I trade?

My answer is – any one where there is a feeding frenzy.

At the moment this is the British pound, the grain and agriculture complex, gold, oil, and to specialise in one market intra-day I recommend the US bonds.

And most important of all is the timeframe. PLEASE do try and trade the longer timeframes, that’s where the money is.

So let’s have a look.

Hawkeye FX GBP
FXGBP Daily Charts

Here is the new colour coded Hawkeye Tomahawke chart of all the GBP crosses.

See the many opportunities to trade on big news with Brexit. But this can also be replicated with the Euro.

Soy Beans and Hogs
Soy Beans

Live Hogs

Examples of the grain and agriculture markets. As you can see these markets are in defined trends.

US Bonds
I love this market. Why? Because you get long, defined trend runs.

US Bonds Weekly Charts 
Bonds Weekly

Just look at the weekly uptrend since the beginning of 2016, making sure you only take long trades on the daily chart.

Now, if you go to your intra-day charts you know only to look at long trades where there is lower risk.

US Bonds Daily Charts
US Bonds Daily Chart

By reading the chart the Hawkeye way, using volume and price, you can clearly see a recent double top. Two yellow dots (indicated by the magenta arrows) at the last market high, then retracing to the Hawkeye stop at the green crosses (indicated by the cyan arrow).

You know you are in congestion and pull back in the weekly trend. So, only longs to be considered till the weekly changes to a down trend.

We demonstrate this and many other methods in our live demonstration room held every Wednesday, and this is open to everyone. Click this link for more information or to join us in class.

Good Fortune,

Nigel Hawkes
Hawkeye Traders

[The magenta and cyan arrows are for illustration only and do not form part of the software]

Gold Mining Shares ETF Give Big Bangs for the Bucks.

Last week gold went up 2% but the gold miners’ index, ETF GDX, rose 11%.

But be careful. We are highly overbought on gold and gold miners’ stocks GDX and should expect a pull back soon within the overall uptrend. In fact, a recent report from Morgan Stanley Australia, states that miners are now extremely overvalued. Example: Newcrest Mining (NCM.Australia) trading at $21.76 Australian Dollars, compared to fair value of $A12.90. That’s 68% overvalued.

Gold 133 Minute Chart (GLDV Golds ETF)
Gold Chart
The 133-minute chart (a third of a day that the ETF trades) shows a classic volume upthrust, followed by 2 bars of no demand volume indicating a probable pullback.
 
GDX 133 Minute Chart
GDX 06-13-16
The ETF of the gold miners is clearer. Again a volume upthrust, but look at the Trend dots. They are going flat, indicating this move is now in congestion entry, so expect a pullback in the overall uptrend.

[feature_box style=”26″ only_advanced=”There%20are%20no%20title%20options%20for%20the%20choosen%20style” alignment=”center”]

Definition of an Upthrust
An Upthrust Bar is a wide range bar, with a high volume and closing down. It indicates that the prices were marked up during the day, trading activity was high as indicated by the high volume, and the prices dropped to near the low (or to the low) towards the closing hours.

[/feature_box]

We demonstrate this and many other methods in our live demonstration room held every Wednesday, and this is open to everyone. Click this link for more information or to join us in class.

Good Fortune,

Nigel Hawkes
Hawkeye Traders

[The magenta arrows are for illustration only and do not form part of the software]

Here We Go. Nearly There on Gold.

We are nearly there on Gold. Friday saw a big move, and as I have been banging on about for some months, there will be great opportunities this year.

So let us look at GDX, the gold miners ETF, which is a leading indicator for the gold price.

Daily Charts GDX
Daily GDX
As you can clearly see (indicated by the cyan arrow), ultra high volume resulting in the daily price commencing a new uptrend.

My favorite stock for gold is Newmont Mining (NEM). So let’s take a look at some charts.

Newmont Mining Weekly
Newmont Weekly Chart

Look at the last Hawkeye Pivot low (yellow dot). This is pushing price up on buying volume. So the last Pivot highs (shown with the yellow dotted line) are being tested.

Newmont Mining Daily
Newmont Daily Chart
Interestingly the high volume bar (with the yellow dot) occurred in price congestion, followed by declining volume, indicating accumulation (see my free volume book here for further information), resulting in the price commencing a trend run. But it has still to break the Pivot highs to the left (indicated by the yellow dotted line). When it does, with no part of the price bar straddling the dotted line, then we know we are in a strong uptrend.

Hawkeye Perspective
Nearly there! Be patient, this coming week will tell all.

We demonstrate this and many other methods in our live demonstration room held every Wednesday, and this is open to everyone. Click this link for more information or to join us in class.

Good Fortune,

Nigel Hawkes
Hawkeye Traders

[The cyan and magenta arrows are for illustration only and do not form part of the software]

Learn This Trick: It Will Make Money

As you know I have been bullish on gold since mid-December and closed out my long positions last week and am waiting for a pullback and a re-entry.

What made me want to close my position?

I’m showing you two charts and this technique can work on any multiple timeframes that you might be trading.

Monthly Gold Chart
Gold Monthly Chart
You can see at the end of February the Hawkeye Volume turned green, Heatmap dark red and there was also a Hawkeye Pivot two bars previously, indicating that we will have 3,5,7 bar reaction from this point.

The price goes up as expected and has reversed off the Hawkeye stops, which on the slower time frame always acts as resistance

Daily Gold Chart

Gold Daily Chart
The magenta arrow shows the red Volume has entered the market. This coincided with exactly the same point on the daily chart as the monthly chart when the price stalled at the monthly Hawkeye stops.

I have placed a dotted yellow line and also a down magenta arrow where this took place.

Hawkeye Perspective
Strategy for the upcoming week – I now want to see the daily finding support at the daily stop level and reverse to the upside in harmony with the weekly and the 133-minute chart.

And when the monthly stops are broken this market will truly be on its way.

You can use this method on any instrument you might be trading and any multiple time frame.

I will be teaching this at the upcoming April online webinar and encourage you all to come and register to really learn how to drive the Hawkeye engine. As long as you register you will receive the recorded webinar so you don’t have to be actually present to benefit from this education.

Hawkeye Traders Annual Online Conference

We demonstrate this and many other methods in our live demonstration room held every Wednesday, and this is open to everyone. Click this link for more information or to join us in class.

Good Fortune,

Nigel Hawkes
Hawkeye Traders

[The magenta arrows are for illustration only and do not form part of the software]

Great Forex Opportunity and the Hawkeye View on Crude

Forex GBP
There is fundamental news over the next week on the GBP as the UK tries to negotiate a better package with its membership of Europe, which will result in an in/out referendum.

The markets don’t like uncertainty so there will be many fabulous opportunities to trade the GBP FX Pairs.

GBP Pairs Daily Charts
FX Pairs Daily Chart 1
FX Pairs Daily Chart 2

All are exhibiting a downtrend and the magenta arrow on the daily Fatman shows there is still some way to go.

All are at critical support levels and this coming week will show if this support holds.

GBP Pairs Weekly Charts
FX Pairs Weekly Chart 1
FX Pairs Weekly Chart 2
All Pairs except the GBPCAD are in downtrend with little support below.

The cyan arrow on the Fatman shows oversold. But with the daily Fatman still in downtrend the weekly could stay down here for some time.

How To Trade
Go and look at the lower time frames i.e. 30 minutes, and only take shorts.

Crude Daily Chart
Crude Daily Chart

Regardless of production cuts, or what is said at the next OPEC meeting, crude oil is still in a strong downtrend.

You can see whatever positive news props the market up for a day or two is quickly met with sellers.

The market has not had more than three positive days in a row in well over a year.

Rallies should be viewed as selling opportunities.

Hawkeye Perspective
When a market has been in a downtrend for this long it is not going to turn around quickly.

It is going to take much more than one country cutting production to put a bottom in crude.

We demonstrate this and many other methods in our live demonstration room held every Wednesday, and this is open to everyone. Click this link for more information or to join us in class.

Good Fortune,

Nigel Hawkes
Hawkeye Traders

[The cyan and magenta arrows are for illustration only and do not form part of the software]

Market Update. Not Too Late For Gold?

SPY
Yesterday buyers stepped in as the second half of the trading day developed.
SPY Charts 02-15-16
This can be interpreted in two ways.

First, as profit-taking ahead of the long weekend, which is normal.

Second, that the market tried twice to break lower and failed.  As far as technical analysis goes, 80% of breakouts fail at the first attempt.

So next week will confirm if this is indeed the start of a bounce.

Gold
For those who follow my Newsletter, you know that prior to Christmas, I went bullish on Gold and chose NEM Newmont Mining as my preferred stock to trade this move.

Lets look at the charts.

Gold Charts 02-15-16

A low-risk entry at the end of 2015 when the 133-minute chart clicked into the upside. I was stopped out on February 25, but will reenter if last week’s high is taken out by a close.

Hawkeye Perspective
After such a strong move lower, the odds of some sideways trading action is very high.

Markets don’t just fall off the chart; they run, then consolidate, then run again.

I believe we are in the beginning of a consolidation period.

We demonstrate this and many other methods in our live demonstration room held every Wednesday, and this is open to everyone. Click this link for more information or to join us in class.

Good Fortune,

Nigel Hawkes
Hawkeye Traders

The Bottom in Precious Metals is In!

The precious metals market has been in a solid downtrend for quite some time. However, Hawkeye knows, using Volume Spread Analysis, that accumulation is showing in these markets. And by the reaction of price to this accumulation, this could be the opportunity of 2016! Let’s look at the charts…

NEM Daily
NEM Daily

One of the world’s largest miners, NEM, has shown nothing but accumulation. Look at the Cyan arrows I have placed on the chart, all showing higher bottoms and the rising volume… again showing accumulation. Then BANG… on Friday, Hawkeye shows a wide-bar up with confirming very high Volume Radar.

GDX Daily
GDX Daily

The Gold Miner’s Index, GDX (with a basket of major miners), is also showing accumulation. Again I have placed Cyan arrows on the chart showing higher Hawkeye Pivot lows, and again on the Hawkeye Volume, showing strong breakout volume on Friday.

Gold Futures Contract Daily
GC Daily

While this Gold futures chart is not quite as clear, you can still see 2 days of buying volume and a Hawkeye Pivot low on the price, all shown by the Cyan arrows I placed on the chart. Compare with the Gold ETF – GLD.

Hawkeye Perspective
Like Gold, Silver and Platinum charts show the same profile. However, there is overhead resistance on the weekly charts to break through. So Gold will probably zig-zag in price, accumulating more volume in the process, in order to continue it’s advance through this resistance.

I am excited about the prospect next year for precious metals. That’s why I will hold a Special Webinar just on this topic in January 2016. I will send an email out with registration details soon.

We demonstrate this and many other methods in our live demonstration room held every Wednesday, and this is open to everyone. Click this link for more information or to join us in class.

Good Fortune,

Nigel Hawkes
Hawkeye Traders

[The cyan arrows are for illustration only and do not form part of the software]

You Must Learn This Entry Technique

I always preach that you are trading risk rather than a market and the example below highlights just that.

EURUSD Chart Setup

Look at the slowest time frame (bottom left). The Heat Map on the bottom stayed red, both bright and dark, throughout the whole day, indicating the bias was to the downside.

The other two time frames, especially the faster (on the right hand side), gave buy signals. But they were not elected as the slow time frame indicated too much risk.

Hawkeye Perspective

Using triple time frame entries filters the potentially negative trades and ALWAYS  keeps you the right side of the market. 

We demonstrate this and many other methods in our live demonstration room held every Wednesday, and this is open to everyone. Click this link for more information or to join us in class.

Good Fortune,

Nigel Hawkes
Hawkeye Traders

[The red arrows are for illustration only and do not form part of the software]

Who Would Have Thought It?

The Crude market is showing weakness in all time frames. If you were using Hawkeye, your positions would be extremely profitable. So let’s go and do our volume analysis using our Hawkeye tools.

Crude Monthly Chart

Crude Monthly Chart
As you can see, price was rejected by the Hawkeye Zones, and where I have placed the magenta arrow shows Hawkeye Volume indicating selling for the last two months. Great signs of crude oil weakness are evident.

Crude Weekly Chart

Crude Weekly Chart
The magenta arrow shows selling last week. The trend is down, and the bottom of the Zone at 38.50 is the next area of resistance. Again, great signs of crude oil weakness.

Crude Daily Chart

Crude Daily Chart
The story unfolds. For the last seven days sell/no-demand Volume has been dominant, and where the magenta arrow is you can see the red Trend dot has broken out of congestion to the downside.

Hawkeye Perspective

All time frames are short. The weekly bottom of Zone at 38.50 must hold or the market will be in serious danger of free fall. These are all great signs of crude oil weakness.

We demonstrate this and many other methods in our live demonstration room held every Wednesday, and this is open to everyone. Click this link for more information or to join us in class.

Good Fortune,

Nigel Hawkes
Hawkeye Traders

[The magenta arrows are for illustration only and do not form part of the software]

Classic Commodity Setups and Apple Review

Three charts to look at this week.

Let’s start with America’s most widely held stock, Apple.

Apple Daily Chart

Looking at the daily chart, I have placed a blue line after Apple had a Wide Bar down (first blue arrow) then rallied back up.

There are now six Hawkeye Pivot lows, and the Trend is neutral, indicating congestion. But look at the Hawkeye Volume (last two blue arrows) – classic accumulation volume. So expect a test to 116 area, and if taken out, the commencement of an uptrend.

Now let’s take a look at Coffee.

Coffee

The Wall St Journal said this week that food prices have increased for the first time in 18 months, and the Brazilian Real is showing strength, which is good news for coffee and the charts are starting to support this.

Let’s look at the monthly chart first. It has a Pivot low coming in (indicated by the cyan arrow) if the price continues up. The weekly has phantom Pivot lows and green buying Volume (indicated by the cyan arrows), and the daily is in up Trend with good accumulation volume over the past two weeks

And finally Live Cattle.

Live Cattle

The monthly chart shows the price right down and found support at the Hawkeye stops (indicated by the cyan arrow). The weekly has a Hawkeye Pivot low and green buying Volume (indicated by the cyan arrow). The daily shows a great example of accumulation volume taking place after a considerable down trend (indicated by the cyan arrow).

Hawkeye Perspective
Be patient, a set up is imminent in all three markets.

We teach you how to get the best out of Hawkeye at our London Seminar on October 18/19 2015. You can find out more here

Now, all of this (and much more) is demonstrated in our FREE training room every Wednesday at 9am Eastern, by my colleague Randy Lindsey.

So, I cannot encourage you enough to come along to the Wednesday room.

Click Here To Reserve Your FREE Seat

Good fortune,

Nigel

Please contact us at [email protected] for any questions you might have about using Hawkeye Indicators in your trading!

[The blue, cyan and magenta arrows are included for illustration only and do not form part of the software]

Bottom Starting in Gold

Gold seems to be forming a bottom here, as you can see where I have placed the cyan arrow on the chart below. We now have weekly buying volume and that has pushed the price up to the Hawkeye Trend dot (illustrated by the magenta arrow) where it has found, as it usually does, resistance.

Gold Weekly Chart

However, the close was way above the open, and in the top 40% of the range of the bar which is bullish. BUT gold is still in monthly and weekly downtrend. However, this does look like the start of accumulation.

Gold Daily Chart

More clues here in the daily chart above, that accumulation has started. The cyan arrow shows several setups:

  1. Daily buying volume.
  2. Heatmap is bright green telling me that all 3 trends are to the upside.
  3. The large cyan dot on the Roadkill indicator, which I have set to 2 days. However, the 2-day Trend dots are still red.
  4. Trend on price in uptrend

Hawkeye Perspective

This is not a long yet, but a termination of the daily downtrend. The weekly is still in downtrend and the 2-day Roadkill trend is still red – so no trades.

But put gold on your radar. Accumulation is taking place. Be patient, a new uptrend will develop.

Now, all of this (and much more) is demonstrated in our FREE training room every Wednesday at 9am Eastern, by my colleague Randy Lindsey.

So, I cannot encourage you enough to come along to the Wednesday room.

Click Here To Reserve Your FREE Seat

Good fortune,

Nigel

Please contact us at [email protected] for any questions you might have about using Hawkeye Indicators in your trading!

[The cyan and magenta arrows are included for illustration only and do not form part of the software]

A Simple Way To Make Great Money Using Hawkeye

Gold mining stocks have been getting slammed lately, and the exchange-traded funds that track them are feeling the pain. So, this week, I’ll be talking about GDX (which is the Market Vectors Gold Minors ETF), and showing you how to make great money using Hawkeye Volume Based Indicators.

Let us begin by looking at the weekly chart. On the weekly GDX, you can see that we have had very high volume lately.

Gold Weekly Chart

In fact, notice the high volume bar that came in with a red dot on it. That’s the Hawkeye Volume Radar, which tells us that we’ve just had an ultra-high volume week. If you look prior to that, we had pretty low volumes going through, so we painted the Hawkeye Volume as a white bar.

The reason for this is both because of the price action and because we had a gap down (see the red arrow on the chart above). Now, if the close was a little bit higher, then the Hawkeye Volume would have turned green. But, it didn’t. It is showing you that there is no demand. In other words, the selling pressure has been taken off. Although it gapped down, it rallied back up during the week.

So, this coming week is going to be very interesting, because if we get a week that puts in a Hawkeye Pivot (an isolated low on the bar with the red arrow which we won’t know until the end of this coming week), we will expect a 3-5-7 bar reaction in an up move.

So again, be very careful. You can trade the up move which might be quite violent, but the overall bias is down. It could be just a bear bounce.

If we now go on and look at the daily you can see the story unfold a little bit further.

Gold Daily Chart

Again, if we look at the Hawkeye Volume bar on the GDX, it’s green with a red dot on it showing that it was ultra-high volume. That is confirming the no-demand of the weekly, and that we expect the bias to be up this coming week.

You can also see that, providing that the low of Friday is not taken out on Monday, we will also put in a pivot low which will also give us a 3-5-7 bar reaction in this up trend. So, we can quiet easily see it start moving up around to the trend dot value or higher.

And then, if we go over to the 240 minute, it all becomes a little bit clearer, because on the 240 minute you can see you had two opportunities in that down trend (where I placed the red arrows) to get into this trend down if you missed it.

Gold 240min Chart

But then, if you look right at the live edge of the market, we have two volume bars that are green, showing us that the volume has come in.

We have a wide ranging bar that’s come in, and everything is set up here to confirm the daily time frame.

So, it is leading the way to show that this should be pushed up next week.

So, keep an eye on it.

If you are trading the Forex, remember that you can trade XAUUSD.

So, we have a very interesting week coming up.

We could see quite an interesting rally coming up on the faster time frames taking this up to test itself before it will probably revert back into its downward trend.

Now, all of this (and much more) is demonstrated in our Wednesday room by my colleague Randy Lindsey.

So, I cannot encourage you enough to come along to the Wednesday room.

Click Here To Reserve Your Seat

Good fortune,

Nigel

Please contact us at [email protected] for any questions you might have about using Hawkeye Indicators in your trading!

[The red and cyan arrows are included for illustration only and do not form part of the software]

The Next 5 Minutes Could Change Your Trading Results Forever

There is no end to the debates among active traders about the pros and cons of swing trading vs. scalping. And the debate has been going on for years. However, in my opinion, two of the greatest failings of most traders are:

  • They trade on too short of a time frame
  • They fail to hold their trades for the maximum profits.

So, in this week’s article, I will highlight how to resolve these two problems by swing trading with Hawkeye indicators.

Below, I’ve included six charts in different time frames and markets. They span everything from stocks to bonds and commodities to Forex. Frankly, I could have included dozens of charts, because these principles of swing trading apply in any market. And by using Hawkeye indicators, finding extremely profitable entries and exits is easy.

The key thing to remember is to wait for the best entries, when all three time frames are in agreement. To illustrate, on each chart, I’ve marked the point where all time frames are in agreement and we are presented with a safe and easy entry as marked by the red and cyan arrows.

In every case, you can see that by waiting until all three timeframes are in agreement, you can enter a long and profitable trend. Then, by holding the trade until your profit target is hit, or you are stopped out, you can make significant profits without all the flurry of trying to get in and out with scalp trading.

Please take a few minutes to carefully study the charts below.

Stock – (Google)

Stocks - Google

Forex – (AUDNZD)

Forex - AUDNZD

Crude

Crude Oil

US Bonds

US Bonds

Stocks – (BHP)

Stocks - BHP

Forex – (AUDUSD)

Forex - AUDUSD

Now, all of this (and much more) is demonstrated in our Wednesday room by my colleague Randy Lindsey.

So, I cannot encourage you enough to come along to the Wednesday room.

Click Here To Reserve Your Seat

Good fortune,

Nigel

Please contact us at [email protected] for any questions you might have about using Hawkeye Indicators in your trading!

[The red and cyan arrows are included for illustration only and do not form part of the software]

[sg_popup id=13743]