The Markets are Losing Steam

Join countless traders worldwide who use
the Hawkeye algorithms day in and day out to gain a powerful edge

The Markets are Losing Steam

In today’s update, I look at the overall market in terms of futures, showing that the markets are losing steam. All the signs of short-term weakness are here. Watch my analysis from a Hawkeye Perspective in today’s video.

Using daily charts, and a daily Hawkeye Fatboy, I can easily see the relative strength of the market. While the major US markets are strong, they are overbought, and now showing signs of potential weak trends.

The decorrelated markets are Crude oil and Gold. Crude is continuing a choppy trend of strength. All indications are for this to continue. Gold was oversold, but is now in a trend of strength. Buying volume is in support of higher prices in gold.

Overall, the markets are losing steam and showing signs of short-term correction in price. Knowing the longer trend helps us to know how to trade the intraday trends. Learn to trade the Hawkeye way.

Click Here for the Free Book (The Lost Art of Volume Price Analysis)

Join Randy in the next free LIVE Hawkeye Demonstration Room held every Wednesday at 9.30am EST US. You will learn more about volume and volume price analysis and see more examples and live trade setups. It is open to all.

Click this link for more information or to join us in class.

Learn to trade the Hawkeye way.

Market Meltdown – Hawkeye Knows

So many market pundits are saying a market meltdown is here etc. Well, Hawkeye Volume does not lie. Today, I’m going to show you why looking at volume will tell you if the market meltdown is here or not.

Emini Daily Chart – Market Meltdown?

Daily Emini Chart

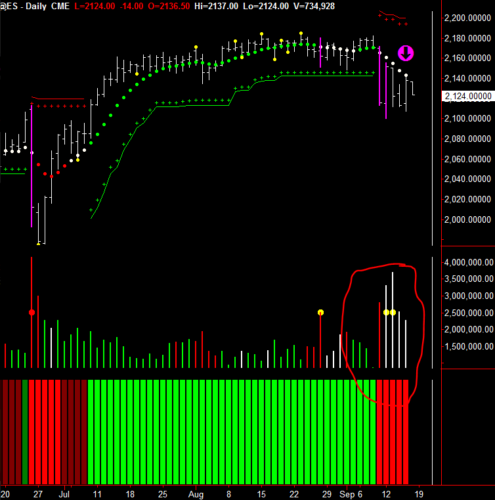
Look at the Hawkeye Volume circled at the bottom of the chart. It’s white for the last four days showing no demand, i.e. the sellers or buyers are not in control. A meltdown would show increasing red selling volume.

Then look at the price where the magenta arrow is. See how the price came up and touched the Hawkeye dot and then backed off – classic price action. Until the daily price breaks the last Widebar (magenta), price will go sideways, but with no advancing volume prices will remain in this range. Price needs high volume to commence a down trend or for the market to meltdown.

Emini Weekly Chart – Market Meltdown?

Weekly Emini Chart

Last week red volume but not high volume. As on the daily markets require high volume to reverse.

And following 6 ways a market moves the Hawkeye Trend dot has gone flat, so we are in congestion waiting for the next isolated or phantom low to show congestion parameters.

Emini Monthly Chart – Market meltdown?

Monthly Emini Chart

Interesting. Look where the dotted line and the magenta arrow are – a doji. If this month does NOT take out the high of doji a Hawkeye Pivot will form which could push the market down for 3,5,7 timeframes. Hawkeye volume knows if the market meltdown is real or not.

[The magenta arrows are for illustration only and do not form part of the software]

Join Randy in the next free LIVE Hawkeye Demonstration Room held every Wednesday at 9.30am EST US. You will learn more about volume and volume price analysis and see more examples and live trade setups. It is open to all.

Click this link for more information or to join us in class.

Learn to trade the Hawkeye way.

Final Note from Nigel

This will be my last blog post. I am retiring from the day to day work of Hawkeye and I have sold the business to my old partner Randy Lindsey. It has been wonderful to have been a small part of seeing so many of the ‘Hawkeye family’ not only go on to be such successful traders but also become close friends, and I am sure I will still attend the live seminars when invited.

When Hawkeye started back in the late 80s, I certainly never have thought there would be nearly 4,000 traders now using my volume algorithm. Please learn volume; 6 ways a market moves; find the right timeframe for you – as slow as possible; do a lot of work on your mental approach; money management/risk reward; and stop searching for the next indicator.

Farewell my friends and Good Fortune,

Nigel Hawkes
Hawkeye Traders

Big Bucks to Me on the British Pound

Big bucks to me on the British Pound! With the referendum on the UK’s exit from the European Union in June, there are going to be violent moves with the GBP.

So let’s get set to benefit from this wonderful opportunity.

Overall chart setups that Hawkeye has identified in all timeframes, Trend set to conservative speed.

The Monthly price is in a downtrend. The Weekly price is also in a downtrend bias, but now in congestion with Pivot high two bars back.

So let’s look at faster time charts.

Daily Chart
GBP Daily Chart
Although in congestion bias up, the volume turned to no demand on Friday and there are two Pivot highs pushing the market down.

Intra-minute Charts

120-minute Chart
GBP 120-Minute Chart
Down day Friday.

60-minute Chart
GBP 60-minute ChartGreat short at 10.00am Eastern.

30-minute Chart
GBP 30-minute ChartAnother great short at 05.30am Eastern.

Hawkeye Perspective 
Please look to trade the GBP crosses at your preferred speed. That’s where the action will be for the next 4-6 weeks. So big bucks to me on the British Pound.

We demonstrate this and many other methods in our live demonstration room held every Wednesday, and this is open to everyone. Click this link for more information or to join us in class.

Good Fortune,

Nigel Hawkes
Hawkeye Traders

[The magenta arrows are for illustration only and do not form part of the software]

[sg_popup id=13743]