“Crude Corner”: Oil Industry Insights, Market Analysis and Price Outlook

Join countless traders worldwide who use
the Hawkeye algorithms day in and day out to gain a powerful edge

“Crude Corner”: Oil Industry Insights, Market Analysis and Price Outlook

The late-week rally we experienced last week was likely being fueled by short-covering rather than speculative buying.

Nothing has changed in the fundamentals to turn the energy complex bullish in the last several days.

Oil remains under pressure and will continue to be for a little while, as world economies are attempting to reopen very slowly in the United States and Western Europe, although resumption in China still remains further down the line.

With May 1 approaching fast, the big question is how will the supply side deliver?

Prices could continue to firm up for this week if more OPEC+ members announce early production cuts.

An escalation of military activity in the Middle East would also be a driving factor for high prices.

However, the wildcard will be the announcement of oil output cuts made by the United States oil producers.

This news could potentially trigger a steep short-covering rally.

The demand destruction is expected to continue, but may slow down a bit if the COVID-19 curve continues to flatten.

Once the coronavirus is under control, output should rebound as well as prices, but don’t expect output or prices to return to pre-virus levels for quite some time.

Rising Tensions In The Middle East Threaten Supplies

After June futures hit $6.50 per barrel and the nearby futures contract went off the board, prices rose in reaction to an announcement from President Donald Trump in which he instructed the United States Navy to fire on any Iranian ships that harass them in the Gulf, although he added later he was not changing the military’s rules of engagement.

This ratchets up tensions once again between the United States and Iran.

However, given the glut we have in the oil market, it is difficult to see this offering lasting support to the market, unless the situation does escalate further.

From A Purely Technical Perspective…

Look out for a strong bullish upside bias to develop on a sustained move above the $20.00 price area…

And look out for a strong bearish downside bias to continue on a sustained move below the $15.00 price area.

April Crude Oil YEARLY Cycles

  • The 10 year cycle makes a high on April 15, then pulls back into April 19 then makes a major top on May 2.
  • The 20 year cycle makes a major low on April 11 then rallies into the April 25.
  • The 30 year cycle continues its sell off into April 18 then rallies into the end of the month.

April is the second most bullish month of the year for crude oil.

With that said, there’s really no clear correlation to support that statement.

But, there is a seasonal tendency for oil prices to rally during the latter part of this month.

Key turning point dates:

  • April 3
  • April 16 to 17 – close to 10 and 30 year cycles
  • April 23 to 24 – close to 20 year cycle

Long-Term MONTHLY Price Outlook

The $12.00 price area can potentially absorb annual selling pressure, above which the $30.00 price area remains a several week target, the $57.00 price area is potentially in reach over the next several months.

Upside, the $30.00 price area can absorb buying pressure through May trading sessions, a daily settlement above the $30.00 price area indicates a good annual low has been placed.

Then the $57.00 price area becomes a several month target where the broader market can potentially place this calendar year’s high.

Downside, a daily settlement below the $12.00 price area will most likely yield a $1.00 price area test within several days to follow, the lowest price support presently found on any chart.

Further downside action would likely result in another negative price retest like we saw during the last week on the CLK20 expiring contract.

Mid – Term WEEKLY Price Outlook … 4 / 27 – 5 / 1

The main trend remains bearish according to the weekly swing chart.

A trade through the $6.00 price area will signal a resumption of the downtrend.

The main trend will change to bullish on a trade through the last main top at the $55.00 price area.

However, this is extremely unlikely.

The minor trade range is between the $34.00 price area to $6.00 price area.

It’s 50% level or pivot point is at the $20.00 price area.

The short-term trade range is between the $55.00 price area to the $6.00 price area.

It’s 50% level comes in at the $31.00 price area.

The main trade range is the $64.00 price area to $6.00 price area.

It’s 50% to 60% retracement zone which is between the $35.00 price area and the $42.00 price area serves as a major price resistance.

Weekly Technical Forecast

Based on last week’s price action, the direction of the June WTI crude oil futures contract for the week-ending May 1 is likely to be determined by trader reaction to a downtrending angle at the $15.00 price area.

Weekly Bullish Scenario

A sustained move over the $15.00 price area will indicate the presence of buyers.

If this move creates enough upside momentum then look for a surge into the minor pivot at the $20.00 price area.

Since the main trend remains bearish, sellers are likely to come in on the first test of this level.

In attempts of the bears trying to overtake it, could potentially trigger an acceleration to the upside with the next major target coming in at the $31.00 price area.

Weekly Bearish Scenario

A sustained move under the $15.00 price area will signal the strong return of sellers.

The daily chart indicates there is plenty of room to the downside with the next downtrending target angle coming in at negative price areas.

Short – Term DAILY Price Outlook … April 28, 2020

For Tuesday, the $12.00 price area remains a long-term support level that can absorb not only daily selling, but also selling pressure throughout the balance of May’s trading activity as long as the market continues placing weekly and monthly settlements above the $12.00 price area.

Upside today, the $17.00 price area would most likely contain initial strength, beyond which the $19.00 price area is able to contain the balance of the session’s strength.

A settlement today above the $19.00 price area indicates potentially reaching the $22.00 price area within several days and a next $30.00 price area target could then potentially be within reach by the end of next week.

Downside today, opening / breaking below the $12.00 price area allows a further fall to the $11.00 price area intraday.

A weekly settlement today below the $12.00 price area critical support will likely allow for further bearish downside back into the single digit prices again, potentially as low as the $1.00 price area by the week’s end.

Let’s reflect on Monday’s charts above.

The price action on the 240 minute chart(s) exited congestion during the pre-market hours on Monday morning on the currently traded and 2 future expiring contracts.

A successful retest of the $12.00 price area held prices from falling further.

Today’s closing price on the closest expiring contract CLM20 was $12.93.

Fresh Hawkeye Demand Zone(s) on the 240 / 480 / 960 Minute and Daily Charts all held selling pressure from falling further during Monday’s trading session.

Confluence among Hawkeye Supply and Demand Zones stacks the odds in our favor of predicting price action and are key for establishing price targets.

The Zones on the 240, 480 & 960 Minute charts all presented clear target(s) to have taken a short position when price exited congestion on the 240 chart.

While there is clearly a bearish sediment in the market, the $12.00 price area remains a key area to hold and resume closing above in order to avoid retesting single digit prices again.

Want to learn more about how Hawkeye can help you spot opportunities in the oil market? Tap here to view a no-cost presentation right now!

Do you know how to read this critical market metric?

One of our members posted a great question this week inside the Hawkeye Traders Inner Circle.

Let me just say, I love interacting with our members there day to day…

But I also love seeing our members interacting with and helping each other.

The camaraderie is really something special…

And with so many traders of all different experience levels in the group, it’s an incredible resource for newer traders to learn and develop their skills.

OK, enough with the warm and fuzzies… back to the question.

Gregory asked, “What does tick speed tell you?”

This really is an important question, because tick speed is one of the most critical elements you need to understand as a trader.

See, tick speed is a measure of the actual number of trades taken per price bar.

Many traders don’t realize it, but tick speed is the most accurate way of measuring market momentum because it represents each change in price, irrespective of the time taken.

When you know the tick speed at which the markets are operating, it allows you to set your chart speeds in harmony with the changes in the markets.

That, of course, can lead to more accurate… and profitable… trading.

Now, that’s all great in theory…

But how do you actually measure and select the right tick speed in your day-to-day trading?

That’s where the Hawkeye GearBox and GearChanger come into play.

Here, let me show you an example from an E-mini futures chart:

Hawkeye Gears Example

On this chart, you can see 4 tick speeds that Hawkeye GearBox calculated on this particular day.

The three speeds annotated by the top three arrows show the optimal speeds you’d use to trade the E-mini in this situation.

Now, at the bottom of the chart you’ll see the Hawkeye GearChanger.

The GearChanger shows you the correct market speed at any given point during the day (where the bottom red arrow is pointing).

Because the tick speeds are color coded, you can quickly glance at the GearChanger to know exactly which tick speed you should be trading at.

So, when the GearChanger changes color — say, to orange — you know to trade off the appropriate orange tick speed, indicated by the GearBox value for orange (6,160 ticks in this case).

And there you have it…

A quick and dirty breakdown of tick speed, and how Hawkeye helps you trade at the optimal tick speed at all times.

Of course, the GearBox and GearChanger are included as part of the Hawkeye Professional Package…

But you can also get them as a stand-alone module to add to your Hawkeye Starter or Standard setup.

Just click here to learn more and grab your copy of the GearCombo Module at a special members-only rate!

“Crude Corner”: Oil Industry Insights, Market Analysis and Price Outlook

On Wednesday, the United States Energy Information Administration reported that U.S. crude inventories rose another 15 million barrels for the week ended April 17 to 518.6 million barrels.

That marked a 13-week climb and followed a record weekly increase of 19.2 million barrels a week earlier.

Another large oil build propels us closer to a record oil inventory level, which is now less than 17 million barrels away.

As refining activity dips to a new 12-year low, the crude build has actually been kept in check by lower oil imports – dropping below 5 million barrels per day for the first time in the weekly data since 1992.

Rising Unemployment, Rising Oil Inventory

The Labor Department reported that the number of Americans applying for state unemployment benefits totaled 4.427 million last week.

Combined with the prior four jobless claims reports, the number of Americans who have filed for unemployment over the last five weeks is 26.45 million.

That number far exceeds the 22.442 million jobs added to payrolls since November 2009, when the U.S. economy began to add jobs back after the recession.

The bottom line is that 26.45M people are NOT consuming products produced by crude oil.

They aren’t commuting, going to the gym, going out to dinner or leisurely traveling.

April Crude Oil YEARLY Cycles

  • The 10 year cycle makes a high on April 15, the pulls back into April 19 then makes a major top on May 2.
  • The 20 year cycle makes a major low on the April 11 then rallies into the April 25.
  • The 30 year cycle continues its sell off into April 18 then rallies into the end of the month.

Historically, April is the second most bullish month of the year for crude oil.

With that said, there’s really no clear correlation to support that statement right now.

But, there is a seasonal tendency for oil prices to rally during the latter part of this month.

Key turning point dates:

  • April 3
  • April 16 to 17 – close to 10 and 30 year cycles
  • April 23 to 24 – close to 20 year cycle

Long-Term MONTHLY Price Outlook

The $12.00 price area can potentially absorb annual selling pressure, above which the $28.00 price area remains a several week target, the $57.00 price area is potentially in reach over the next several months.

Upside, the $28.00 price area can absorb buying pressure through the remaining May trading sessions, with a daily settlement above the $28.00 price area indicating a good annual low has been placed.

The $57.00 price area then becomes a several month target where the broader market can potentially place this calendar year’s high.

Downside, a daily settlement below the $12.00 price area will most likely yield a $3.00 price area test within several days to follow, the lowest price support presently found on any chart.

Further downside would result in another negative price retest like we saw earlier in the week on the May CLK20 expiring contract.

WEEKLY Price Outlook … April 20 – 24, 2020

The main trend remains bearish according to the weekly swing chart.

The market is in no position to change the main trend to bullish, but holding the mid-March bottom at $21.00 price area which could help June WTI crude oil build a solid enough base to support a strong short-covering rally…

While the short-term trend also remains bearish.

Taking out the short-term top at the $34.00 price area won’t change the main trend to bullish, but it will shift momentum to the upside.

Taking out $21.00 price area will reaffirm the downward bearish trend.

The short-term range is between the $21.00 to $34.00 price range.

Its 50% level or pivot at the $28.00 price area is controlling the weekly direction of the market.

On the upside, the nearest 50% level resistance comes in at the $38.00 price area.

Based on the past week’s price action, the direction of the June WTI crude oil market for the week ending April 24 is likely to be determined by trader reaction to the pivot at the $28.00 price area.

Downside, a sustained move under the $28.00 price area will indicate the strong presence of sellers.

The first target is the main bottom at the $21.00 price area.

Penetrating this bottom will indicate the selling pressure is gaining traction.

Crossing to the weak side of the downtrending angle at $19.00 price area will put the June WTI futures contract in an extremely bearish position, most likely creating a further downside move.

Upside, a sustained move over the $28.00 price area will signal the presence of optimistic buyers.

If this move is able to create enough upside momentum then look for a potential spike into the $34.00 price area.

Short – Term DAILY Price Outlook … April 24, 2020

For Friday, the $12.00 price area remains a long-term support level that can absorb not only daily selling, but also selling pressure throughout the balance of May’s trading activity as long as the market continues placing weekly and monthly settlements above $12.00 price area.

The next several weeks are likely to yield an upside potential of testing the $30.00 price area.

Upside today, the $19.00 price area most would likely contain initial strength, beyond which the $22.00 price area is likely and able to contain the balance of the session’s strength.

A settlement today above the $22.00 price area indicates potentially reaching the $27.00 price area within several days.

Downside today, breaking below the $12.00 price area allows a further fall to the $11.00 price area intraday.

A weekly settlement today below the $12.00 price area will likely allow further downside to the $3.00 price area next week.

Want to learn more about how Hawkeye can help you spot opportunities in the oil market? Tap here to view a no-cost presentation right now!

“Crude Corner”: What In The History Of Crude Happened Yesterday?

While the markets were spiking last week thanks to some optimism on the COVID-19 vaccine and promising plans to begin a slow reopening of the United States economy, oil is once again marching to the beat of a different drum. 

Having suffered the most precipitous collapse ever with prices never seen before and even trading into the negative, something more positive is apparent. This is not reflected in the immediate trading price. Rather, this is being reflected in future expiring contract trading prices attempting to recover.

Want to learn more about how Hawkeye’s volume-based suite of indicators can help you spot opportunities on oil?

Click here to catch an in-depth class at no cost!

“Crude Corner”: This Week’s Crude Oil Roundup

Weekly Crude Oil Inventory Report

Oil dropped to its lowest level in more than 18 years during Wednesday’s trading session amid reports suggesting persistent oversupply and collapsing demand due to COVID-19 outbreak related economic lockdowns.

The American Petroleum Institute (API) said on Tuesday, United States crude inventories increased by a larger than expected amount of 13.1 million barrels. According to data from the United States Energy Information Administration, for the week ending April 10 inventory increased by 19.2 million barrels.

Analysts had been expecting a rise of 12.02 million barrels. There is no feasible agreement that could possibly cut supply by enough to offset such near-term demand losses.

Headlines Suppressing Demand

Consumer and manufacturing reports for March showed a significant hit to the economy from the COVID-19 outbreak was even swifter and deeper in the early weeks of the shutdown than anticipated.

March retail sales fell 8.7%, the most ever recorded in government history. The New York regional manufacturing activity hit an all-time low, declining a shocking 78.2%. Industrial production slipped 5.4%, the largest decline since 1946, and manufacturing was down 6.3%, a record reflecting in part the 28% decline in auto production as plants shut down.

The economic reports showed the double whammy of state shutdowns in mid-March on two pillars of the economy – the consumer and business. The reports were even more dire than expected, and foreshadow even worse declines in April’s activity, with state shutdowns affecting areas responsible for more than 90% of the economy.

Unemployment Suppressing Demand

The Labor Department reported that the number of Americans applying for state unemployment benefits totaled 5.245 million last week.

Combined with the prior three jobless claims reports, the number of Americans who’ve filed for unemployment over the last four weeks is 22.025 million.

That number is just below the 22.442 million jobs added to payrolls since November 2009, when the U.S. economy began to add jobs back after the recession.

Nearly an Entire Decade of Progress Set Back in Only 4 Weeks Time

In 4 weeks time we have nearly given back all of our employment progress made in the past decade. That’s 22 million cars that don’t get started and driven to work everyday, along with 22 million incomes that have been impacted causing no travel demand, creating limited forms of consumption. In conjunction with heavy over supply and forced suppressed demand due to shutdown orders, the foreseeable future for energy prices look very grim.

On The Charts

Upside Scenario: 38.21 can contain buying through May, once tested the market is susceptible to falling back to 21.83 within 2-3 weeks. On the other hand, a daily settlement above 38.21 would indicate a good low into summer activity, 57.50 then expected within 2-3 months.

Downside Scenario: A weekly settlement below 21.83 (and below the recent 21.51 low weekly- settlement) would indicate 12.17 within 3-5 weeks, the next long-term support threshold able to absorb selling through the year, and regarding 12.17, quite possibly the balance of the decade.

Want to learn more about how Hawkeye’s volume-based suite of indicators can help you spot opportunities on oil?

Click here to catch an in-depth class at no cost!

The Bull Trend Continues

In today’s update, I discuss how the bull trend continues in the index markets. I don’t mention it in the video, but Gold almost made it to $1800/oz today, breaking through resistance like a hot knife in butter.

The Bull Trend Continues

From the daily ES chart (S&P 500), it’s clear to see the Hawkeye trend is in a strong bullish breakout. Last week, we alerted you to this potential, and it is being realizes even today. While the daily tend is clearly bullish, the weekly still has a way to go to confirm the break, as volume is still declining and is still showing bearish pressure. 2873.50 is the break point to the high side if we are going to see the up-trend continue. The upside target will be in the 3040 area. If 2873.50 holds, then we could see prices back down to the low-side support at 2634ish. At the moment, volume is still lower than expected, and volatility is continuing to drop, which are all signs of a continued upward price move.

Although I didn’t discuss it in the video, Gold has been remarkable in it’s bullish rise through price. Today, the GC (gold futures) almost hit $1800, a price level not seen since early 2013. GC cut through resistance at 1674 like a hot knife in butter, and looks to firmly have broken into the new supply zone area. Expect price to pull back to validate the 1674 break before it starts to consolidate in the 1800 area.

The Hawkeye Perspective

If you follow volume and price, it’s clear to know where the important breaks in price are, and where price is heading. Don’t miss the opportunities presented to you in these markets, and make sure to listen to what the markets are saying. Learn to trade the Hawkeye way.

Watching The Signals Align On a Potential Windfall

In today’s video update, Randy is breaking down a potential entry setting up right now on the S&P.

Randy first identified this setup on Monday, when Hawkeye signaled a break from consolidation following the market close…

And if it ends up as a true long entry signal, traders stand to see a potential windfall.

Check out the video to learn the confirmation signals he’s watching for before the long weekend…

And how the Hawkeye method can tip you off to major opportunities just like this one!

Want to learn more about becoming a Hawkeye Trader? Call (888) 233-8598 and ask our VIP Client Services representative about a very special discounted offer!

Bullish Breakout to the Upside

In today’s market update, I’m watching the potential bullish breakout to the upside in the S&P 500 emini (ES). If today’s close is greater than 2634.50, we confirm a bullish break of congestion, and expect the market to advance higher, up to the next resistance zone.

From the charts

The daily charts show a strong bullish bar that is breaking out, but it needs to confirm by closing above 2634.50, our key breakout level. Notice the declining volume bars going into the low of the daily charts – this is hidden bullishness. Hawkeye volume also shows a great bullish reversal bar on the weekly chart. The monthly chart also confirmed a bounce off the lower trendline with increasing volume.

The Hawkeye Perspective

From our Six Ways a Market Moves teaching, we know that a break from consolidation leads directly into a trend run phase. So expect a bullish break from the S&P if today’s close is confirmed above 2634.50. Know where the markets are expected to go with your very own Hawkeye license.

$2000 in Two Hours Following the Rules

In today’s update, I show how the basic Hawkeye tools identified just over $2000 in two hours following the rules. Using only the Hawkeye Standard Package tools, I show the setup, entry, and exit of a short emini S&P (ES) idea.

From the charts

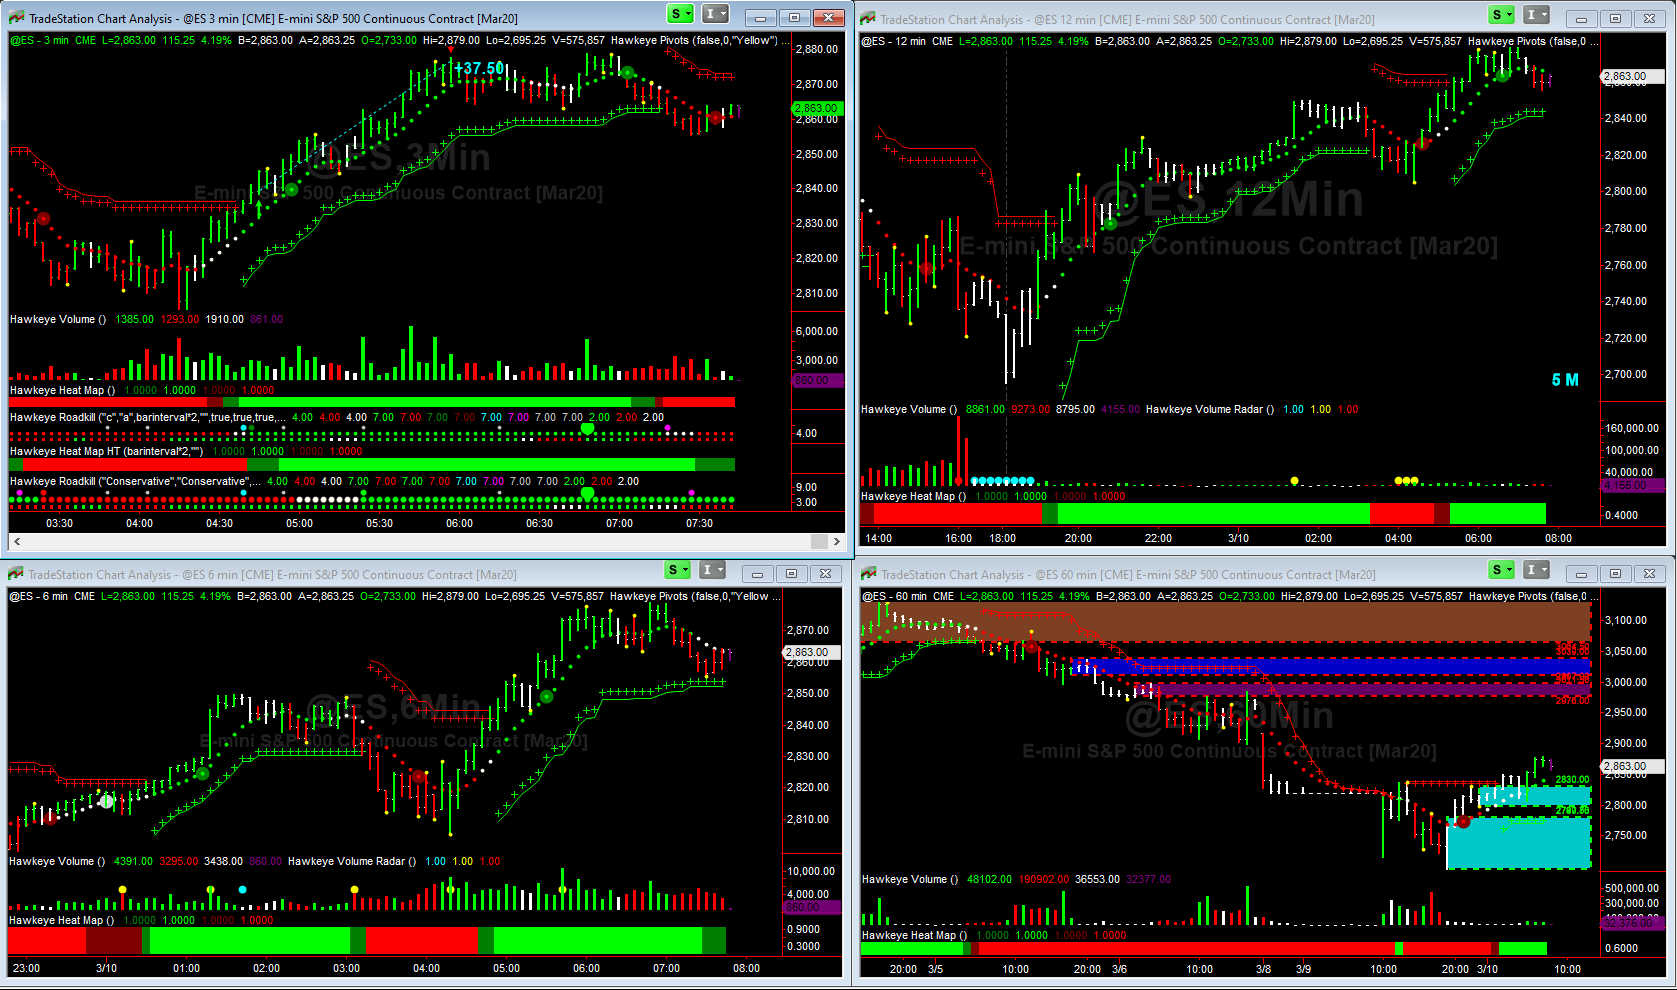
Using a 3min chart as my trade chart, I use 6min and 12min charts for confirmation. The trade setup came at 0618am with a break of consolidation, and confirmation of volume and momentum on the 6min and volume on the 12min. This served as the setup to confirm the entry criteria. That was my trigger bar, so I enter on the following bar. By applying my Hawkeye Levels ATR, I know exactly my risk in the trade, and I see the reward targets laid out before me.

With only one contract traded, my goal was to maximize the reward and get at least a Level 5 or Level 7. Level 5 was hit after two hours, and exhaustion bars identified, so the trade was ended. The result was 40.5 ES points, or just over $2000/contract traded.

The Hawkeye Perspective

Using just the Hawkeye Standard Package, I was able to show how to identify a high probability setup, how to enter the trade with confidence, and how to exit the trade at a point that maximized my rewards. Learn to trade the Hawkeye way.

Can you say Volatility?

In today’s market update, I want to ask you a question: Can you say Volatility? Of course you can, but wow, the markets are shouting it from the roof tops! I review the current charts on volatility, including updates on index futures, gold, and coffee.

From the charts

The daily chart of the volatility index (VIX) gives us a great picture of the current market change. In only four weeks, the VIX has surged from 12 to over 85, just short of the 2008-2009 housing bubble fiasco, where VIX shot up to 89.53. As you know, when VIX goes up, the market usually goes down. Also, as VIX increases, so does the ATR of the markets. And this has a HUGE impact on retail traders, and their ability to trade these markets.

With increasing volatility, the brokerages are also enacting FULL margin requirements on all positions, and are liquidating positions that don’t have stop orders attached. And the margin requirements for many of the futures markets have gone ballistic. For example, the Nasdaq (NQ) has an initial margin requirement of $16,500. Many retail traders only have accounts in the $5000 – $10,000 range, so this effectively keeps them from trading this market.

However, with the injection of new money into the markets from the government, via buying debt, there is a brief relaxing in the VIX, and corresponding rallies in the equity markets. Hopefully, this will be enough to create a consolidation area and enough time for the markets to pause and regroup.

Gold is going ballistic again. Overnight, gold rose over $130, getting back into striking range of $1700/oz. Watch for the recent strength of the USD to begin to weaken.

Last but not least is coffee. Last week, I highlighted coffee in the $108 range. I showed the technical reasons to start to accumulate coffee and to watch for reasons to go long. Today, coffee has hit over $125, up over $17 since last week.

The Hawkeye Perspective

If you know how to read the charts, volume and price are telling you a story. Are you listening, and can you understand what the markets are telling you? We teach you every week how to interpret volume and price together. Get started today with your very own copy of Hawkeye, by clicking the link below. Learn to trade the Hawkeye way.

Is Coffee Ready for a Turnaround?

Is coffee ready for a turnaround? In today’s update, I provide a brief update on the current state of the markets from a Hawkeye perspective, and I highlight a potential build in a coffee turnaround. Is the downtrend in coffee over? I’ll show you my analysis in today’s video.

From the charts

In today’s analysis, I quickly go over the major markets using the daily, weekly, and monthly charts. Using the Hawkeye Professional tools and the Zones make it easy to analyze and see where price can potentially go, based on volume. I looked at the S&P, Nasdaq, Dow, Russell, Coffee, and Bitcoin. It was very interesting to see how much media influenced hysteria has affected the markets, as the route in prices continue.

The S&P has broken support as 2319 and looks to have sights on the psych support at 2100, or even 2000. =O The Dow and Russell show very similar charts, with corresponding low side targets at 17687 (Dow) and 950 (Russell). The Nasdaq has not taken the hit as much as the other markets, and is showing support at 6680. If this breaks, then the downside target would be below 6000. =O

Finally, there were two markets we saw some possible light at the end of the tunnel. Coffee and Bitcoin.

Bitcoin has lost over 50% of it’s value in one month. =O But we see it has entered into a strong support demand zone just below 4300. It is there we saw buying pressure begin, and now the build for a potential v-shaped rebound. The upside targets would be back to 7000, 8000, or maybe even 9000.

Coffee has found support just under 100, and is showing good volume accumulation/distribution patterns. In addition, price has failed to create new lows, thus setting up a great base for a spring upwards, or upthrust. The targets for the potential reversal would be back to 120, 135, 144, or even back above 200.

The Hawkeye Perspective

Is Coffee ready for a turnaround? It very well could be, but the timing might be early… make sure Hawkeye confirms any entry by following the rules. And the best way to do that is with your very own Hawkeye Professional Package Lifetime license.

I know It’s Scary, but Now is the Time to Buy

In today’s update, I show the outright fear and carnage in the markets over the last three weeks. However, I show why Hawkeye believes it’s not time to panic, given the 30% plus drop in the markets. I know it’s scary, but now is the time to buy, and I’ll show you why.

From the charts

Looking at the daily S&P futures chart (ES), we show the 30% decline in only three weeks. This blood-bath was identified beginning back in December 2019 when we saw declining buying pressure as the markets kept making new highs. In healthy markets, you see increasing buying pressure as price climbs. Our V-Swarm software showed this very clearly, keeping us on the right side of the market.

We also see from the daily, weekly, and monthly charts that price is currently entering strong support, or a confluence demand zone (Hawkeye Zones). This is historically a highly probable place for buying activity. We would expect prices to rebound from here, or move into an accumulation/distribution phase. This is very evident from the HUGE daily price bar printed on 12 March without much volume support (Hawkeye V-Swarm).

Lastly, without volume support, the markets can’t continue to go down. We also see from our Hawkeye Fatboy that the markets are extremely oversold and are due for a cycle back to fair value. Additionally, the monthly chart shows that price has come down to the support trendline in place since the market crash of 2008. This is a strong support area for the current bullish trend.

The Hawkeye Perspective

I know it’s scary, but now is the time to buy. Now is the time to start taking the funds you set aside for just such occasions, and start to buy what you would have been buying just three weeks ago. Except now, you get a 30% discount. Learn to trade the Hawkeye way.

Timing Market Bottoms Using Buy-Sell Ratios

In uncertain times like these, it’s easy to get discouraged and think that things will never get better.

But the truth is that with volatility always comes opportunity…

And I want to share something pretty incredible that may just give you the perspective shift you need to keep going.

My good friend and expert trader Dustin Pass was recently showing me something called the “insider buy-sell ratio”…

And how traders can use it to perfectly time market bottoms.

Now, the insider buy-sell ratio is a number that demonstrates when corporate insiders within a specific industry are moving into the market, and compares it with price.

It gives a clear picture of how these CEOs, CFOs, VPs, directors, board members and other insiders get in perfectly at almost every low within their sectors.

Here, let me show you a few examples…

But before we start looking at individual sectors, let’s take a glance at the market as a whole…

Because it’s important to realize just how powerful this information really is.

The SPY is a great place to start.

Of course, the SPY is an ETF that tracks the S&P, and it’s made up of just about every sector…

So it’s a great way to get a bird’s eye view of the overall market.

Check out this chart of the SPY with the insider data laid across it.

The green bars represent insider buying…

The higher the green bars, the more insiders are buying:

As you can see, they flooded the market during the 2009 lows, the 2011 pullback, the dip in late 2015, and again in late 2018 before the market started skyrocketing last year.

In other words, the insiders bought BIG at all the best times to buy over the past 10+ years.

… And it’s like this across every sector.

Financials…

Utilities…

Basic materials…

Every single low, in every single sector… the insiders bought into perfectly.

Now, you may be thinking, “Sure Randy, this is great to know…”

“But how is historic data going to help me get in on current market lows?”

Well, Dustin has actually put together a Masterclass that explains exactly how you can track the moves of these corporate insiders…

And piggyback their trades to get in on perfectly timed buys just like these.

See, these insiders have to report every trade they make on a form that gets filed in a publicly accessible database…

And in his free training, Dustin’s revealing exactly where… and how… to find these trades for yourself.

Just click here to get in on this Masterclass and learn everything you need to know about following these insiders — it’s absolutely free.

Volume Identified a $1900 Setup

In today’s update, I show how volume identified a $1900 setup in the S&P500 e-mini futures contract ES. Using multiple-timeframe charts, volume clearly shows buying pressure and I give all the details in today’s video.

From the charts

The 60min ES chart was the first to show clear price direction. I show the price extension bar on opposing volume as the key change in sentiment. Then the 6min chart was the clincher… an extension bar with opposing volume, which would have signaled selling volume… but Hawkeye showed buying pressure. This is unique to Hawkeye Volume – no other software will show you the inside nature of volume and price action intent.

From the 3min chart, we saw our entry signal, following our 3-Step Entry/Exit Method. Using a 3:1 Reward:Risk ratio, you can clearly see 37.5 ES points, or about $1900/contract traded on the setup.

The Hawkeye Perspective

I show how volume identified a $1900 setup in the S&P500 e-mini futures contract ES. Volume is truly a leading indicator. Hawkeye volume is unique in that it shows the underlying intent of price. Even when the close is less than the open, and “dumb” volume would have shown selling pressure, Hawkeye Volume and volume price analysis showed there was buying pressure and a key reversal in play. Learn to trade the Hawkeye way.

S&P is Hitting Support

In today’s update, I dive deep into the S&P 500 emini ES futures contract to show the S&P is hitting support at the 2900 area. We identified this area 5 days ago during out Monday update.

From the charts

The daily ES chart showed all three support levels have been broken to the downside. We see huge selling pressure increasing daily as the price continues to drop down to key support levels identified earlier this week. We are now at the 2900 area today, and holding.

With volatility exploding up to levels we haven’t seen since 2018 (over 47), this might be a bit overextended. I show that the 2018 correction was about 500 points, and this current correction is about 530 points… so we are due a pause, consolidation, and possible reversal rally.

The Hawkeye Perspective

Volume continues to show us where price is going, and how to respond. Historically, when this much selling pressure (volume) occurs in any one week period, a sharp reversal occurs to at least 1/2 of the ATR of that weekly bar. It is our Widebar rule, and Hawkeye members know exactly how to follow that rule. After all, we are trading probabilities and managing risk. So learn all about trading Volume HERE.

Crude Oil Prices Continue to Fall

In today’s Hawkeye update, I talk about how crude oil prices continue to fall. Using volume of course, I show how and why oil is slipping in price, and what my expectations are for future price.

From the charts

Using the daily crude oil futures (CL) chart, the line-in-the-sand we drew on Monday was tested, and failed to hold, with CL prices breaking below the psychological $50 support. As of today, it is trading at $47. Volume showed that buying pressure was below average, but selling pressure was consistently above average. This was confirmed by the weekly and monthly charts as well.

Our expectations for future price are based on Hawkeye Zones. We expect price to stall around $46, but continue to fall to longer term support around the $44.60 area.

The Hawkeye Perspective

While crude oil prices continue to fall, we will be watching the volume for clues on any consolidation, or reversal signals. Volume will let us know what the future price direction will be. Learn to trade the Hawkeye way.

Click Here for the Free Book (The Lost Art of Volume Price Analysis)

Or for a Trial of the Hawkeye Trading Software

Join Randy in the next free LIVE Hawkeye Demonstration Room held every Wednesday at 9.30am EST US. You will learn more about volume and volume price analysis and see more examples and live trade setups. It is open to all.

Click this link for more information or to join us in class.

Learn to trade the Hawkeye way.

Markets are Letting Off Steam

The markets are letting off steam in today’s Hawkeye update. I show from a uniquely Hawkeye perspective what to expect from the major market indices.

I go in order from the S&P 500, the Nasdaq, Dow, Russell, Crude Oil, then Gold. All of the major markets are in correction mode, and the flight to safety is evident. I show the major support and resistance areas and expected correction for each of these markets.

Gold of course is the safety net, which itself is in correction after an extended yearly downtrend. It’s nice to see this bullishness in Gold, as it breaks it’s 2nd overhead resistance level around 1680. Please refer to my previous article on Nov 8th, 2019 entitled Gold is Starting to Glitter Again

Each of the stock indices are showing partial “head and shoulders” formations, with the exception of the Russell, which already formed a nice H&S pattern.

The Hawkeye Perspective

The markets are strong and continue to show resilience, but with volatility spiking, and fear creeping back into the markets, corrections are inevitable, although healthy. The markets are letting off steam. But from these longer-term perspectives, it is very helpful for those trading shorter-term, intraday trends.

Learn how we analyze the markets from a uniquely Hawkeye perspective, and learn to trade the Hawkeye way.

If you want to learn more about trading with V-swarm and the Hawkeye way you can attend an on demand webinar here

V-Swarm Identifies Weakness in CL Trade

v-swarm identifies weakness

In today’s update, I show a quick crude oil trade where Hawkeye V-Swarm identifies weakness in the trade. This allows me to exit with a small profit and stay out of trouble.

One of the most difficult aspects of trading is knowing when to cut a trade.

Especially when you have seen some profit and it begins to move against you (like it just did for me).

The greed in you wants to hold on to get the profit you once saw back.

Today I talk about how to know when to hold on to that trade vs when to close that trade down and put your money to work in a better opportunity.

V-Swarm Identifies Weakness

You see, volume is a leading indicator. Using volume correctly with price enables us to know the sentiment of the market on any timeframe. So when I saw Hawkeye V-Swarm (volume) showing me weakness in the trade was developing, I had time to adjust my stops and lock in profits in a trade that would have ended in a stop loss. V-swarm identifies weakness and strength in trends, so it can help improve your bottom line.

The Hawkeye Perspective

While in the longterm, the trade would probably work out (and it did), I followed my rules to stay safe and be able to trade another day. Sometimes, “you gotta know when to hold ’em, and know when to fold ’em”. In today’s example, I knew when to fold ’em and walk away.

If you want to learn more about trading with V-swarm and the Hawkeye way you can attend an on demand webinar here

Old Republic Intl (ORI) is a Solid Long Trade Idea.

In today’s update, I share why Old Republic Intl (ORI) is a solid long trade idea. It’s a solid company with a strong yearly growth record. It has recently consolidated, and is now breaking out. See more in today’s video.

From the charts…

The monthly ORI chart shows a solid foundation of growth for the past 7 yearn. It has good earnings, an attractive P/E ratio, and pays 3.5% dividends. But the best part is the daily chart.

The daily ORI chart shows the stock has just broken from a solid foundation of consolidation, with very good volume. A “double-dot” Roadkill signal confirms this move as a low risk, high probability trade idea. Historically, each break from consolidation has given about 10% price increase, on average. That’s what I expect from this trade idea.

The Hawkeye Perspective

When you see multiple-timeframe alignment of volume and momentum, expect high probability and low risk entries. ORI is setup today to deliver, and I will be looking to take advantage of this setup.

We teach this and other strategies in our upcoming live seminar, called Project V-Swarm Live 2020. We have invited special guests to join us as well, and I’m super excited about what they will bring. Here is the link for more information

Learn to trade the Hawkeye way.

Click Here for the Free Book (The Lost Art of Volume Price Analysis)

Or for a Trial of the Hawkeye Trading Software

Join Randy in the next free LIVE Hawkeye Demonstration Room held every Wednesday at 9.30am EST US. You will learn more about volume and volume price analysis and see more examples and live trade setups. It is open to all.

Click this link for more information or to join us in class.

TEVA Update, and Macy’s Has Upside Potential

In today’s video, I provide a TEVA update, and show you why Macy’s (M) is looking good for a short term bullish move.

On Jan 14th, I shared why TEVA was on my radar. Since then, the stock rose over 20% in only a couple of days. Now, for the same reasons I liked TEVA, now I’m not liking it so much.

From the daily chart, I showed how volume made me interested in a bullish move. Now that price is at overhead resistance, I see volume showing me that selling pressure is now back. I would be taking profits off the table at this point, and wait for a short term correction. This 20% move was a great “base hit”, but there is still more to come.

Next, I share with you why Macy’s has upward potential. Like TEVA, M is a value play that has all the volume signs of potential bullishness. Buying pressure started to come in late in 2019, and has increased on the weekly and daily charts.

From the current price, my idea is for M to push back up to the $22-$23 resistance area. That’s a 30% “base hit”. When volume and price start working together, it makes trade ideas like this much more attractive. The daily chart is already in an uptrend, and the weekly is not far behind.

We teach this and other strategies in our upcoming live seminar, called Project V-Swarm Live 2020. We have invited special guests to join us as well, and I’m super excited about what they will bring. Here is the link for more information.

Learn to trade the Hawkeye way.

Click Here for the Free Book (The Lost Art of Volume Price Analysis)

Or for a Trial of the Hawkeye Trading Software

Join Randy in the next free LIVE Hawkeye Demonstration Room held every Wednesday at 9.30am EST US. You will learn more about volume and volume price analysis and see more examples and live trade setups. It is open to all.

Click this link for more information or to join us in class.

TEVA is on my Radar

In today’s update, I want to share why TEVA is on my radar. TEVA is a value pharma stock that looks to be gaining strength. I show the breakdown in price following volume signatures. Then I show the potential future price based on current volume signatures.

From the charts…

On the Monthly and Weekly charts, I show how Hawkeye Volume shows buying pressure for the past two months, with price firmly at support in a demand zone. This implies bullishness on the short term.

On the Daily chart, I see a bullish price extension on opposing volume… a key indication of potential reversal or short term correction. Based on the current price, I see TEVA going to $10.15 in the short term. If volume starts to show selling pressure in the supply zone there, I expect a continuation to the downside, back to the $8 support area.

The Hawkeye Perspective

TEVA is on my radar for now. Short term bullish, and long term bearish. This value stock could be a real shining star in 2020. It will be easy to spot if you understand volume and price. Learn to trade the Hawkeye way.

We teach this and other strategies in our upcoming live seminar, called Project V-Swarm Live 2020. We have invited special guests to join us as well, and I’m super excited about what they will bring. Here is the link for more information.

Learn to trade the Hawkeye way.

Click Here for the Free Book (The Lost Art of Volume Price Analysis)

Or for a Trial of the Hawkeye Trading Software

Join Randy in the next free LIVE Hawkeye Demonstration Room held every Wednesday at 9.30am EST US. You will learn more about volume and volume price analysis and see more examples and live trade setups. It is open to all.

Click this link for more information or to join us in class.

GBPUSD is Ready for a Correction

In today’s update, I show how the GBPUSD is ready for a correction. Using our currency strength meter and active supply and demand, I show our expectations.

From the charts…

The Hawkeye Fatman, the leading currency strength meter, shows the GBP oversold and gaining strength, and the USD overbought and losing strength. This is a great combination that signals a potential correction long in the GBPUSD pair.

Price and volume have shown that the GBPUSD failed to create new lows, and that buying pressure has started off of the established demand zones.

The Hawkeye Perspective

We expect to see a correction to the long side on the GBPUSD, back up to 1.3030, or even 1.3050, based on our 60min charts. GBPUSD is Ready for a Correction.

We teach this and other strategies in our upcoming live seminar, called Project V-Swarm Live 2020. We have invited special guests to join us as well, and I’m super excited about what they will bring. Here is the link for more information.

Learn to trade the Hawkeye way.

Click Here for the Free Book (The Lost Art of Volume Price Analysis)

Or for a Trial of the Hawkeye Trading Software

Join Randy in the next free LIVE Hawkeye Demonstration Room held every Wednesday at 9.30am EST US. You will learn more about volume and volume price analysis and see more examples and live trade setups. It is open to all.

Click this link for more information or to join us in class.


UPDATE:

GBPUSD has hit the upside target of 1.3030 and 1.3042 was the high to date (Jan 15th).

This Gold Trade is Sick!

In today’s video update, I show a gold futures trade that is absolutely sick… in the best sense possible. The Hawkeye V-Swarm system identified the setup, entry and exit with almost $3000 potential profits in less than an hour.

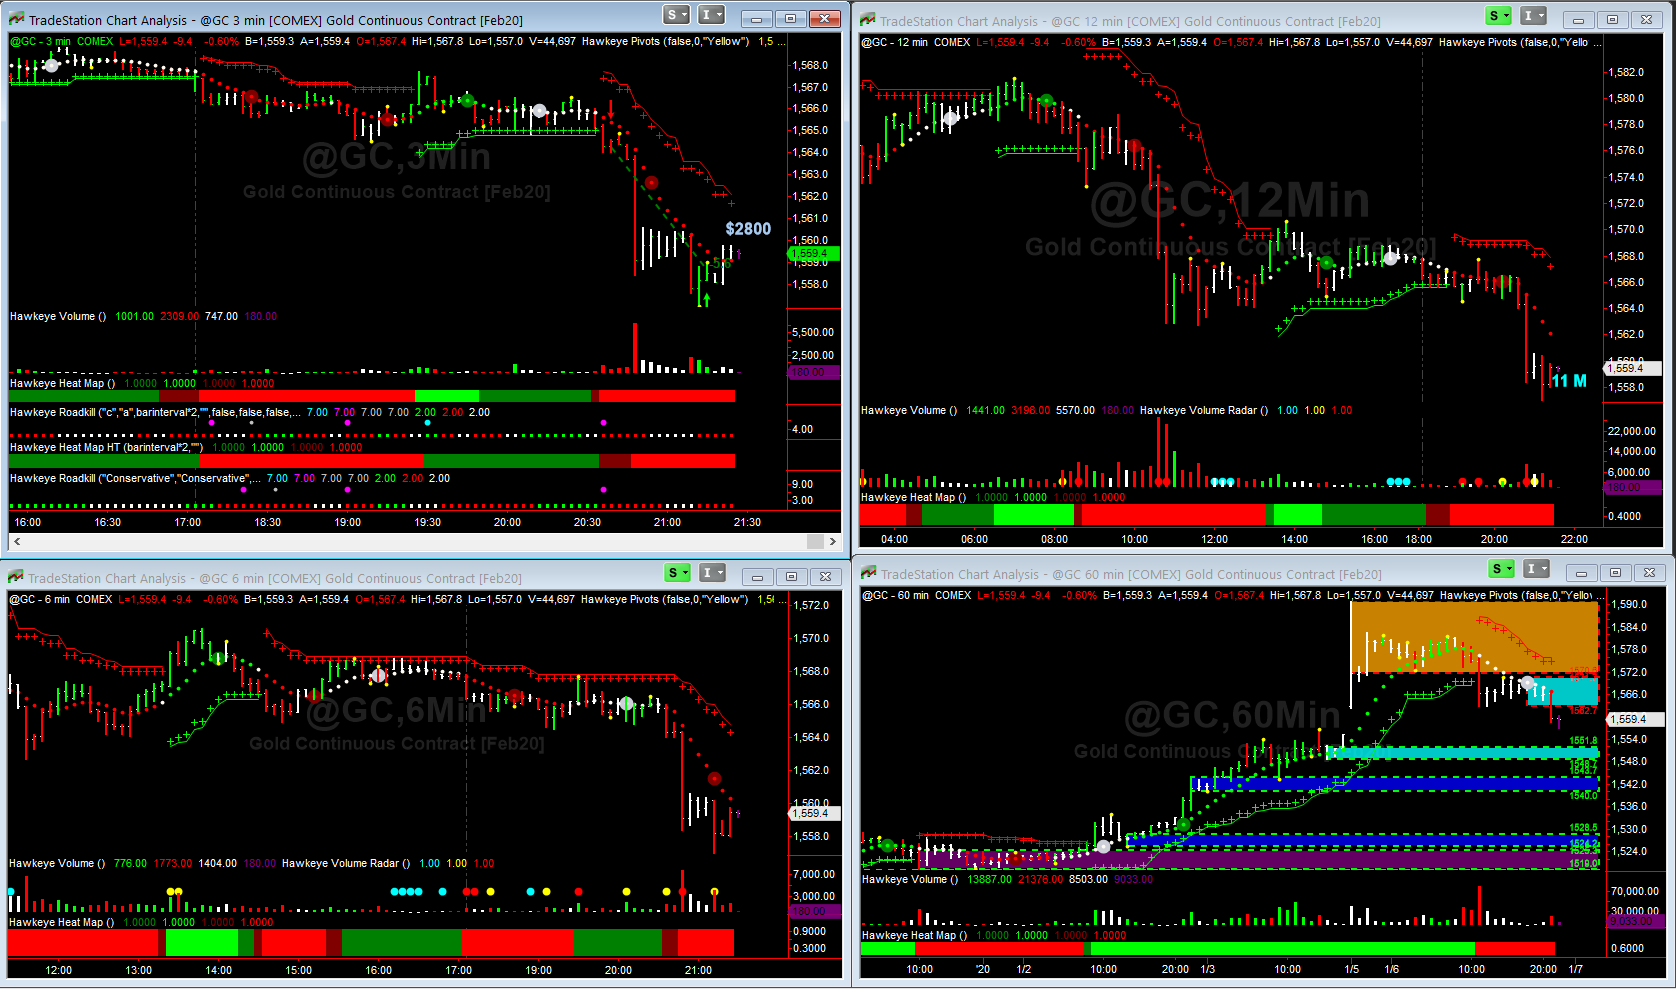
Using a 3min chart of the GC (Feb 2020), I was watching for 6min, 12min and 60min alignment and confirmation for a trade entry. The 60min chart showed the highest probability would be a short.

Once above-average selling volume started to show on the 3min chart, the breakout began. The trade was confirmed with a “double-dot” roadkill signal. This showed alignment of the longer timeframe volume and momentum.

Within 45mins, the exit volume signal fired off, and the trade ended with 5.6 gold points. 1 gold point equals $100, so that was $560 per contract traded. With 5 contracts, that equates to $2800 in 45mins. That’s just sick!

Learn this and other strategies in our upcoming live online seminar, Project V-Swarm Live 2020. Early bird registration prices end on Jan 8th, so hurry and claim your seat today before the prices go up. Here is the link for more information.

Learn to trade the Hawkeye way.

Click Here for the Free Book (The Lost Art of Volume Price Analysis)

Or for a Trial of the Hawkeye Trading Software

Join Randy in the next free LIVE Hawkeye Demonstration Room held every Wednesday at 9.30am EST US. You will learn more about volume and volume price analysis and see more examples and live trade setups. It is open to all.

Click this link for more information or to join us in class.

Would You Like to Make $614/hr?

In today’s update, I show how the Hawkeye V-Swarm system identified a $614/hr trade setup. Would you like to make $614/hr? Watch today’s video and see how it’s done.

Chart Analysis

On the 3-minute ES (e-mini S&P) futures contract, the Hawkeye V-Swarm system identified a “triple-dot” long setup just after the market open today. A “triple-dot” signal is a term we use to show when the slower timeframe trend and volume align with the faster timeframe trend and volume. These are know as “roadkill” signals, and are extremely powerful entry signals.

Usually, we see “double-dot” signals, which are strong signals. But a “triple-dot” signal following ultra-high volume is powerful! It is a beautiful sign of volume and price working together to show high probability, low risk trade entries.

Our system rules are based on following the volume. So by following our simple rules, the trade identified a 3:1, 5:1, and 7:1 reward:risk ratio trade. The trade lasted 6.25 hours and yielded $3,837… or $614/hour. Wow, how would you like to make $614/hr?

The Hawkeye Perspective

Learn to trade the Hawkeye way. I invite you to join me for 2 full days of training, where I’ll show you how. This live training event is something you don’t want to miss. It’s called Project V-Swarm Live and I would love to meet you there. Reserve your seat now before prices increase on Jan 8th.

Learn to trade the Hawkeye way.

Click Here for the Free Book (The Lost Art of Volume Price Analysis)

Or for a Trial of the Hawkeye Trading Software

Join Randy in the next free LIVE Hawkeye Demonstration Room held every Wednesday at 9.30am EST US. You will learn more about volume and volume price analysis and see more examples and live trade setups. It is open to all.

Click this link for more information or to join us in class.

Gold and Oil Prices Surge on News of Iranian Airstrikes

Gold and oil prices surge on news of Iranian airstrikes. With gold pushing up close to 6-year highs, and oil hitting close to 2-year highs, there are plenty of opportunities to profit from in these markets. In today’s video, I’ll show you how.

Gold Breakout

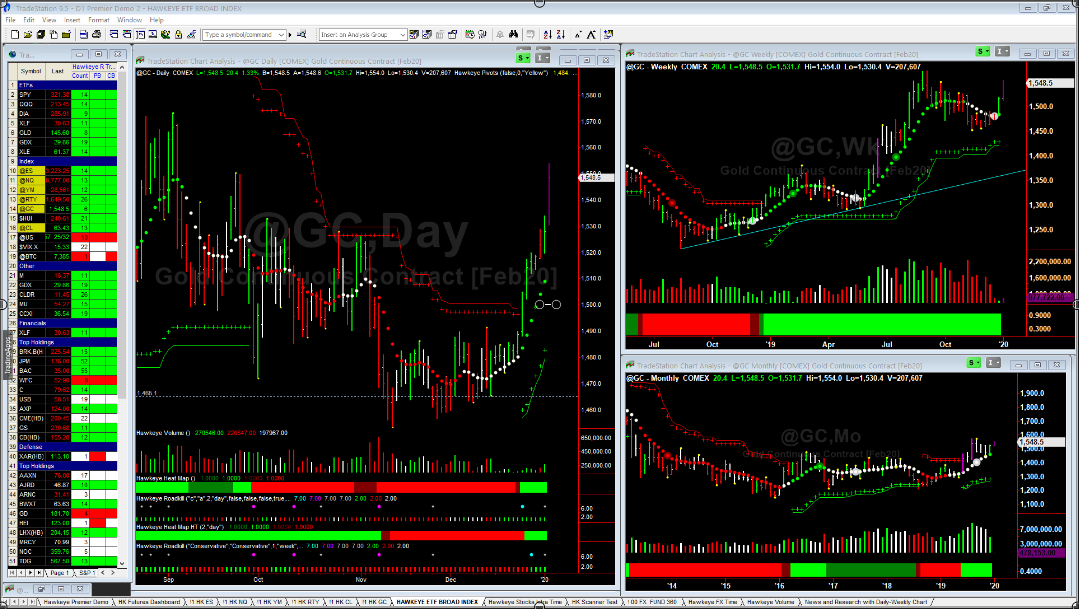
On the daily charts, gold has broken out over 20 points, hitting over $1550 in overnight trading. I show on the intraday charts how this move could have been trading using Hawkeye software and strategies.

Crude oil also broke out over $64, and is showing bullish signs of a continuation to the $75 area. Again, Hawkeye software and strategies could have show exactly how to capture this huge surge in oil prices.

How do we know when markets are about to break? I’ll show you everything in our upcoming live training event you don’t want to miss. It’s called Project V-Swarm Live and I would love to meet you there.

Learn to trade the Hawkeye way. Gold and oil prices surge.

Click Here for the Free Book (The Lost Art of Volume Price Analysis)

Or for a Trial of the Hawkeye Trading Software

Join Randy in the next free LIVE Hawkeye Demonstration Room held every Wednesday at 9.30am EST US. You will learn more about volume and volume price analysis and see more examples and live trade setups. It is open to all.

Click this link for more information or to join us in class.

Learn to trade the Hawkeye way.

Quick $520 Trade Recap

In today’s video, I show a quick $520 trade recap in the NQ. I show how I entered and exited using volume. Plus I introduce 4 new volume indicators that can help build confidence to take the trade.

The trade lasted just shy of two hours, so $520 was great. That was using our standard rule-based entry. However I show four new indicators that would help build confidence in the trade. They are the Hawkeye Cumulative, Hawkeye Viper, Hawkeye PowerCycle, and Hawkeye PowerTrend.

All four of these new volume-based indicators will be free to everyone who attends the Online Project V-Swarm Live event Feb 6-7. CLICK HERE To learn more, or to register your seat.

Learn to trade the Hawkeye way. Quick $520 trade recap.

Click Here for the Free Book (The Lost Art of Volume Price Analysis)

Or for a Trial of the Hawkeye Trading Software

Join Randy in the next free LIVE Hawkeye Demonstration Room held every Wednesday at 9.30am EST US. You will learn more about volume and volume price analysis and see more examples and live trade setups. It is open to all.

Click this link for more information or to join us in class.

Learn to trade the Hawkeye way.

All I can say is “Wow”

Wow. All I can say is Wow. The markets continue to make all-time highs, even on low volume. Of course, low volume suggests that the smart money has taken a break and gone on vacation. But that doesn’t keep us from profiting from the very nice “Santa Claus Rally”. In today’s update, I rifle through the major markets showing why.

From the Charts

All the major stock indices have posted new highs this week. The S&P, Dow, Nasdaq, and Russell. Staying with the trend and trading your rules have show good fruit I hope. I know the rules I have shared with you are really making a difference, so I hope you are learning with me. All I can say is wow.

One last note is on Gold. I pointed out several weeks ago that gold was starting to glitter again HERE. For the past two days, gold has broken out of consolidation to the upside, and all the signs of a rally are in play. Intraday traders have done well trading to the long side.

The Hawkeye Perspective

How do we know when markets are about to break? I’ll show you everything in our upcoming live training event you don’t want to miss. It’s called Project V-Swarm Live and I would love to meet you there. Here is a link for more information about the event.

Learn to trade the Hawkeye way.

Click Here for the Free Book (The Lost Art of Volume Price Analysis)

Or for a Trial of the Hawkeye Trading Software

Join Randy in the next free LIVE Hawkeye Demonstration Room held every Wednesday at 9.30am EST US. You will learn more about volume and volume price analysis and see more examples and live trade setups. It is open to all.

Click this link for more information or to join us in class.

Learn to trade the Hawkeye way.

Quick $300 Crude Oil Trade

Today, I show a quick $300 crude oil trade. The setup was clean and the trade did take longer than expected. I didn’t hit my profit targets, but trade management kept me profitable.

As shown in the video, my entry was based on a solid base of buying volume (green bottoms) coming up to my Hawkeye Roadkill entry signal. Since volume was lower than normal due to Christmas week, I quickly moved my stop to breakeven.

As the trade progressed, I saw that locking in at least a 1:1 reward:risk level was prudent. So I ended the short trade with 6 ticks ($300 on 5 contracts). $300 in one hour is not a bad wage. So come to class, and learn to trade the Hawkeye way. This quick $300 crude oil trade was just an example of the potential.

Click Here for the Free Book (The Lost Art of Volume Price Analysis)

Or for a Trial of the Hawkeye Trading Software

Join Randy in the next free LIVE Hawkeye Demonstration Room held every Wednesday at 9.30am EST US. You will learn more about volume and volume price analysis and see more examples and live trade setups. It is open to all.

Click this link for more information or to join us in class.

Learn to trade the Hawkeye way.

The Markets are Calm after Impeachment Vote

The Markets are Calm

The markets are calm after President Donald Trump’s impeachment vote was approved. In today’s update, I review all the major markets and provide the Hawkeye perspective.

The S&P 500, Dow, Nasdaq, Russell 2000, Gold, and Oil markets are all showing muted price today after the US House of Representatives voted to for impeachment. I’m not sure if this is a clear message or not, but one thing is clear: the markets don’t see anything to respond to.

I see potential for the markets to be choppy and range-bound the rest of the week. However, if volatility returns, look for strong pressure for prices to fall sharply back to the daily Hawkeye Trend dots. This would be a healthy correction for the markets anyway, and could setup a potential continuation rally into 2020. But for now, the markets are calm.

You too can learn to trade the Hawkeye way by getting your own copy of our tools during our 40% Off Black Friday sales going on right now in our Store.

Click Here for the Free Book (The Lost Art of Volume Price Analysis)

Or for a Trial of the Hawkeye Trading Software

Join Randy in the next free LIVE Hawkeye Demonstration Room held every Wednesday at 9.30am EST US. You will learn more about volume and volume price analysis and see more examples and live trade setups. It is open to all.

Click this link for more information or to join us in class.

Learn to trade the Hawkeye way.

Get Solid Base Hits with Confidence

In today’s update, I demonstrate how to get solid base hits with confidence using Hawkeye. When you see volume and price working together, you know when and how to take high probability, low risk trades. In today’s Forex example, I will show you how.

From the charts

Using multiple timeframe analysis, it’s easy to see when the faster timeframes align with the slower ones. Using Hawkeye’s powerful tools, you know ahead of time when the trades take place.

I demonstrate on 15-30-60 minute charts how price action failed to create new highs. This was the first setup. Then the Hawkeye Fatman showed when to expect a potential trend setup as energy flowed from the AUD into the CAD. Next the Hawkeye Zones showed price in a heavy selling pressure area – this is icing on the cake. Finally, after 7-15min price bars of selling pressure, we get a solid sell entry signal from the Hawkeye Trend.

The Hawkeye way

With 7 pips of risk, I showed 43 pips of reward, or almost 7:1 reward:risk ratio. The entry and exit was clear and known ahead of time. I teach this and many other methods in our live weekly training. Learn to trade the Hawkeye way.

You too can learn to trade the Hawkeye way by getting your own copy of our tools during our 40% Off Black Friday sales going on right now in our Store.

Click Here for the Free Book (The Lost Art of Volume Price Analysis)

Or for a Trial of the Hawkeye Trading Software

Join Randy in the next free LIVE Hawkeye Demonstration Room held every Wednesday at 9.30am EST US. You will learn more about volume and volume price analysis and see more examples and live trade setups. It is open to all.

Click this link for more information or to join us in class.

Learn to trade the Hawkeye way.

How to Double Your Account Every 36 Days

If you’re like most traders, you dream about hitting those “home run” trades…

You know, the ones that will bring you 100, 200, or even 500+% profit in one fell swoop.

Of course, with so many systems and algorithms being advertised as “the only system you need to rake in 1,000+%,” it’s no wonder why so many traders have these grandiose dreams.

Now, don’t get me wrong — it’s entirely possible to hit a “grand slam” trade…

Home run

But the reality is that they are few and far between.

Discover How You Can Fire Your Boss… And Make A Full-Time Living At Home With Base Hit Trades

Here’s the truth…

It’s much easier to get on base than it is to knock one out of the park…

And, in fact, by racking up smaller “base hit” wins on a more frequent basis, you can theoretically double your account in just 36 days.

Let me explain…

You see, in finance, there’s a mathematical principle called the Rule of 72.

This rule states that if you divide the number 72 by a fixed rate of annual return, you’ll find the number of years it will take to double your money.

Rule of 72 diagram

As you can see, at an annual rate of 4%, it would take you 18 years to double your money…

And while the chart doesn’t show it, an annual rate of 2% would mean you’d wait 36 years before seeing a 100% return.

But what if, instead of an ANNUAL rate of return, you were making a DAILY rate of return of just 2%…

And rolling those earnings over into the next day’s base hit win?

Can you see now how easily you could actually DOUBLE your account in a mere 36 days…

Just by making a 2% profit every day?

It may seem counterintuitive… but the numbers don’t lie.

Consistently bagging smaller gains… 2, 3, even 5%… can add up to BIG returns in a relatively short period of time.

In fact, it’s entirely possible to earn a FULL TIME living by making base hit trades from the comfort of your own home…

In less than 30 minutes per week.

So if you’re ready to learn how you can fire your boss and trade from home for a living…

Enjoying the freedom to live life on your own terms…

Then click here to get free access to our on-demand webinar.

Learn to trade the Hawkeye way.

How to Trade On the Exchange Floor Without Leaving Your House

The Secret Indicator Used On the Stock Exchange Floor Every Day

Have you ever visited a stock exchange and watched the floor traders live and in person?

Of course, ever since 9/11, that’s much easier said than done…

But if you’ve actually been there, right in the middle of the action…

You know there’s an energy on the trade floor that just can’t be felt anywhere else.

Open outcry trading

Learn How To Trade Like The Bigwigs On Wall Street

Here’s the thing…

That energy… that palpable excitement that surges through the exchange as a massive opportunity begins to break out…

THAT’S the real indicator those floor traders rely on.

Of course, most trading algorithms and indicators used by Main Street traders like us are based on price and time.

… But the truth is, neither price nor time tell the true story of what’s going on in the market, for one simple reason…

They’re based on historical data.

In other words, they’re what we call lagging indicators

And the fact is, there’s only ONE indicator that actually leads price, rather than lagging behind it.

It’s that rush of energy that erupts on the exchange floor as traders start yelling “Buy, buy, buy!” or “Sell, sell, sell!”

For decades, the only people who could use that indicator were the ones actually there, on the stock exchange floor…

But now, everyday traders like you and I can harness that powerful indicator… that invisible force that courses through the exchange like a million watts of electricity…

How, you ask?

Easy…

With the power of V-SWARM.

Testimonial

If you’re ready to learn more about V-SWARM…

The ONLY indicator that actually leads price moves instead of lagging behind them…

Then click here to join an on-demand webinar today!

Learn to trade the Hawkeye way.

I Love to Trade Crude Oil

I love to trade crude oil. And in today’s video, I’ll show you why. When you have a swarm of buyers coming in 15 minutes before your trade, it’s a compelling story to take the trade. Hawkeye tools lead the way.

I love to trade crude oil on the 3 minute chart. I show the entry just after a consolidation period and confirmed breakout, with strong volume support on multiple timeframes. This gives confidence to take the trade.

With 22 ticks of risk, I show a 3:1 reward:risk ratio and a 68 tick profit in 1 hour. I called the entry in our Inner Circle Skype Chat room at 09:04am. The trade entry signaled at 09:06am, with an exit at 10:03am. $680/contract traded. Simply following the rules. Learn to trade the Hawkeye way.

You too can learn to trade the Hawkeye way by getting your own copy of our tools during our 40% Off Black Friday sales going on right now in our Store.

Click Here for the Free Book (The Lost Art of Volume Price Analysis)

Or for a Trial of the Hawkeye Trading Software

Join Randy in the next free LIVE Hawkeye Demonstration Room held every Wednesday at 9.30am EST US. You will learn more about volume and volume price analysis and see more examples and live trade setups. It is open to all.

Click this link for more information or to join us in class.

Learn to trade the Hawkeye way.

Volatility is on the Move

Volatility is on the move. In today’s update, I want to show my expectations of where price should go, and why. When volatility spikes, markets tank. We have had extreme lows in volatility, and a short term correction was inevitable. But what else is in store?

Downward pressure

From the daily ES chart (S&P 500 e-mini), we see increasing volume and decreasing prices. Price has reached the weekly upper trendline, as shown in yesterday’s update. This should act as short-term support, as we see active demand in this area.

Also, we expect price to possibly retrace back up to the 3121 area, before continuing it’s route back down to 3031ish. This theory is supported by the upper trendline on the CBOE Volatility index ($VIX.X). Applying Hawkeye indicators to volatility has proven to be very enlightening.

The Hawkeye Perspective

With a phantom isolated high in place, we expect to see 3-5 daily price bars of correction. We also expect to see 2958 area hit IF our lower demand zone of 3020 is broken.

These charts help us to see and trade the faster intraday charts. I teach this and other strategies in our weekly training room. Please join us. Learn to trade the Hawkeye way.

You too can learn to trade the Hawkeye way by getting your own copy of our tools during our 40% Off Black Friday sales going on right now in our Store.

Click Here for the Free Book (The Lost Art of Volume Price Analysis)

Or for a Trial of the Hawkeye Trading Software

Join Randy in the next free LIVE Hawkeye Demonstration Room held every Wednesday at 9.30am EST US. You will learn more about volume and volume price analysis and see more examples and live trade setups. It is open to all.

Click this link for more information or to join us in class.

Learn to trade the Hawkeye way.

Trouble is Brewing in the Markets

Today, I want to highlight that trouble is brewing in the markets. Price working together with volume is a good indication of future price direction. Today’s video shows why I think the markets are setup for a correction.

What do the charts say

Looking at the daily and weekly charts, volume and price show an engulfing bar that takes out the previous 4 trading day’s ranges. Historically, that is a very good indicator of either a reversal, or a correction.

The daily S&P 500 e-mini futures index (ES) shows this well, as does the NQ, YM, and RTY. Volume is showing high activity in this setup, and I want to refer to a new term for this activity: “V-Swarm”. In the coming weeks, I will be referring to v-swarm as the volume action in these markets.

The Hawkeye Perspective

When you see an opposing volume price bar completely engulfing a previous day’s price range, look for a correction at least, or possibly a full reversal. Only time will tell, but now you know why. Learn to trade the Hawkeye way.

You too can learn to trade the Hawkeye way by getting your own copy of our tools during our 40% Off Black Friday sales going on right now in our Store.

Click Here for the Free Book (The Lost Art of Volume Price Analysis)

Or for a Trial of the Hawkeye Trading Software

Join Randy in the next free LIVE Hawkeye Demonstration Room held every Wednesday at 9.30am EST US. You will learn more about volume and volume price analysis and see more examples and live trade setups. It is open to all.

Click this link for more information or to join us in class.

Learn to trade the Hawkeye way.

$1,275 in 36 Minutes Following the Rules

Following the rules

Today, I show $1,275 in 36 minutes following the rules. I follow rules to enter, manage and exit the trade. Rules are what keep you safe, and help you to trade another day.

First you identify the trade using volume and price. In this example, the ES index future (Dec contract) gave a great setup trade. Our Hawkeye Roadkill indicator showed when to enter. The Hawkeye Trend+Stops indicator showed how to manage the trade. And finally, the Hawkeye Levels indicator showed where to exit (stop and profit).

Using a set risk level (in this example 4 ticks), the profits are set at 3:1, 5:1, and 7:1 reward:risk levels. The results were $375 in 15 minutes, the next $550 in 33 minutes, and the remaining $375 in 36 minutes. The grand total was $1,275 in 36 minutes, simply following the rules. Learn to trade the Hawkeye way.

You too can learn to trade the Hawkeye way by getting your own copy of our tools during our 40% Off Black Friday sales going on right now in our Store.

Click Here for the Free Book (The Lost Art of Volume Price Analysis)

Or for a Trial of the Hawkeye Trading Software

Join Randy in the next free LIVE Hawkeye Demonstration Room held every Wednesday at 9.30am EST US. You will learn more about volume and volume price analysis and see more examples and live trade setups. It is open to all.

Click this link for more information or to join us in class.

Learn to trade the Hawkeye way.

Tesla Showed 40% in 2 Months

Tesla Showed 40% in 2 Months

I brought Tesla back again because it is such a good example. Tesla showed 40% in 2 months, and I show exactly why you would see the exact same thing yourself, in today’s video.

Having the right tools…

You see, volume and price working together is the key to everything we teach at Hawkeye Traders. Couple that with our entire suite of tools, and you have a definitive entry/exit methodology that just works. Having the right set of tools and knowing how to use them can really make a difference in your trading, and in your bottom line.

Trading the right stock…

I spoke about $TSLA back in September. Even though it looked terrible, I saw potential. Volume and price were working together to show a high probability trade.

Less than a month later, our tools identified that entry point, with an alignment of multiple timeframe volume and price… a definitive entry with a predefined risk.

Next, I show how one month later, we saw a predefined exit point that existed since 2018. It was a supply zone (Hawkeye Zones) that gave the definitive exit.

The results speak clearly…

Therefore, with $14 risk (defined by Hawkeye Levels ATR), TSLA showed 40% in 2 months, and a $100 reward, or a 7:1 reward:risk ratio. Trading only 30 shares, the potential return would be over $3000. That’s what volume trading is all about.

You too can learn to trade the Hawkeye way by getting your own copy of our tools during our 40% Off Black Friday sales going on right now in our Store.

Click Here for the Free Book (The Lost Art of Volume Price Analysis)

Or for a Trial of the Hawkeye Trading Software

Join Randy in the next free LIVE Hawkeye Demonstration Room held every Wednesday at 9.30am EST US. You will learn more about volume and volume price analysis and see more examples and live trade setups. It is open to all.

Click this link for more information or to join us in class.

Learn to trade the Hawkeye way.

Quick RTY Setup Shows $775 in 30 Minutes.

I want to show you how a quick RTY setup shows $775 in 30 minutes. Of course, Volume leads the way. Hawkeye Volume signaled the trend change (reversal) one hour before the entry point. What a confidence builder!

If you understand volume and price, trading can be a lot more fun. Seeing the potential direction of price an hour before it happens is awesome for any trader. This gives you the time to think about the trade, when to enter, when to exit… all before you ever take the trade.

Coming into the close of the trading day, I like to use a 3min, 6min, and 12min setup to trade into the close. Today, the Russell (RTY) was more than happy to oblige. With a volume reversal signal, and a confirmed entry signal, 3.1 points were up for the taking. At $5/tick and $50/point, with 5 contracts, that equates to $775 in only 30 minutes.

So today, I showed you how a quick RTY setup shows $775 in 30 minutes. I showed how Hawkeye Volume signaled the trend change (reversal) one hour before the entry point, and how that would build your confidence as a trader. Learn to trade the Hawkeye way.

Click Here for the Free Book (The Lost Art of Volume Price Analysis)

Or for a Trial of the Hawkeye Trading Software

Join Randy in the next free LIVE Hawkeye Demonstration Room held every Wednesday at 9.30am EST US. You will learn more about volume and volume price analysis and see more examples and live trade setups. It is open to all.

Click this link for more information or to join us in class.

Learn to trade the Hawkeye way.

Gold Setup Showed $3900 in 1.5 Hours

gold setup showed $3900

Today, a gold setup showed $3900 in 1.5 hours. Following volume and price in the gold markets lead to a rule-based entry with confidence. I review how the expectation was known last week in a previous update.

Daily Charts…

First we review the GLD gold ETF and GDX gold miners ETF, showing the potential reversal signals were validated on the daily charts. The reversal signals at this point are more corrections, but in time, may become full reversals. Only time will tell.

The Strategy…

Based on these corrections, we began looking for intraday trades in the direction of the daily correction.

And today, we were not disappointed. The gold futures contract GC showed us a beautiful rule-based entry right at market open. The entry was lead by volume of course, and show visibly by Hawkeye Volume.

Using 5 contracts, the results were 3:1, 5:1, and 7:1 Reward:Risk levels showing $3900 in potential profits in only 1.5 hours. That’s enough to pay for your Hawkeye Professional Package plus some. Today, the gold setup showed $3900 in 1.5 hours… what will tomorrow bring?

Last chance to get a lifetime license…

Speaking of the Professional Package, our Lifetime Licenses are going away. After they are gone, we will only offer subscriptions. So for a very limited time, you can still lock in the lifetime license until we close the door forever.

Here is the link to learn more about our lifetime licenses, and your last chance to secure one before they go away: https://www.hawkeyetraders.com/traders-programs/

Click Here for the Free Book (The Lost Art of Volume Price Analysis)

Or for a Trial of the Hawkeye Trading Software

Join Randy in the next free LIVE Hawkeye Demonstration Room held every Wednesday at 9.30am EST US. You will learn more about volume and volume price analysis and see more examples and live trade setups. It is open to all.

Click this link for more information or to join us in class.

Learn to trade the Hawkeye way.

Seasonality Stock Gave 9% Base Hit

I love to trade seasonality stocks this time of year. Hawkeye provides just the right tools to help you profit from these seasonal moves. In today’s update, I show how AES Corp ($AES) (a seasonality stock) gave a nice 9% base hit in only 23 days.

Using a daily chart, I was triggered to take the trade using the Hawkeye Roadkill, which shows me when the daily aligned with the 2-day and weekly charts. Once I see the entry signal, I enter 1 position (100 shares in this example) on the open following the trigger. Using the Hawkeye Profit Accelerator (ADDS), I then know exactly when and how much to add to my position.

You see, when you add to a strong position, you have confidence it will continue to grow. You know when to get out using the Hawkeye Stops or the Hawkeye Zones. In this case, I used the Hawkeye Zones to show me when price reached resistance (the overhead supply zone).

$AES was a seasonality stock that gave a 9% base hit following proven rules and a great set of indicators. Learn to trade the Hawkeye way.

Click Here for the Free Book (The Lost Art of Volume Price Analysis)

Or for a Trial of the Hawkeye Trading Software

Join Randy in the next free LIVE Hawkeye Demonstration Room held every Wednesday at 9.30am EST US. You will learn more about volume and volume price analysis and see more examples and live trade setups. It is open to all.

Click this link for more information or to join us in class.

Learn to trade the Hawkeye way.

Gold is Starting To Glitter Again

Gold is back on my radar again, and is starting to glitter again. Today, after a long bearish trend, we saw a glimmer of bullish hope. I show you my analysis in today’s video.

The daily GLD (gold ETF) today showed a very nice bullish reversal bar. Technically, it isn’t very strong, but historically, it has proven to produce up to 4 points of correction.

In addition, the $HUI (Gold Bugs Index), which is well known as a leading gold indicator, also signaled a bullish reversal. And the GDX, gold miners ETF, like their brothers, signaled a bullish reversal bar on the daily charts.

While these might not be full blown key reversals, they do shine a bullish light on well beaten down gold market.

Gold is starting to glimmer again, and I expect to see at least 40 points of correction, and at least 3 -5 days of bullishness. Learn to trade the Hawkeye way.

Learn to trade the Hawkeye way.

Click Here for the Free Book (The Lost Art of Volume Price Analysis)

Or for a Trial of the Hawkeye Trading Software

Join Randy in the next free LIVE Hawkeye Demonstration Room held every Wednesday at 9.30am EST US. You will learn more about volume and volume price analysis and see more examples and live trade setups. It is open to all.

Click this link for more information or to join us in class.

Learn to trade the Hawkeye way.


Update: As of 11/18/2019, Gold has risen 20 points, and is continuing to show signs of bullishness. I previously posted “4” point potential profits, but it was a typo and should have read “40” point potential profits are expected.

My Favorite Way to Spot Reversals

Volume is the key to everything I do. In today’s video, I share with you my favorite way to spot reversals using volume. I think you will like it.

The example I use is $SLF, Sun Life Financial Services. Using a daily chart, I show what I call a price extension on opposing volume. What this means is price has extended into new local highs and has closed with opposing volume – that is, volume that is against the direction of the trade.

When you see this occur, there is a high probability that price will reverse. Now, it may be a small correction, or it may be a key reversal. Either way, it’s a great indication of price changing directions. That’s why it’s one of my favorite ways to spot reversals.

Learn to trade the Hawkeye way.

Click Here for the Free Book (The Lost Art of Volume Price Analysis)

Or for a Trial of the Hawkeye Trading Software

Join Randy in the next free LIVE Hawkeye Demonstration Room held every Wednesday at 9.30am EST US. You will learn more about volume and volume price analysis and see more examples and live trade setups. It is open to all.

Click this link for more information or to join us in class.

Learn to trade the Hawkeye way.

Take the Guessing Out of Trading

In today’s video update, I want to show you how to take the guessing out of trading. Using Hawkeye’s suite of powerful tools, we show definitive entries and exits. This forms the basis of building a trading plan on a solid set of rules. Today’s example is from the daily S&P 500 e-mini futures contract, ES.

Hawkeye uses trend, volume and momentum together, over multiple timeframes, to help any trader know when to make the trade. Coupled with multiple-timeframes, this provides the key element in the decision process. Gone are the days of guessing whether the trade will work or not. Take the guessing out of trading and put probabilities on your side. Stop the guessing game. Learn to trade the Hawkeye way.

Click Here for the Free Book (The Lost Art of Volume Price Analysis)

Or for a Trial of the Hawkeye Trading Software

Join Randy in the next free LIVE Hawkeye Demonstration Room held every Wednesday at 9.30am EST US. You will learn more about volume and volume price analysis and see more examples and live trade setups. It is open to all.

Click this link for more information or to join us in class.

Learn to trade the Hawkeye way.

$TSLA Gave 30% Gain

nice 30% gain in $TSLA

In a follow-up to my previous post on TSLA, I show how simple rules yielded a nice 30% gain in $TSLA. When volume and price work together, it is a powerful thing. In my previous blog, I said to watch for volume to support any move. Well, here are the results of today’s market update.

With building volume and price, TSLA gave a very nice bullish break of the congestion channel and consolidation wedge formed on the daily chart. This was confirmed with a “double-dot” Hawkeye Roadkill buy signal. Since my price target was projected at $280, a $257 entry would be a 10% target. A 5% risk would be a 2:1 ratio.

But that was not the end of the story. After earnings, $TSLA went on to beat expectations, and price drove up to $340, or about a 30% gain from the signaled entry point. With a 5% risk, that was over 5:1 reward:risk ratio.

I show these examples and historical updates to help you see that following simple rules can lead to good potentially great profits. Learn to trade the Hawkeye way.

Click Here for the Free Book (The Lost Art of Volume Price Analysis)

Or for a Trial of the Hawkeye Trading Software

Join Randy in the next free LIVE Hawkeye Demonstration Room held every Wednesday at 9.30am EST US. You will learn more about volume and volume price analysis and see more examples and live trade setups. It is open to all.

Click this link for more information or to join us in class.

Learn to trade the Hawkeye way.

Boredom is Catastrophic to Trading

By Guest Contributor, Michele Hurlbut

Hi Everyone.

The markets have been a bit schizophrenic these last few weeks. They are moving along at a snail’s pace and then they have these sudden surges of activity that subside as quickly as they come and back to snail’s pace again.

In addition to watching out for the sudden volatility, you also have to fight the boredom as boredom is catastrophic to trading.

Of all the places boredom is not welcome, trading is where it can bring the most damage. In my lifetime, I have done some really interesting things so that I wasn’t bored any more; some good, some not so good.  And when it comes to trading, some really bad……

Boredom

How does boredom show up in trading you may ask?

Have you ever been waiting for your set up and it seems to be taking forrrrrevvvver?

All of a sudden, you glance over at your email that may be open on the other screen or start ‘chatting’ with a friend or trading buddy.  Next thing you know, five minutes have done by. You look over at your trade screen and your set up has passed you by.

Then you may become ‘irritated’ (my word, you may have another.)  That ‘irritation’ may lead to revenge trading or worse, calling yourself all sorts of names that don’t help the situation. Or, maybe you’re bored and so you start looking for ANY trade you can take just to DO something. (Naw, you’ve never done that, she says tongue in cheek.)  Ok, maybe you haven’t, but I can honestly say that I have. And on more than one occasion in my trading life time.

Boredom is catastrophic to your trading because it costs you 1) Opportunity and 2) Money!

And none of us want that.

Oh, but I can watch the markets and answer emails, you say to this newsletter as you read it; I’m a good multi-tasker.  Be honest with yourself, are you really?

Fully Focused

You are the only one you have to answer to and you are also the only one that knows your reality.  Many studies have shown that, while we can multi-task and get things taken care of, we can not FULLY FOCUS on more than one task at a time. And when you are trading, you want to be FULLY FOCUSED on your trading and the gyrations of the market that make you money.

The reason I bring all this up now is because I got bored the other day while watching my charts and waiting for my 3-Step Entry to appear.  It felt like it was taking forever!!

You may remember me talking a couple blogs ago about Every day be a better version of you.  I still practice that daily, and today I identified how boredom creeps into my trading day.

So I spent some quality time watching my charts and experiencing what my body and mind want to do when it thinks I am bored.  It was quite interesting being the outside observer.

Here is what I noticed; my concentration wandered time and time again, thinking about checking my emails or Skype to see if there was someone I could talk to. I had to consciously will myself not to do those things as I know how they take my focus off the markets.

When I hear the signal set up, and I’m not fully focused, I do not take the care I need to make sure the signal is a good one to take. While software can guide us, only the human mind can see the big picture and that takes focus!

I also recognize that sometimes we have to keep our hands busy and so I came up with a few ideas:  Shell pistachios, skin soaked almonds to make your fresh almond milk, play with a slinky, squeeze a grip strengthener, play with worry balls.  Anything to mindlessly occupy your hand.

Finally…

The key word here being ‘mindless’. I am sure you can think of a few others and I hope you do.

Disclaimer, I thought about adding yoyo to the list but it is not as mindless as one would think and you have to look away from your charts to untangle the mess that was just made 🙂

I hope you discover what ‘boredom’ looks like in your trading so that it will not be catastrophic to your trading career.

Great trading everyone and speak with you again soon.


Join Randy in the next free LIVE Hawkeye Demonstration Room held every Wednesday at 9.30am EST US (next session postponed until Wednesday, November 7th). You will learn more about volume and volume price analysis and see more examples and live trade setups. It is open to all.

Click this link for more information or to join us in class.

Learn to trade the Hawkeye way.

Randy Lindsey
Hawkeye Traders, LLC

Trading the News Safely

Yesterday we had a very crude conversation about crude oil. I shared the Hawkeye Perspective on what to look for, and how to watch for the trade setup. Today, I show exactly how it played out, hitting both the upside and downside targets I gave you yesterday. Trading the news safely is possible.

Trading the News

The 3 minute price bar defines the range of the reaction of price to the news event. With patience, I show how volume led me in the direction of the trade setup, and the resulting profit potential. Again, volume shows the reversal and the market’s intent. Therefore, you can make the trade with confidence.

The Hawkeye Roadkill identified when the higher timeframes aligned with my 3 minute chart. This alignment setup, following our 3 Step Entry Method, showed how even more profits could have been made – just following the rules. As a result, confidence could be boosted, and bottom-line results increased.

In summary, the potential results could be $140 on the first trade and $440 on the 2nd for a single contract. If 3 contracts were traded, the results could be $420 on the 1st trade and $1950 on the 2nd. Learn to trade the news safely trading the Hawkeye way.

Click Here for the Free Book (The Lost Art of Volume Price Analysis)

Or for a Trial of the Hawkeye Trading Software

Join Randy in the next free LIVE Hawkeye Demonstration Room held every Wednesday at 9.30am EST US. You will learn more about volume and volume price analysis and see more examples and live trade setups. It is open to all.

Click this link for more information or to join us in class.

Learn to trade the Hawkeye way.

A Very Crude Conversation

Today, I want to have a very crude conversation with you. Uh, crude oil that is! Crude oil inventories are out today and I want to let you know the Hawkeye perspective. Here is my video update for today:

The Hawkeye Perspective

Crude oil is continuing to fall in price in recent history. Ever since the Saudi oil field attacks, the price of crude oil has steadily dropped over $10/barrel. However, I see support has formed and I am getting indications that we might see price rising on the longer term picture.

The weekly and monthly charts show a consolidation wedge formation, with crude oil prices at the bottom of the wedge. If it holds, I expect to see price “bounce” off the lower channel back up to the middle, around the $55-$56 range. The most interesting indication is the Hawkeye Fatboy. It is showing that crude is extremely oversold and starting to build strength.

On the hourly chart, I see a change of character in buying pressure (volume). The London session was very bullish for crude oil. With inventories out today, and the expectation is for a reduction in stockpiles, I look for continued bullishness in price. The Hawkeye Zones puts the price targets at $53.80 and $54.30 to the upside. Downside targets would be back to $52.50.

Yes, it was a very crude conversation, but I trust it was informative. I hope to see you in my training room today. Learn to trade the Hawkeye way.

Click Here for the Free Book (The Lost Art of Volume Price Analysis)

Or for a Trial of the Hawkeye Trading Software

Join Randy in the next free LIVE Hawkeye Demonstration Room held every Wednesday at 9.30am EST US. You will learn more about volume and volume price analysis and see more examples and live trade setups. It is open to all.

Click this link for more information or to join us in class.

Learn to trade the Hawkeye way.

One of My Favorite Trade Setups

In today’s update I share with you one of my favorite trade setups. Of course, volume leads the way, showing the market’s intent and direction ahead of time. But waiting for the trade to setup and knowing when to enter is the key. It’s called patience, and I’ll show you how we do it in today’s video.

Consolidation is the market’s way of telling you trend is about to occur. At Hawkeye, we teach how to identify consolidation. We also teach how to know when consolidation is broken, and a new trend has begun. So waiting for the trade to setup is the key to catching the trend. That’s why it’s one of my favorite trade setups.

When I see a well defined consolidation area, I know exactly how to define the breakout. Then when volume confirms the breakout, and I get confirming entry signals from my longer time frame charts, I’m free to enter the trade. I enter with confidence and with probabilities on my side.

So come to class and learn to trade the Hawkeye way.

Click Here for the Free Book (The Lost Art of Volume Price Analysis)

Or for a Free Trial of the Hawkeye Trading Software

Join Randy in the next free LIVE Hawkeye Demonstration Room held every Wednesday at 9.30am EST US. You will learn more about volume and volume price analysis and see more examples and live trade setups. It is open to all.

Click this link for more information or to join us in class.

Learn to trade the Hawkeye way.

Volatility is Back

Volatility is back. All the major markets have failed to produce new highs. With increased tension all over the world, there are definite signs that October will be a volatile month for sure. Here is my market update:

When volatility rises, markets fall… it’s the nature of the beast. Markets fail on uncertainty and chaos… trade wars, impeachment, regional instability, political crusades, manufacturing declines, etc… All of these create uncertainty in the markets, which increases volatility. Irrational exuberance sets in and people do things unexpectedly.

As a result, the markets usually fall during these times of uncertainty. In today’s update, I show how the major markets have failed to make new highs, and are starting to show downtrends. This may or may not be major moves, but one thing is for certain… October is showing all the signs of a turbulent month. Volatility is rising, and the markets are falling. Make sure you are on the right side. Learn to trade the Hawkeye way.

Click Here for the Free Book (The Lost Art of Volume Price Analysis)

Or for a Free Trial of the Hawkeye Trading Software

Join Randy in the next free LIVE Hawkeye Demonstration Room held every Wednesday at 9.30am EST US. You will learn more about volume and volume price analysis and see more examples and live trade setups. It is open to all.

Click this link for more information or to join us in class.

Learn to trade the Hawkeye way.

Crude Oil is in the News Again.
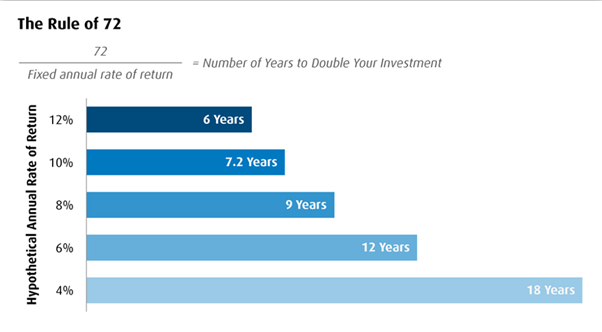
Crude oil is in the news again, with Saudi Arabia agreeing to a partial cease-fire with Yemen. Crude oil ($CL_F) responded with a 1% drop in prices. How do you view and trade this opportunity? I discuss this in today’s video update.

Using technical analysis, it’s easy to see the manipulation of price in the markets. Prior to the report, Hawkeye volume identified clear buying pressure during the London open. The intent was to bring price back to a region that is attractive to sellers, namely overhead supply. And that’s exactly what happend, as price rallied back to yesterday’s close.

Then it’s very easy to see the selling pressure put at that level. Hawkeye Volume and Hawkeye Zones working together to show the true market intent, over 2 hours in advance.

Supply regions are graphically shown using the Hawkeye Zones. I like to use it on a 60min chart, which I think acts like a “price magnet”.

Once you get a market event that produces a long-range bar (Hawkeye Widebar), we know exactly how to trade the resulting trend. Learn to trade the Hawkeye way.

Click Here for the Free Book (The Lost Art of Volume Price Analysis)

Or for a Free Trial of the Hawkeye Trading Software

Join Randy in the next free LIVE Hawkeye Demonstration Room held every Wednesday at 9.30am EST US. You will learn more about volume and volume price analysis and see more examples and live trade setups. It is open to all.

Click this link for more information or to join us in class.

Learn to trade the Hawkeye way.

[sg_popup id=13743]