A Very Crude Conversation

Join countless traders worldwide who use
the Hawkeye algorithms day in and day out to gain a powerful edge

A Very Crude Conversation

Today, I want to have a very crude conversation with you. Uh, crude oil that is! Crude oil inventories are out today and I want to let you know the Hawkeye perspective. Here is my video update for today:

The Hawkeye Perspective

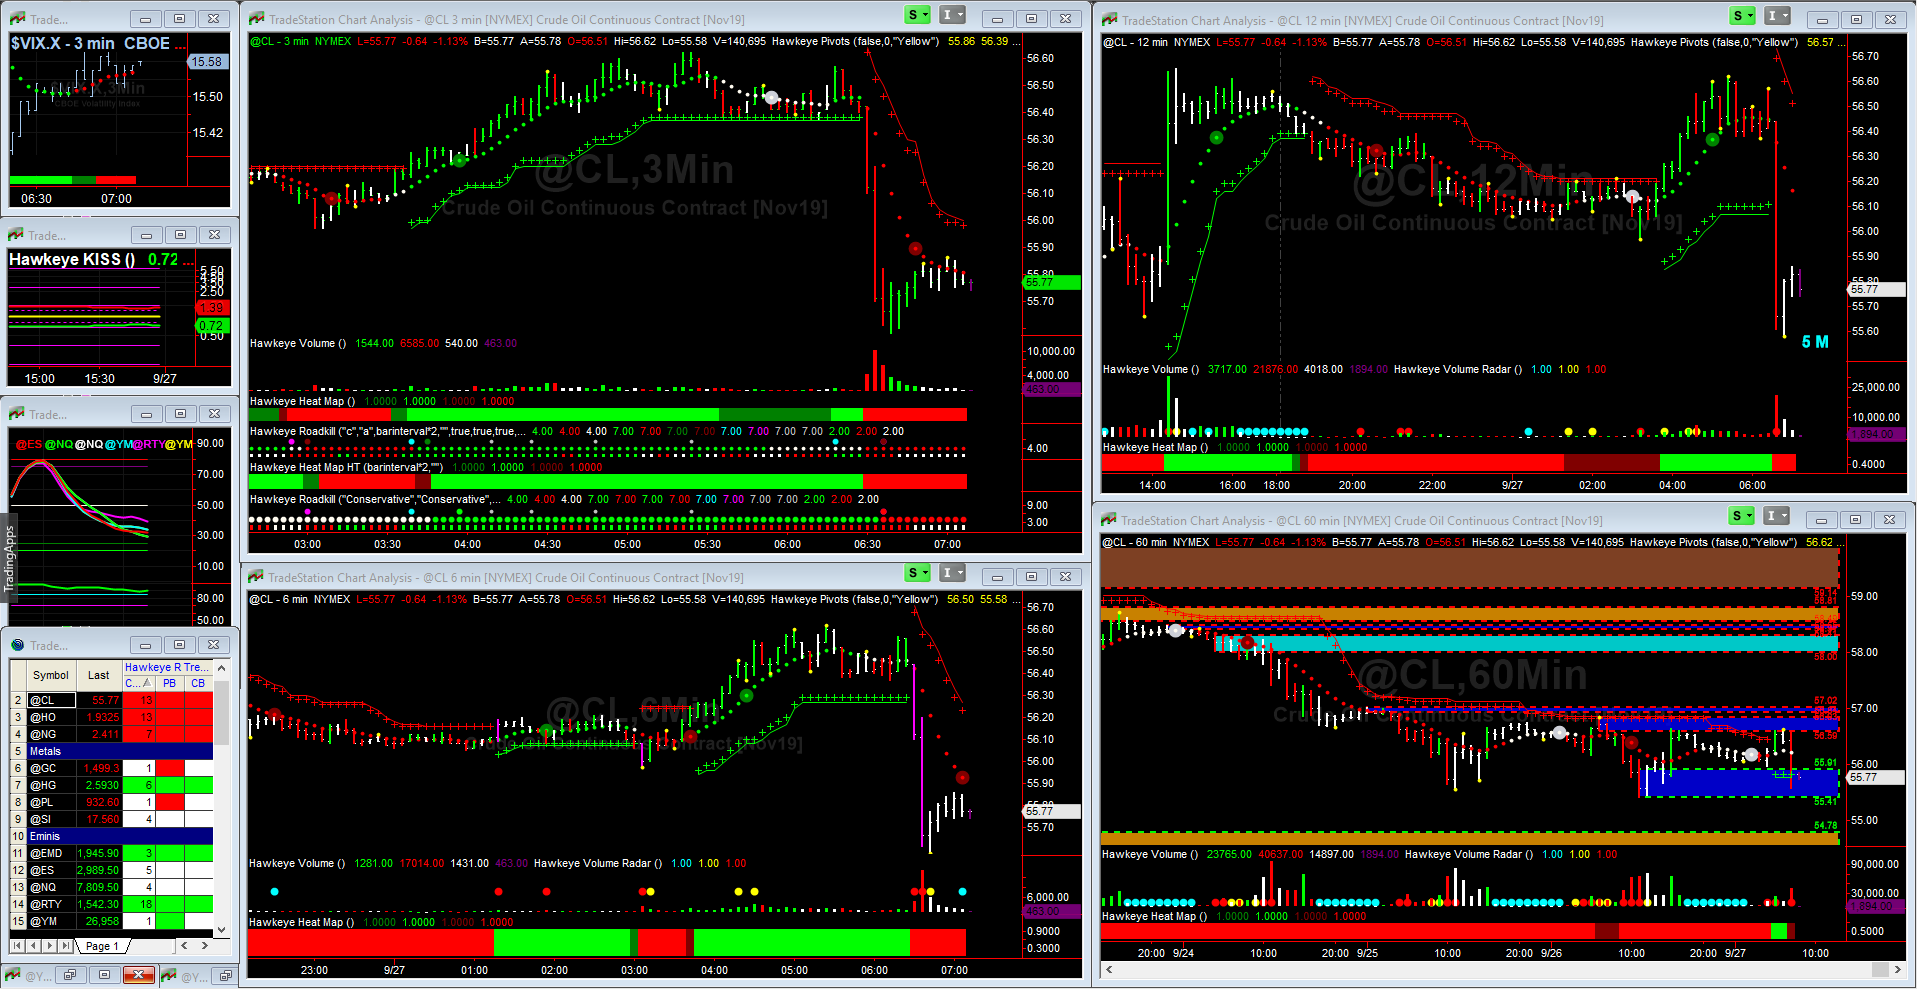
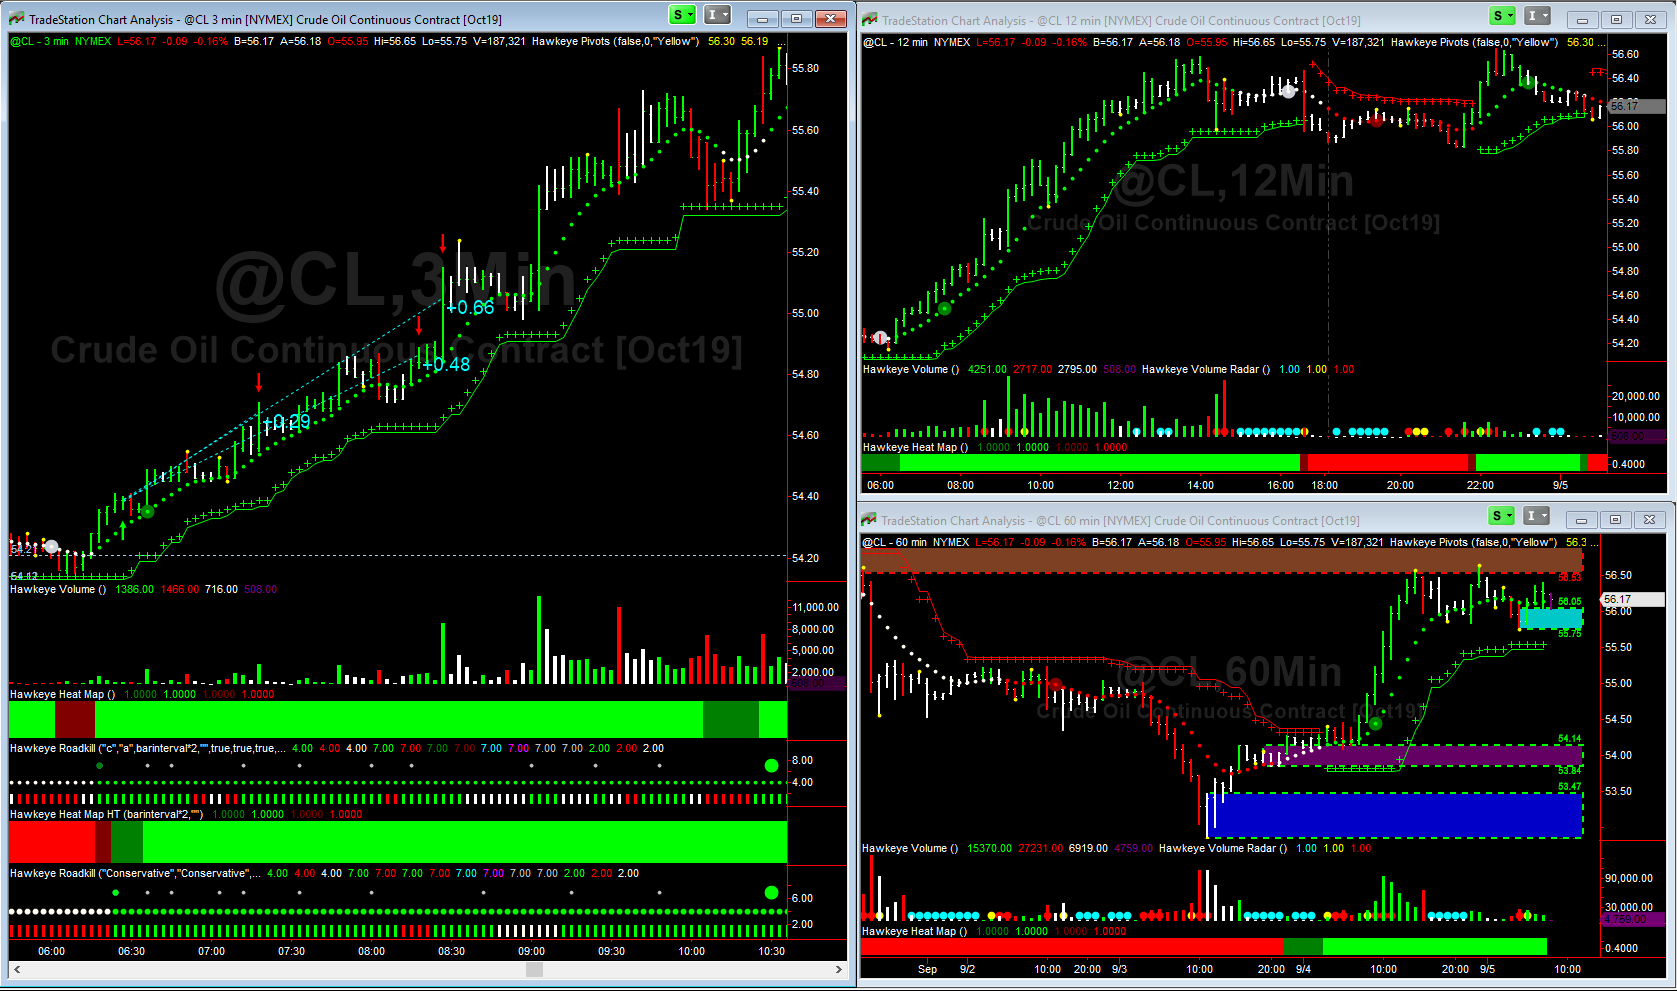
Crude oil is continuing to fall in price in recent history. Ever since the Saudi oil field attacks, the price of crude oil has steadily dropped over $10/barrel. However, I see support has formed and I am getting indications that we might see price rising on the longer term picture.

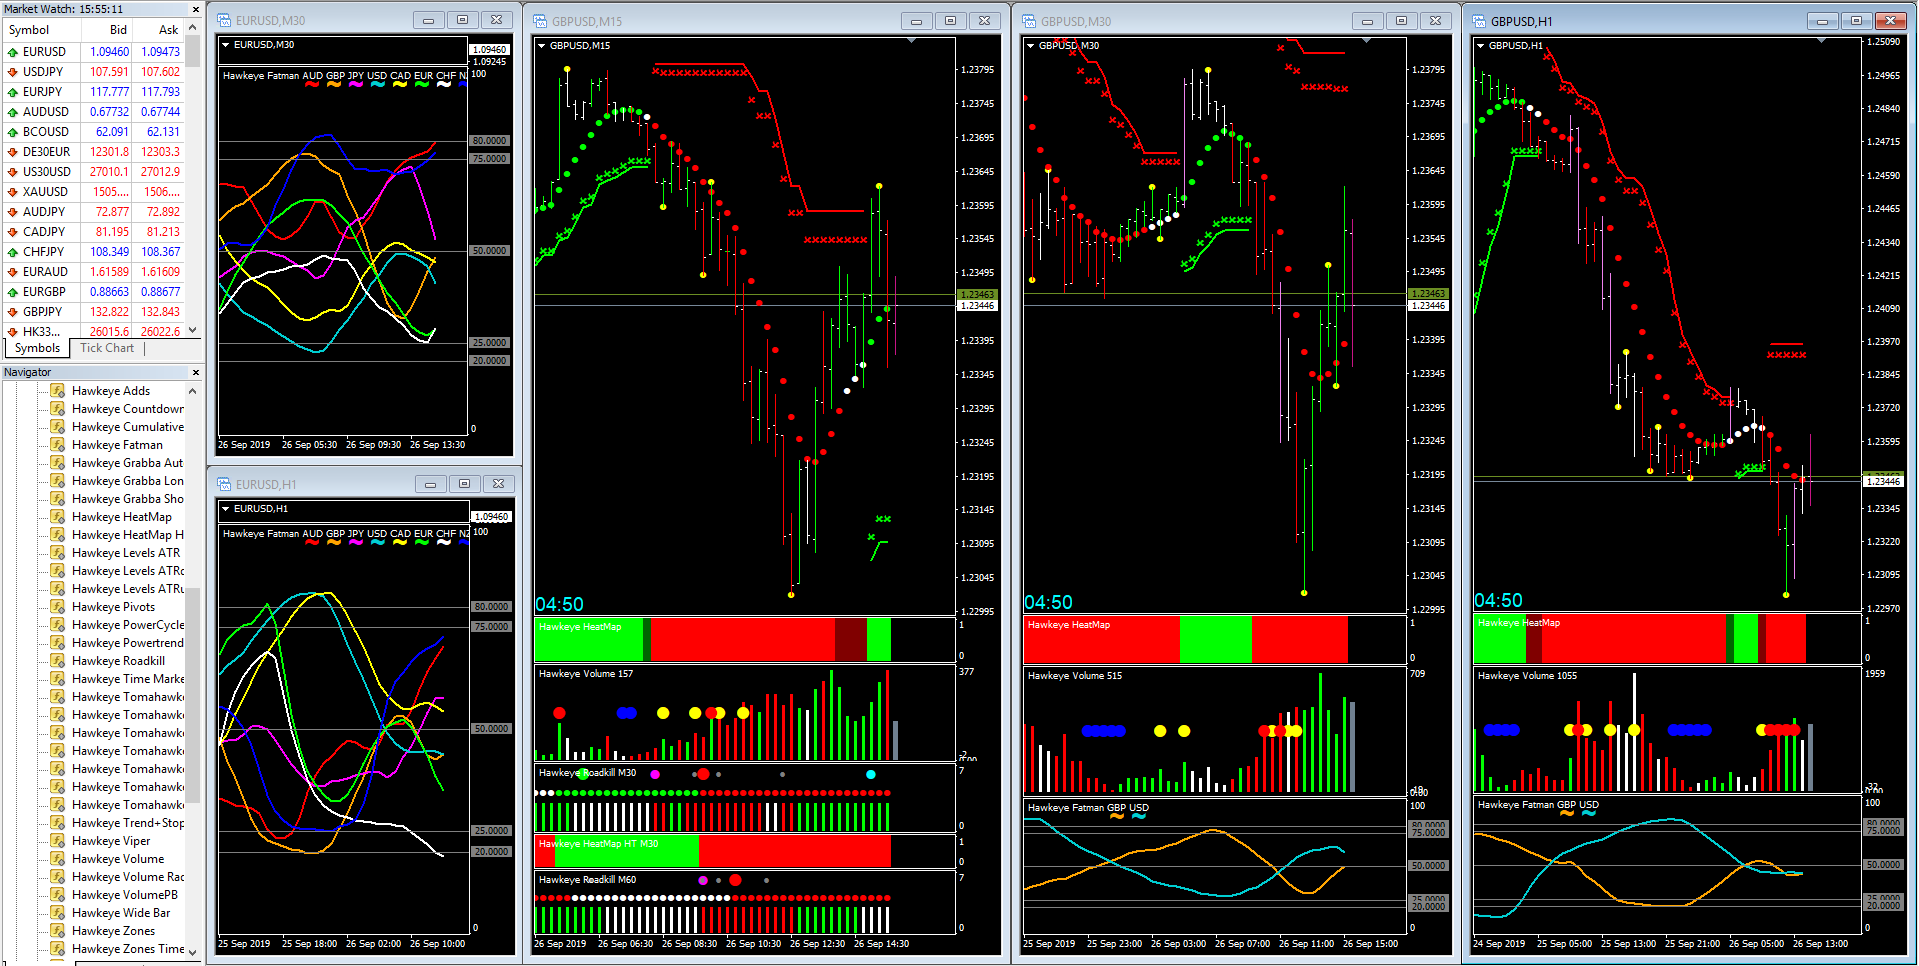
The weekly and monthly charts show a consolidation wedge formation, with crude oil prices at the bottom of the wedge. If it holds, I expect to see price “bounce” off the lower channel back up to the middle, around the $55-$56 range. The most interesting indication is the Hawkeye Fatboy. It is showing that crude is extremely oversold and starting to build strength.

On the hourly chart, I see a change of character in buying pressure (volume). The London session was very bullish for crude oil. With inventories out today, and the expectation is for a reduction in stockpiles, I look for continued bullishness in price. The Hawkeye Zones puts the price targets at $53.80 and $54.30 to the upside. Downside targets would be back to $52.50.

Yes, it was a very crude conversation, but I trust it was informative. I hope to see you in my training room today. Learn to trade the Hawkeye way.

Click Here for the Free Book (The Lost Art of Volume Price Analysis)

Or for a Trial of the Hawkeye Trading Software

Join Randy in the next free LIVE Hawkeye Demonstration Room held every Wednesday at 9.30am EST US. You will learn more about volume and volume price analysis and see more examples and live trade setups. It is open to all.

Click this link for more information or to join us in class.

Learn to trade the Hawkeye way.

One of My Favorite Trade Setups

In today’s update I share with you one of my favorite trade setups. Of course, volume leads the way, showing the market’s intent and direction ahead of time. But waiting for the trade to setup and knowing when to enter is the key. It’s called patience, and I’ll show you how we do it in today’s video.

Consolidation is the market’s way of telling you trend is about to occur. At Hawkeye, we teach how to identify consolidation. We also teach how to know when consolidation is broken, and a new trend has begun. So waiting for the trade to setup is the key to catching the trend. That’s why it’s one of my favorite trade setups.

When I see a well defined consolidation area, I know exactly how to define the breakout. Then when volume confirms the breakout, and I get confirming entry signals from my longer time frame charts, I’m free to enter the trade. I enter with confidence and with probabilities on my side.

So come to class and learn to trade the Hawkeye way.

Click Here for the Free Book (The Lost Art of Volume Price Analysis)

Or for a Free Trial of the Hawkeye Trading Software

Join Randy in the next free LIVE Hawkeye Demonstration Room held every Wednesday at 9.30am EST US. You will learn more about volume and volume price analysis and see more examples and live trade setups. It is open to all.

Click this link for more information or to join us in class.

Learn to trade the Hawkeye way.

Volatility is Back

Volatility is back. All the major markets have failed to produce new highs. With increased tension all over the world, there are definite signs that October will be a volatile month for sure. Here is my market update:

When volatility rises, markets fall… it’s the nature of the beast. Markets fail on uncertainty and chaos… trade wars, impeachment, regional instability, political crusades, manufacturing declines, etc… All of these create uncertainty in the markets, which increases volatility. Irrational exuberance sets in and people do things unexpectedly.

As a result, the markets usually fall during these times of uncertainty. In today’s update, I show how the major markets have failed to make new highs, and are starting to show downtrends. This may or may not be major moves, but one thing is for certain… October is showing all the signs of a turbulent month. Volatility is rising, and the markets are falling. Make sure you are on the right side. Learn to trade the Hawkeye way.

Click Here for the Free Book (The Lost Art of Volume Price Analysis)

Or for a Free Trial of the Hawkeye Trading Software

Join Randy in the next free LIVE Hawkeye Demonstration Room held every Wednesday at 9.30am EST US. You will learn more about volume and volume price analysis and see more examples and live trade setups. It is open to all.

Click this link for more information or to join us in class.

Learn to trade the Hawkeye way.

Crude Oil is in the News Again.

Crude oil is in the news again, with Saudi Arabia agreeing to a partial cease-fire with Yemen. Crude oil ($CL_F) responded with a 1% drop in prices. How do you view and trade this opportunity? I discuss this in today’s video update.

Using technical analysis, it’s easy to see the manipulation of price in the markets. Prior to the report, Hawkeye volume identified clear buying pressure during the London open. The intent was to bring price back to a region that is attractive to sellers, namely overhead supply. And that’s exactly what happend, as price rallied back to yesterday’s close.

Then it’s very easy to see the selling pressure put at that level. Hawkeye Volume and Hawkeye Zones working together to show the true market intent, over 2 hours in advance.

Supply regions are graphically shown using the Hawkeye Zones. I like to use it on a 60min chart, which I think acts like a “price magnet”.

Once you get a market event that produces a long-range bar (Hawkeye Widebar), we know exactly how to trade the resulting trend. Learn to trade the Hawkeye way.

Click Here for the Free Book (The Lost Art of Volume Price Analysis)

Or for a Free Trial of the Hawkeye Trading Software

Join Randy in the next free LIVE Hawkeye Demonstration Room held every Wednesday at 9.30am EST US. You will learn more about volume and volume price analysis and see more examples and live trade setups. It is open to all.

Click this link for more information or to join us in class.

Learn to trade the Hawkeye way.

Volume in Forex – Seriously?

volume in forex

Today I want to speak about volume, specifically in the Forex market. In Forex, many people say there is no volume, or that volume is useless. I say that if you ignore volume, you are at a grave disadvantage. I show you why in today’s video update.

The Forex Volume Problem
In the spot Forex market, there is no central exchange. Therefore, there is no way to count the number or size of contracts/lots traded at any given time. So, to measure Forex volume, we use tick count (the number of ticks or change in price).

Hawkeye Volume is an indicator that calculates and displays volume based on the principle of Volume Price Analysis. In Forex, we use tick count to approximate volume. This is where Hawkeye is unique, and gives you the edge. We use a complicated algorithm that calculates (with ~80% accuracy) whether there is buying or selling pressure.

Are you a Forex trader? Therefore, if you aren’t trading with volume, you are at a great disadvantage. Learn today to trade the Hawkeye way.

Click Here for the Free Book (The Lost Art of Volume Price Analysis)

Or for a Free Trial of the Hawkeye Trading Software

Join Randy in the next free LIVE Hawkeye Demonstration Room held every Wednesday at 9.30am EST US. You will learn more about volume and volume price analysis and see more examples and live trade setups. It is open to all.

Click this link for more information or to join us in class.

Learn to trade the Hawkeye way.

Tesla $TSLA is on my Radar

Tesla is on my radar

Tesla $TSLA is on my radar. In my video update, I show my reasons why I’m watching this visionary car manufacturer. The fundamentals aren’t so good. The technicals aren’t so good either. But volume and supply/demand zones are showing me a different perspective. That’s why Tesla is on my radar, but not in my account yet.

Fundamentally, $TSLA still has negative earnings and a lot of debt. However, it does produce one of the safest electric vehicles on the planet. Recent news about their SolarCity acquisition have caused the stock to drop quickly… not so good.

Technically, $TSLA is on a monthly downtrend with a target at the $156 Hawkeye Zone. The weekly charts shows it in a tight consolidation range (congestion) between $250 and $212. On the daily chart, we see a congested uptrend that will become a congested downtrend today.

$TSLA is now at technical support ($223). If this price breaks below and closes on a daily chart, I’m looking for $212 as a target. If it holds $223, and with good earnings on Oct 25th, I’m looking for $TSLA to break the $266 highs and target $280. Of course, volume must support this, and it’s easy to see with Hawkeye Volume.

Click Here for the Free Book (The Lost Art of Volume Price Analysis)

Or for a Free Trial of the Hawkeye Trading Software

Join Randy in the next free LIVE Hawkeye Demonstration Room held every Wednesday at 9.30am EST US. You will learn more about volume and volume price analysis and see more examples and live trade setups. It is open to all.

Click this link for more information or to join us in class.

Learn to trade the Hawkeye way.

The Markets are Losing Steam

In today’s update, I look at the overall market in terms of futures, showing that the markets are losing steam. All the signs of short-term weakness are here. Watch my analysis from a Hawkeye Perspective in today’s video.

Using daily charts, and a daily Hawkeye Fatboy, I can easily see the relative strength of the market. While the major US markets are strong, they are overbought, and now showing signs of potential weak trends.

The decorrelated markets are Crude oil and Gold. Crude is continuing a choppy trend of strength. All indications are for this to continue. Gold was oversold, but is now in a trend of strength. Buying volume is in support of higher prices in gold.

Overall, the markets are losing steam and showing signs of short-term correction in price. Knowing the longer trend helps us to know how to trade the intraday trends. Learn to trade the Hawkeye way.

Click Here for the Free Book (The Lost Art of Volume Price Analysis)

Join Randy in the next free LIVE Hawkeye Demonstration Room held every Wednesday at 9.30am EST US. You will learn more about volume and volume price analysis and see more examples and live trade setups. It is open to all.

Click this link for more information or to join us in class.

Learn to trade the Hawkeye way.

False Breakouts

False breakout illustration

By Guest Contributor, Michele Hurlbut

Hi Everyone.

A Day Full of False Breakouts

I hope the week is finding your trading going well. 

Today was an interesting day in the markets. What made it so interesting you may ask… 

It turned out to be full of false breakouts. 

I did my morning trading routine starting with looking at my higher time frame charts and noticed the YM (12-19) contract was moving back and forth between two 60 minute zones.

Trade Chart 1

Determining Direction

Today was Friday and it was also contract rollover time so I was not surprised by the range. But which way was it going to break? I had no way of knowing…

As the markets opened, I watched volume and price action just like the Trade Plan says. Watching for the Hawkeye indicators to line up and give me a signal per my rules.

After some time, the market gave what some would think was an indication that it had picked a direction to the downside based on a breakout of the opening range.

Well, the Hawkeye indicators told me to hold off and wait.

Hawkeye Volume

Avoiding a False Breakout

Hawkeye showed a signal on one time frame but the volume on the second time frame indicated that this move may not advance further.  And, as you can see by the following price action, it didn’t.

It was a false breakout that did not get me!

This day ended up being a range day in the YM market with only false breakouts at both sides of the range.  Following my plan and the Hawkeye 3-Step Entry criteria, I stayed safe.

It was a slow day but I got to keep my money by following my rules.

I hope you did too.

Great trading everyone and speak with you again soon.


Join Randy in the next free LIVE Hawkeye Demonstration Room held every Wednesday at 9.30am EST US. You will learn more about volume and volume price analysis and see more examples and live trade setups. It is open to all.

Click this link for more information or to join us in class.

Learn to trade the Hawkeye way.

Randy Lindsey
Hawkeye Traders, LLC

The Word for Today is Caution

word for today is caution

Today is FOMC day, so the word for today is Caution. FOMC day is when the Fed Funds Rate is released. This report usually brings a lot of market volatility, especially if changes in the interest rates are expected. We are expecting a reduction of the interest rates by 0.25%, down to 2.00%.

Usually on FOMC day, the markets tend to be range-bound and choppy. Volatility also increases in anticipation of the report.

So the word for today is Caution. If you trade, take profits quickly, and don’t trade just prior to the news. Wait for the trend that comes AFTER the announcement. That is where the real trade begins.

I like to trade 3 minute charts to see the results of news. This way, I can identify and react to the trend that forms based on the news results. Patience is the key, especially when big news events make volatility spike. Learn to trade the Hawkeye way.

Click Here for the Free Book (The Lost Art of Volume Price Analysis)

Or for a Free Trial of the Hawkeye Trading Software

Join Randy in the next free LIVE Hawkeye Demonstration Room held every Wednesday at 9.30am EST US. You will learn more about volume and volume price analysis and see more examples and live trade setups. It is open to all.

Click this link for more information or to join us in class.

Learn to trade the Hawkeye way.

Where can crude oil prices go?

With the Saudi drone strikes behind us, where can crude oil prices go next? And what other markets could the spike in oil prices influence? I delve into these and other questions in today’s Hawkeye update.

Crude oil has spiked up to the first resistance zone around $63-$64, which has contained the initial reaction to the weekend news event. Both Saudi and US officials said they will open strategic oil reserves to fill the supply gap, hoping to curb the rising price of oil. Saudi officials report that the production should be back online within 48 hours.

So the potential for oil to continue to rise, in my opinion, is good. I show two previous highs that mark potential targets for higher oil prices: $67 from the April 2019 high, and $78 from the October 2018 high.

Other implications can be found in the Defense and Energy sector ETFs. The ones I noted are $XAR (SPDR S&P Aerospace & Defense) and $XLE (SPDR S&P Select Energy). I also see intraday potential in leveraged ETFs, like OILU (ProShs UltraPro 3x Crude Oil) and OILD (ProShs UltraPro 3x Shrt Crude).

Click Here for the Free Book (The Lost Art of Volume Price Analysis)

Or for a Free Trial of the Hawkeye Trading Software

Join Randy in the next free LIVE Hawkeye Demonstration Room held every Wednesday at 9.30am EST US. You will learn more about volume and volume price analysis and see more examples and live trade setups. It is open to all.

Click this link for more information or to join us in class.

Learn to trade the Hawkeye way.

Saudi Attack Brings Uncertainty in Crude Prices

The recent attack on the Saudi oil production facilities in Abqaiq and Khurais caused the price of Crude Oil (@CL) to spike. Rising up to 18%, CL prices have broken out of daily consolidation, into overhead supply. This Saudi attack brings uncertainty in crude prices, and I share my analysis in today’s update.

While the daily price has broken our consolidation range, the weekly price has also broken it’s consolidation triangle. This was the bullish move we expected from CL, but definitely not the reason behind it.

It’s difficult to trade when global economic events occur, causing volatility to spike and prices to rise. But with the right training in risk management, you minimize any risk potential and are always ready for unintended consequences.

The potential consequences to this sudden move in oil will be noticeable. Look for oil exporting nations to benefit (CAD) and for oil importing nations to suffer (EUR). Risk-off currencies like USD and JPY will benefit while AUD and NZD would suffer.

Bottom line, the price of Crude will probably stay higher, and continue to increase if the break of supply isn’t fixed soon. This Saudi attack brings uncertainty in crude prices, that’s for sure. But if you know how to manage risk, you know how to trade. Learn to trade the Hawkeye way.

Click Here for the Free Book (The Lost Art of Volume Price Analysis)

Or for a Free Trial of the Hawkeye Trading Software

Join Randy in the next free LIVE Hawkeye Demonstration Room held every Wednesday at 9.30am EST US. You will learn more about volume and volume price analysis and see more examples and live trade setups. It is open to all.

Click this link for more information or to join us in class.

Learn to trade the Hawkeye way.

$OSTK is on My Radar!

Overstock $OSTK is officially on my radar. Today, I came across a post on StockTwits about this renegade company. So I pulled up my Hawkeye charts to see what all the talk was about. I like what I found. Here are the details in today’s update.

Looking at the longer term charts gives me a very good picture of where a stock is at. I like to use the daily, weekly, and monthly charts.

The monthly chart shows a congested downtrend. The weekly chart shows a congested uptrend with signs that today, it will break from that congestion and be in full uptrend. While the daily chart is in full uptrend, it has not given me any signals yet to get on board.

Therefore, Overstock $OSTK is on my radar. I will be watching this former “high-flyer” as it looks to be gaining momentum. Learn to trade the Hawkeye Way.

Click Here for the Free Book (The Lost Art of Volume Price Analysis)

Or for a Free Trial of the Hawkeye Trading Software

Join Randy in the next free LIVE Hawkeye Demonstration Room held every Wednesday at 9.30am EST US. You will learn more about volume and volume price analysis and see more examples and live trade setups. It is open to all.

Click this link for more information or to join us in class.

Learn to trade the Hawkeye way.

UPDATE: As of 18 Sep 2019, $OSTK not only failed to generate an entry signal, it has all but failed… period! It looked good at first glance, but volume on triple-timeframes kept me out of the trade, and in the safety zone!

Crude Oil is Getting Ready for a Big Move

I’ve been watching crude oil for a while now. Today I see signs that crude oil is getting ready for a big move, and I wanted to point it out to you.

On a daily chart, crude oil has been in consolidation for a while. Shown by a series of descending highs and ascending lows, its forming a nice pennant flag. The energy is building as the price “coils up” inside the flag region, setting the stage for the next big move.

The Hawkeye Perspective
According to the 6 Ways teaching we give our students, I identified a bullish break of consolidation. While this technically is called a trend run, crude price still needs to break the Hawkeye stops in order for us to confirm the up trend.

Finally, volume has to be present to support the move. Right now, we see above average buying volume on the daily, and declining selling volume on the weekly. This weekly selling pressure is not producing lower lows in price, which actually is a bullish sign.

Based on this and our Zones indicator, we expect to see a potential move of crude oil back up to 60, 63 or even 74 in time. Learn to trade the Hawkeye way.

Click Here for the Free Book (The Lost Art of Volume Price Analysis)

Or for a Free Trial of the Hawkeye Trading Software

Join Randy in the next free LIVE Hawkeye Demonstration Room held every Wednesday at 9.30am EST US. You will learn more about volume and volume price analysis and see more examples and live trade setups. It is open to all.

Click this link for more information or to join us in class.

Learn to trade the Hawkeye way.

Know When Not to Trade

Know when not to trade

Sometimes you need to know when not to trade. Hawkeye identifies this very clearly using multiple timeframes. I illustrate it for you in today’s market update.

The Hawkeye Perspective
Using the daily, weekly, and monthly charts, Hawkeye Trend shows that all three charts are trend neutral. The monthly chart is in a neutral uptrend, the weekly chart is in a neutral congested downtrend, and the daily chart is in a neutral downtrend. When the trend is neutral, it is a good sign of choppy range-bound trading.

Therefore, it’s good to know when not to trade. Trading during congestion results in weak trends, and choppy price action. It kills trend trading strategies. The Hawkeye Trend was designed to keep you safe, and help identify weak, neutral trends. Learn to trade the Hawkeye way.

Click Here for the Free Book (The Lost Art of Volume Price Analysis)

Or for a Free Trial of the Hawkeye Trading Software

Join Randy in the next free LIVE Hawkeye Demonstration Room held every Wednesday at 9.30am EST US. You will learn more about volume and volume price analysis and see more examples and live trade setups. It is open to all.

Click this link for more information or to join us in class.

Learn to trade the Hawkeye way.

This CL Trade Didn’t Disappoint – CL Continuation Trade

In yesterday’s update, I showed a nice setup trade in CL and said there was more to come. Well, this CL trade didn’t disappoint. It went on to produce $1,430. But that wasn’t the end. Watch today’s update to see where it went.

Following my Hawkeye rules, the trade setup showed a clear entry and multiple exits. I showed in yesterday’s video the 1st exit: $290 in 45 minutes. It went on and produced another $480 in the next hour, and then $660 in the next 10 mins.

I could not stick with the trade, as I had to prepare for a live webinar. However, when I said it had a lot more to give, it had A LOT more to give.

I shared in the Hawkeye Chat Room this text: “CL is continuing to break long… my target is 56.40”. This target was based on the Hawkeye Zones, a dynamic supply/demand zone indicator. And the final stopping point of CL was right at that Zone!

So when I said there was more profit to come, CL delivered. It went up another $1.50, which equates to $1,500/contract. This CL trade didn’t disappoint. Learn to trade the Hawkeye way.

Click Here for the Free Book (The Lost Art of Volume Price Analysis)

Or for a Free Trial of the Hawkeye Trading Software

Join Randy in the next free LIVE Hawkeye Demonstration Room held every Wednesday at 9.30am EST US. You will learn more about volume and volume price analysis and see more examples and live trade setups. It is open to all.

Click this link for more information or to join us in class.

Learn to trade the Hawkeye way.

Trade Multiple Timeframes with Safety

Learn to trade multiple timeframes with safety. Hawkeye teaches how to trade volume and price using triple timeframes. Even when our signals are not perfectly aligned, we still can find great trade setups with confidence. Watch how I identified this Crude Oil setup in today’s video update.

In trading, patience is the key. When you see the faster timeframes setup, you MUST wait for the slower timeframes to align. It just keeps you safe, and out of the chop and noise. Therefore, if you practice patience, you reap the rewards.

By waiting for the proper time to enter, I show the 1st potential target of $0.29 was achieved. This equates to $290/contract, in about 45 minutes time. Plus, there is the potential for more to come by holding the trend. You can trade multiple timeframes with safety if you learn to trade the Hawkeye Way.

Click Here for the Free Book (The Lost Art of Volume Price Analysis)

Or for a Free Trial of the Hawkeye Trading Software

Join Randy in the next free LIVE Hawkeye Demonstration Room held every Wednesday at 9.30am EST US. You will learn more about volume and volume price analysis and see more examples and live trade setups. It is open to all.

Click this link for more information or to join us in class.

Learn to trade the Hawkeye way.

Hawkeye is Bullish on Twitter

Hawkeye is bullish on Twitter, symbol TWTR. Our Roadkill indicator signaled an entry for TWTR last week, but it was in congestion. As a result, we could not enter the trade. But if we get positive price action today, the setup could yield a nice entry point. Watch today’s analysis for more details.

TWTR Analysis
Using triple timeframes, you get a real sense of confidence when you see a trade setup. I show TWTR has a monthly uptrend, a weekly uptrend, and a daily congested uptrend. The weekly chart also shows a really nice cup-and-handle formation which is also a bullish indication.

Volume
Hawkeye volume shows very good accumulation and buying pressure on the monthly and weekly charts. Daily chart volume is not so good, but the volume is OK. If TWTR breaks above 42.69 on good volume, we anticipate price to move back up to the $47 range, with a stop at $41.29. That would give a risk:reward of 1:3, and a potential return of about 10%.

It doesn’t take long to become a Hawkeye Trader. Learn today to trade the Hawkeye way.

Click Here for the Free Book (The Lost Art of Volume Price Analysis)

Or for a Free Trial of the Hawkeye Trading Software

Join Randy in the next free LIVE Hawkeye Demonstration Room held every Wednesday at 9.30am EST US. You will learn more about volume and volume price analysis and see more examples and live trade setups. It is open to all.

Click this link for more information or to join us in class.

Learn to trade the Hawkeye way.

Killer Crude Oil Setup

Today I want to show you a killer crude oil setup that occurred live. Using supply and demand as targets, Hawkeye knows when to look for trades, and which direction to trade them.

In today’s video, I show the setup and trade results possible to anyone using these killer indicators.

You see, Hawkeye is designed with traders in mind. The Hawkeye Zones show active supply and demand zones and they draw automatically on any chart. Hawkeye Widebar gives us rules to trade by that help to keep us safe. Our Hawkeye Trend and Volume show us the direction of the trade and when to enter. Finally the Hawkeye Levels ATR shows us the risk we take, and the profit targets where we exit.

Hawkeye is a complete packge that helps to keep you safe in volatile markets. As a result, you can learn to trade with confidence and precision, regardless of the market you trade – futures, stocks, Forex, cryptos, options, or commodities. Learn today to trade the Hawkeye way.

Click Here for the Free Book (The Lost Art of Volume Price Analysis)

Or for a Free Trial of the Hawkeye Trading Software

Join Randy in the next free LIVE Hawkeye Demonstration Room held every Wednesday at 9.30am EST US. You will learn more about volume and volume price analysis and see more examples and live trade setups. It is open to all.

Click this link for more information or to join us in class.

Learn to trade the Hawkeye way.

Correlation Trade Setup – $1800 in One Hour

Correlation Trade Setup

Hawkeye Fatboy identified a correlation trade setup in the futures markets. This setup resulted in over $1800 in only one hour.

You see, when you identify correlated markets, you can take advantage of the price action in multiple markets at the same time. As a result, you can double or triple your what you normally trade, without being overly complicated.

You can directly measure the energy flow of a market using the Hawkeye Fatboy. It identifies overbought/oversold conditions, in addition to when markets are correlated or not. As a result, you get a very good measure of the market’s intent.

I share this strategy and results in the video update for today. This correlation trade setup is a really great tool if you can identify and act on it. Learn today to trade the Hawkeye way!

Click Here for the Free Book (The Lost Art of Volume Price Analysis)

Or for a Free Trial of the Hawkeye Trading Software

Join Randy in the next free LIVE Hawkeye Demonstration Room held every Wednesday at 9.30am EST US. You will learn more about volume and volume price analysis and see more examples and live trade setups. It is open to all.

Click this link for more information or to join us in class.

Learn to trade the Hawkeye way.

Hawkeye is Bullish on ROKU – Find Out Why

Hawkeye is bullish on ROKU

Hawkeye is bullish on ROKU. Finding bullish or bearish stocks is really easy to do in hindsight. But let me show you how I not only identify great trade setups, but how I manage the trade and build into my position.

Using daily, weekly, and monthly charts, I scan the universe of stocks that meet my criteria for size, price and technicals. I follow the Hawkeye 3-Step Entry/Exit Method to make my selection. Then I apply our Profit Accelerator to build the position at key points in the trade.

Hawkeye uses Volume Price Analysis to show the best setups and how to manage the trades, including exits. You too can identify and say Hawkeye is bullish on ROKU. Learn today how to trade the Hawkeye way!

Click Here for the Free Book (The Lost Art of Volume Price Analysis)

Or for a Free Trial of the Hawkeye Trading Software

Join Randy in the next free LIVE Hawkeye Demonstration Room held every Wednesday at 9.30am EST US. You will learn more about volume and volume price analysis and see more examples and live trade setups. It is open to all.

Click this link for more information or to join us in class.

Learn to trade the Hawkeye way.

Follow up: On September 9th, 2019, ROKU posted an engulfing bearish reversal sell signal (price extension on opposing volume). This is an excellent indication to exit the trade and bank your profits.

Trade ETFs with Confidence – The Hawkeye Way

Trade ETFs with Confidence

Anyone can trade ETFs with confidence. In today’s update, I’ll show you how I use two different stock ETFs to always find a bullish trend in the markets. This is very helpful if you can only trade long, especially in an IRA.

In this video, I show how I use my Hawkeye software to identify bullish trends, whether the overall markets are going up or down. I perform the analysis on two stock ETFs: TNA (Small Cap Bullish 3x) and TZA (Small Cap Bearish 3x). These are leveraged ETFs, so I only trade these intraday, and never hold overnight.

The idea is to identify the overall market direction. If it is bullish, I trade the TNA; if it is bearish, I trade the TZA. Analysing the price and volume using Hawkeye gives me the confidence I need to take the trades to their logical conclusion.

You too can trade ETFs with confidence if you learn to trade the Hawkeye way.

Click Here for the Free Book (The Lost Art of Volume Price Analysis)

Or for a Free Trial of the Hawkeye Trading Software

Join Randy in the next free LIVE Hawkeye Demonstration Room held every Wednesday at 9.30am EST US. You will learn more about volume and volume price analysis and see more examples and live trade setups. It is open to all.

Click this link for more information or to join us in class.

Learn to trade the Hawkeye way.

Volume in Forex Gives You the Edge

volume in Forex gives you the edge

Many people say there is no volume in the Forex market. Hawkeye uses the volume available in the Forex market and shows how volume in Forex gives you the edge. If you trade Forex without volume, you are at a great disadvantage, and are missing out on many trade opportunities.

Volume is the fuel that drives the markets… without it, the markets would be stagnant. But when you identify volume and price working together, you have the key to knowing market direction and intent. While it is true that there is no single source of volume for the trillion dollar Forex market, there is local volume available that can be exploited. Hawkeye uses this available volume, in the form of tick count, and performs the same Volume Price Analysis as if it were true volume. The results are stellar!

Volume in Forex gives you the edge. Come to class and learn more about trading the markets using volume.

Click Here for the Free Book (The Lost Art of Volume Price Analysis)

Or for a Free Trial of the Hawkeye Trading Software

Join Randy in the next free LIVE Hawkeye Demonstration Room held every Wednesday at 9.30am EST US. You will learn more about volume and volume price analysis and see more examples and live trade setups. It is open to all.

Click this link for more information or to join us in class.

Learn to trade the Hawkeye way.

What Goes Up Must Come Down

what goes up must come down

What goes up must come down… or so the saying goes. Yesterday I showed how Hawkeye identified a $21k trade opportunity using daily charts. The longer trend is indeed bullish. But today, I show how corrections in daily bullish trends can be profitable on an intraday basis.

Using the 3 minute chart, I show how Hawkeye identified a sweet volume setup for a potential profit of over $6k in only 2 hours. Even though the overall market is long, we still can identify correction trades. So, “what goes up must come down” was a good catch of the day. When you trade with volume, it’s easy to see the directional intent of the market. We teach these methods in all of our training classes. Watch and learn to trade the Hawkeye way!

Click Here for the Free Book (The Lost Art of Volume Price Analysis)

Or for a Free Trial of the Hawkeye Trading Software

Join Randy in the next free LIVE Hawkeye Demonstration Room held every Wednesday at 9.30am EST US. You will learn more about volume and volume price analysis and see more examples and live trade setups. It is open to all.

Click this link for more information or to join us in class.

Learn to trade the Hawkeye way.

Trade Consolidation with Confidence – The Hawkeye Way

trade consolidation with confidence

Choppy range-bound markets are hard to trade. But with Hawkeye, you can trade consolidation with confidence. Today’s Hawkeye update shows just how we do it.

The Hawkeye Perspective
If the markets are choppy, this kills trend trading indicators. As soon as you enter, you get stopped out! But we designed a strategy with optimized tick charts, using our unique Hawkeye GearBox indicator. As a result, we trade in harmony with the market. Trends are easier to see and trade. When your are in a range-bound trade, keep your profit targets achievable and within the range.

So when choppy, range-bound markets show up, we have a strategy to trade with confidence. We teach different strategies for different market conditions, because the market does what the market does. We just need to use the right tool for the right conditions. Learn to trade consolidation with confidence using Hawkeye.

Click Here for the Free Book (The Lost Art of Volume Price Analysis)

Or for a Free Trial of the Hawkeye Trading Software

Join Randy in the next free LIVE Hawkeye Demonstration Room held every Wednesday at 9.30am EST US. You will learn more about volume and volume price analysis and see more examples and live trade setups. It is open to all.

Click this link for more information or to join us in class.

Learn to trade the Hawkeye way.

Things You Can Only See With Volume

Things you can only see with volume

In today’s video update, I want to show you a couple things you can only see with volume. These things are signature manipulation moves designed to trick retail traders to buy the high or sell the low. Hawkeye Volume is the key to pointing this out.

Trading with volume should be easy if you understand volume and price. When price extends to new highs, but the volume shows it opposes this push up, we call that opposing volume. These are important price bars that you need to know and understand. If you trade with volume and price, you have an edge and know how to respond to these signs. If you ignore volume, you trade at your own peril.

Hawkeye Traders has the right tools and training you need to help you navigate the trading markets. Learn to trade the Hawkeye way today!

Click Here for the Free Book (The Lost Art of Volume Price Analysis)

Or for a Free Trial of the Hawkeye Trading Software

Join Randy in the next free LIVE Hawkeye Demonstration Room held every Wednesday at 9.30am EST US. You will learn more about volume and volume price analysis and see more examples and live trade setups. It is open to all.

Click this link for more information or to join us in class.

Learn to trade the Hawkeye way.

Gold is on Fire – Hawkeye is Still Bullish on Gold

Gold is on Fire

Gold is on fire! Hawkeye identified a bullish trend in Gold (GC) on June 3rd, 2019. If taken, the trade is worth $21,270/contract today. Using the Hawkeye Profit Accelerator, that same trade would have built up to $148,890 as of today. Since the bullish trend is still in tact, we expect to see more in the future.

Obviously, the chart shown is a daily chart. So the margin and account size needed would not be suitable to a beginning trader. But consider the opportunities that each day provides to those who know what to look for. So look for these same type of setups and trades, which will occur on an intraday basis, and trade them the same way.

Personally, I prefer to use the 3 minute, 6 minute, and 12 minute charts for intraday trend trading. Look for opportunities within the bigger trends.

The idea is this: identify the trend, stick with the trend, and build your position on strength. We have a suite of indicators that help you do just that. Yes, gold is on fire. Learn to trade gold the Hawkeye way.

Click Here for the Free Book (The Lost Art of Volume Price Analysis)

Or for a Free Trial of the Hawkeye Trading Software

Join Randy in the next free LIVE Hawkeye Demonstration Room held every Wednesday at 9.30am EST US. You will learn more about volume and volume price analysis and see more examples and live trade setups. It is open to all.

Click this link for more information or to join us in class.

Learn to trade the Hawkeye way.

There’s Always a Bull Market Somewhere – Profit on Gold and Bonds.

Bull Market Somewhere

While the S&P and Dow make serious corrections, the Bond and Gold markets are ripping higher as traders seek a safety net. See Randy’s breakdown and analysis in today’s market update. There’s always a bull market somewhere.

While the Dow, S&P, and Nasdaq are all in correction mode, it makes trading much more difficult. It’s nice to know that there is always a bull market somewhere else. We found that in the precious metals and gold market. I expect to see @ES prices back to at least the 2900 level, but gold (@GC) should break back through the key 1500 level, and the 30 year bond (@US) should get to 164.

The @US is making a double-top so I expect it to pause, forming a pivot high. I will be looking for a 3-5 bar correction once this occurs.

Click Here for the Free Book (The Lost Art of Volume Price Analysis)

Or for a Free Trial of the Hawkeye Trading Software

Join Randy in the next free LIVE Hawkeye Demonstration Room held every Wednesday at 9.30am EST US. You will learn more about volume and volume price analysis and see more examples and live trade setups. It is open to all.

Click this link for more information or to join us in class.

Learn to trade the Hawkeye way.

Trade Wars and Volatility – Profit Potential Is HIGH on the S&P

Trade Wars and Volatility

Trade wars have caused volatility to spike. Volume showed the early signs for a correction last week. Last Friday Hawkeye signaled a confirmed sell signal on the S&P and Nasdaq markets. As a result, volume and volatility are expanding rapidly; so watch as Randy shows what to expect next.

Look for the Hawkeye Widebar (purple bar on video). We will watch for price to retrace back into the body of this widebar, to about the 1/2 way point. At this point, expect to see either consolidation or reversal.

The Hawkeye Perspective is to see the trade wars continue to cause volatility spikes, and increased downward pressure on Index Future markets. Correspondingly, we expect to see continued price increases in the Bond and precious metals markets.

Click Here for the Free Book (The Lost Art of Volume Price Analysis)

Or for a Free Trial of the Hawkeye Trading Software

Join Randy in the next free LIVE Hawkeye Demonstration Room held every Wednesday at 9.30am EST US. You will learn more about volume and volume price analysis and see more examples and live trade setups. It is open to all.

Click this link for more information or to join us in class.

Learn to trade the Hawkeye way.

[sg_popup id=13743]