Trading Friends Are Good to Have

Join countless traders worldwide who use
the Hawkeye algorithms day in and day out to gain a powerful edge

Trading Friends Are Good to Have

By Guest Contributor, Michele Hurlbut

Hi Everyone.

Making Trading Friends

It has been a little while since my last blog post and I have learned so much. I spent the last few weeks with a trading mentor and other traders who use the Hawkeye system and they are all invaluable on my journey. It has taught me that trading friends are good, no great, to have!

Being a trader can be a lonely business. As traders, we are usually isolated with our computers and screens. We usually can’t talk to our loved ones much about trading because they don’t understand, no matter how much they would like to. That is why having a mentor or a group of trading friends is so important to our success, especially in the beginning when you’re learning.

Why We All Need Friends

Although you may think of yourself as a ‘loner’ or ‘introverted’ (or whatever you might call it,) the human race are social creatures. In our DNA from caveman times, we know our survival is dependant on having others around us that show us our strengths and make up for our weaknesses. Be it brainstorming, fact checking, learning or . . . we learn and adapt faster when we have other like minded people to interact with. Just ask Ray Dalio, the billionaire owner of the hedge fund Bridgewater. He has been lighting up the news channels with his philosophy on brainstorming and employee interactions.

Find Trading Friends in the Hawkeye Chat Room

Hawkeye Traders has created a chat room for all Hawkeye members and it is a wonderful place! When I first joined, the room was a little quiet. But lately there have been many, many posts about trades and strategies for trades. And everyone has been open as to whether they took the trade or saw it after the fact and other details.

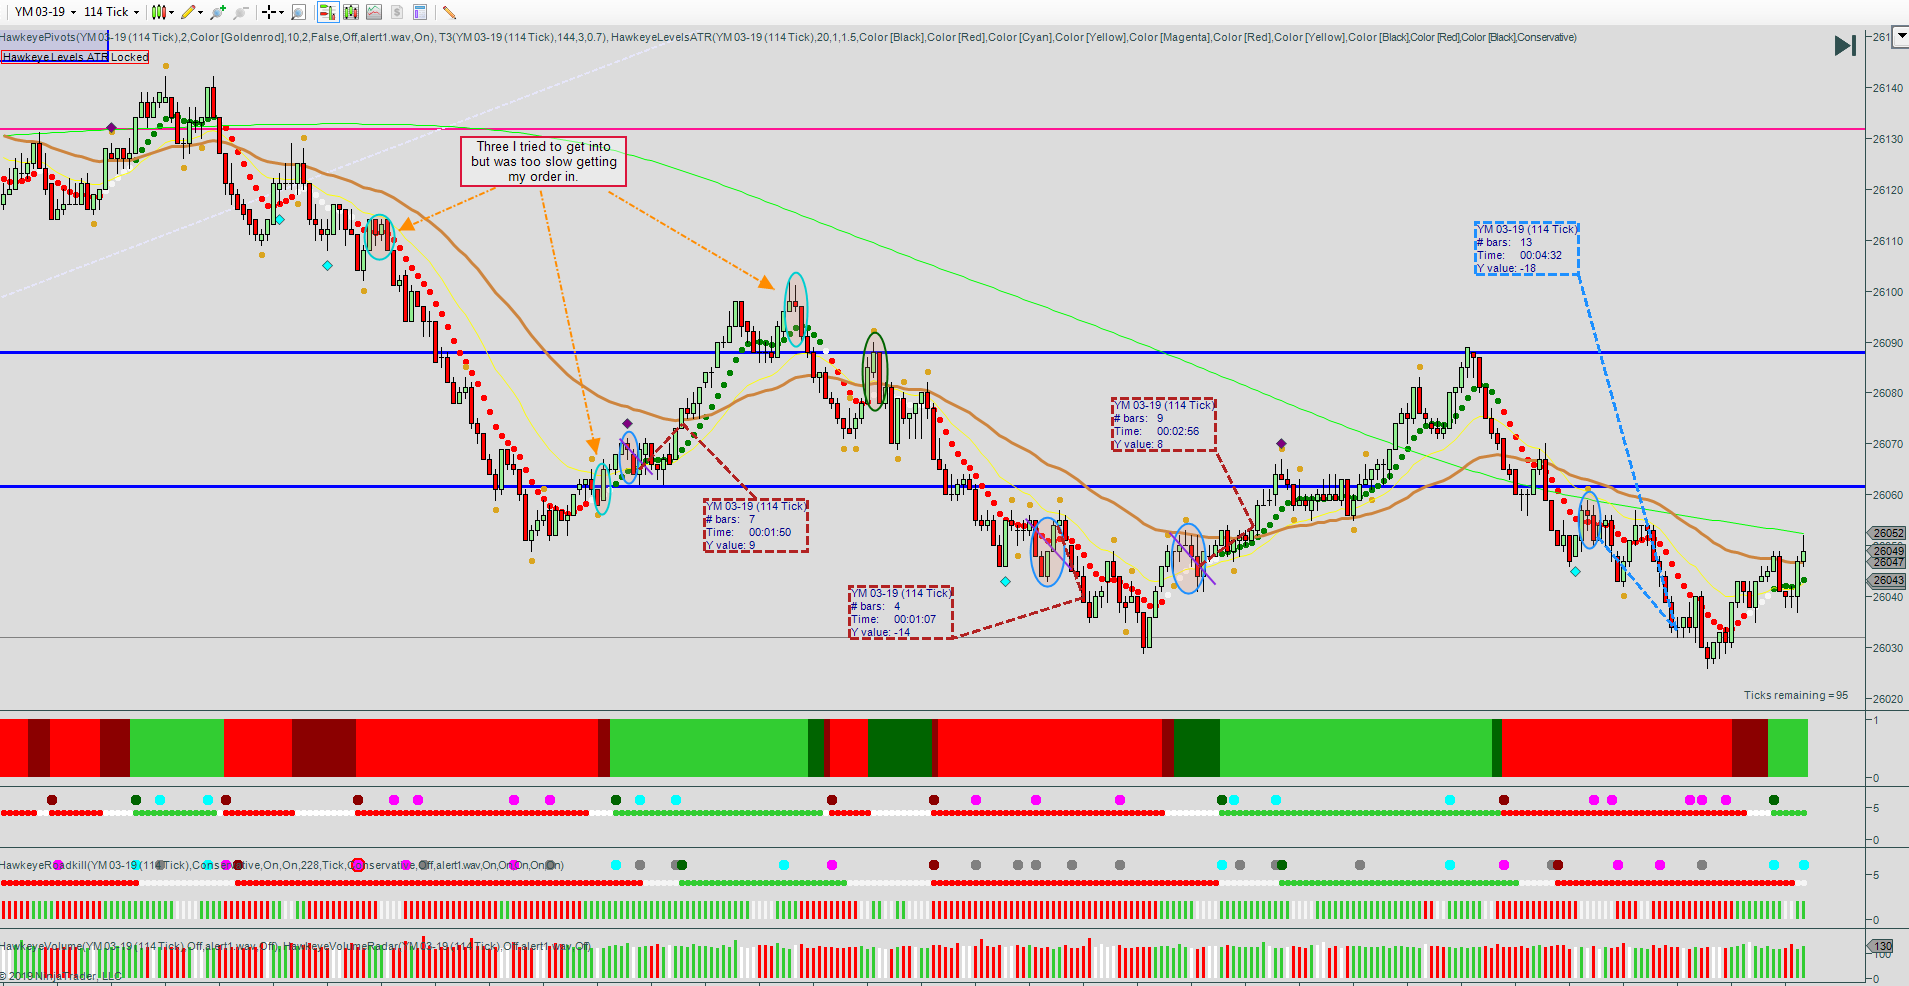
One person has been working on a particular entry set up that meets the 3-Step Entry with one added criteria that he has found great success with. Another has picked it up and is also sharing along with his twist. Between the two of them, I have been able to see the mistakes and successes of others and also share in their knowledge. This made my journey easier as I did not feel like I was the only one making mistakes.

Questions and answers have been flying in the room and the camaraderie has been amazing. I have also posted some of my trades to get feedback as to whether I may have missed seeing something about the set up or if I was, indeed, reading the market correctly. This has given me more confidence as I learned to pick out the right market movement and equate it to the lessons of the 6 Ways the Market Moves.

Having the mentor in addition is just icing on the cake.

Join the Hawkeye Chat Room Now!

I invite anyone that feels like it’s only happening to them to seek out and find a group to join where you too can interact and learn from and with. And, if you are a Hawkeye Member, reach out to [email protected] and ask to be added to the group. You won’t regret it.

Great trading everyone and speak with you again soon.


Join Randy in the next free LIVE Hawkeye Demonstration Room held every Wednesday at 9.30am EST US. You will learn more about volume and volume price analysis and see more examples and live trade setups. It is open to all.

Click this link for more information or to join us in class.

Learn to trade the Hawkeye way.

Randy Lindsey
Hawkeye Traders, LLC

Following Your Trade Plan :)

By Guest Contributor, Michele Hurlbut

Hi everyone.

Creating Your Trade Plan

Not too long ago, in this very newsletter, I wrote about creating my Trade Plan. We discussed how important having a trade plan was. That it is one of the most important things in your trading success.

Here is the question I ponder today, why didn’t I follow my trade plan . . ?

After I finished writing the outline of my Trade Plan, I continued the day with creating it. I had all the items in it; Mission Statement, Descriptions of my entry criteria and my goals broken down into steps. The one step I failed to follow today was, take ONLY your set ups (as I write this, I can only lower my gaze and shake my head).

The second most important thing in trading is to Follow Your Trade Plan! I did not do that today.

Following Your Trade Plan?

Two days ago, I followed my trade plan perfectly and I was rewarded for my efforts.

Trade Chart 1

Today, I did not…..

Trade Chart 2

I submit the proof here….

Tell me, does this bottom chart look anything like the chart above it? I hear a resounding “No” coming from you, dear readers.

This day I was not patient. I did not wait for my entries to be clear. I had hubris as I “knew” the Dow was going down and I reacted to almost every “opportunity” to get on instead of being patient . . .

You can say that I was not wrong with my “predictions” however, did I follow my trade plan? No, I did not! And then, to make matters worse, I cut my winner short because I had taken such a beating earlier and I got spooked.

It seems hard to believe that the person who traded the top chart so beautifully is the same person who, two days later, traded the bottom chart.

Are Your Emotions Getting in the Way?

I find it very interesting how our emotions can get in the way of our trading. One of the purposes of a trade plan is so you can trade without emotions, so-to-speak. We all have emotions and it is not easy to trade without them being triggered. That is why having something in writing with specific instructions on what you are looking for and what to do when you find it is important. Without it, we end up with days like I did.

I have come a long way in working through my emotions so they don’t affect my trading. Occasionally, some wires get crossed and I don’t follow my trade plan. So I am baring my soul to you in hopes that it keeps you from letting your emotions and hubris from taking over your trading day.

And, if by some chance it doesn’t, I hope you find solace in the fact that you are not alone.

Now it is time to pick myself up, dust myself off and pull my trade plan out of the folder and keep it by my side for tomorrow’s trading adventures so that I do not repeat today’s mis-steps.

Here’s to Following Your Plan and Happy Trading!

Great trading everyone and speak with you again soon.


Join Randy in the next free LIVE Hawkeye Demonstration Room held every Wednesday at 9.30am EST US. You will learn more about volume and volume price analysis and see more examples and live trade setups. It is open to all.

Click this link for more information or to join us in class.

Learn to trade the Hawkeye way.

Randy Lindsey
Hawkeye Traders, LLC

Micro Futures

By Guest Contributor, Michele Hurlbut

Hi everyone.

I have been watching the Micro Futures market ever since May 5th when it was made available to trade by my broker. I thought it would be a perfect market to move from Sim to live with as a new trader to the Hawkeye System.

Why Micro Futures?

The micro markets would be a great way to get my feet wet live without investing too much capital. For the dow it is $0.50 point (I know, that’s not saying much but it is better than $0.00 that I get in Sim :)) and the dow mini is $5.00 point.

Let’s put this into the perspective of a trade.

In the e-mini market I put at risk $5 for every point I need my stop to be on the other side of my entry to safely give the trade room to breath.

If a trader is worried about risking, let’s say, $100 of their small account then a person might tend to make the stop smaller to ‘conserve capital’. This may make the trade a much riskier one since the stop is not in the best place possible.

If that same trader were to use the Micro futures, they would comfortably be able to put their stop at the appropriate place as they would only be risking $10 and not $100.

Seeing their trades work out because they are not worried about the dollar amount time after time puts a trader into a better mental frame of mind. This gives them confidence to keep making the right trading decisions and growing their account instead of being worried about losing the money and making their stops too tight.

Another benefit I see of the Micro futures market is that you can move up on your time frames for entry without risking more than you would in the Mini futures market.

Using the Hawkeye 3-Step Method for the Win

Hawkeye has the 3-Step Entry method which I have been practicing. Due to my risk tolerance, I have been trading a smaller time frame than the recommended 3 minute.

As many traders know, the smaller the time frame, the more gyrations. So, I was getting stopped out a little more than I liked.

The method still worked. But the win ratio was smaller than what I was seeing from 3 minute time frame traders. Higher win ratio translates to higher P&L and I want that. I think trading the micro futures is my way to achieving that win rate and higher P&L.

Is There Enough Volume in the Market?

Since Hawkeye is strongly volume based, I wondered if there would be enough volume to trade the system well.

For the first week the volume was low. On the second week I noticed that volume was good during the New York trading day but not good outside of that time. The daily volume after market open has grown slowly but steadily over these last couple weeks. Today however, the volume shot up (compared to the other days). The micro Dow futures has been hovering around 10-15% of the Mini’s market for the last week. But today, it was 23% by the writing of this blog.

I think it will only get better from here.

Daily Volume Micro Futures

A small caveat; the price bars can be a bit ‘gappy’ with the smaller volume. So, I have taken to using the signals from the 3 minute YM (emini) and placing the trades on the MYM (micro). Fills have been decent however there can be a bit of slippage. But at $0.50/point, I’m not worried . . .

I look forward to seeing this market grow and, maybe, see some of you join me there.

Great trading everyone and speak with you again soon.

Full disclosure: I only trade the Dow and so am not familiar with the volume on any of the other micro markets. Please check your market before trading.


Join Randy in the next free LIVE Hawkeye Demonstration Room held every Wednesday at 9.30am EST US. You will learn more about volume and volume price analysis and see more examples and live trade setups. It is open to all.

Click this link for more information or to join us in class.

Learn to trade the Hawkeye way.

Randy Lindsey
Hawkeye Traders, LLC

Trade Plan

By Guest Contributor, Michele Hurlbut

Why We All Need a Trade Plan

Good Day All!

I am here today to talk about Trade Plans. I know, groan…. But remember, Trade plans are one of the most important steps to any trading career.

Every business has a Business Plan and our business of trading should be no different. You wouldn’t go back to your favorite hamburger joint if they didn’t have a plan to build your burger properly so you could eat it.

Just as it is important for a business to have their plan, it is equally important that we each build a Trade Plan of our own.

Make Your Plan

It’s wonderful that Hawkeye has so many videos to learn from. And I have been learning and working on the 3-Step Entry Method these past couple months.

Now that I am feeling more sure of myself and I have worked with this method, I see myself putting my own small spin on it. I have learned over and over that you can teach somebody to do just about anything but until they put their own ‘words’ to it, they will not be able to fully internalize it.

The information on the Hawkeye website is a great starting point. You still have to learn how the execution works best for you and the way you see and analyze the markets.

Trade Your Plan

By nature, I am a contrarian and so I tend to be a counter-trader (one of the main reasons I came to Hawkeye was to learn to be a trend trader.) Trading with the trend did not feel right to me. I have this constant doubt that ‘the trend will continue’ after I enter. Practicing the 3-Step Entry has gone a long way in taking this doubt away. It has also given me a structured entry and exit plan that I was able to practice and learn how I see the markets.

Randy from Hawkeye has a saying ‘Trade your Plan, or plan to fail.” Benjamin Franklin liked to say “Failing to plan is planning to fail.” Two very wise men!

So, while I know the entry criteria from the videos and website, it is time for me to write out MY plan the way I see it. In doing this, it solidifies and gives me a document, a job description, of what is expected of me while I run my trading business.

My Trade Plan

The general outline of my Trade Plan is as follows:

Mission Statement: Why do I want to be a trader?
I think it’s a good question to ask yourself. Not everyone has the same reason for wanting to be a trader.

Name of the Trade I will be describing.
Each type of trade should have it’s own name. (i.e. 3-Step Entry, Counter-Trend Confluence, etc.) This section is where I further describe the rules for my entry in detail. Don’t leave anything out. It is important to be very clear about what your entry looks like. As we have all learned, there are plenty of trades that come along that look [a lot] like your entry but not quite and when we take these tricksters, the trade fails more than it works.

Remember the burger joint, what if they gave a general ‘make a burger’ statement but didn’t say how. You might end up with dressing on the outside of your bun instead of the inside, or maybe your patty would be the base instead of a bun. Sounds like messy hands to me….. I know it sounds silly and that everyone knows ‘how to make a burger’ but they didn’t always. Burgers were invented by someone at some point in time and that person had to teach others how.

Goals.
Every trade plan should have goals that can be broken down into steps that feel like they can be accomplished. Maybe you take a big goal and break it down into many small steps. Make sure the goals are specific so you know if you are on track. It’s great when they have due dates but it is not imperative.

That is the general outline for my Trading Plan. Now it’s time for me to get it all on paper and then implement it.

What good is a Trade Plan if we don’t follow it??!!

Great trading everyone and speak with you again soon.


Join Randy in the next free LIVE Hawkeye Demonstration Room held every Wednesday at 9.30am EST US. You will learn more about volume and volume price analysis and see more examples and live trade setups. It is open to all.

Click this link for more information or to join us in class.

Learn to trade the Hawkeye way.

Randy Lindsey
Hawkeye Traders, LLC

Patience is Key

Patience is Key

By Guest Contributor, Michele Hurlbut

Good Day All!

For those of you who went to the Hawkeye Seminar in Charlotte, I envy you. I was unable to make this one and hope to be at the next one!

I’m sure your learning curve was parabolic just for having attended. Even though I could not attend, I am continuing to learn.

This Week’s Lesson

What I learned this week is… Patience is Key!

What do I mean by that?

Learning to be patient and to wait for your setup is the KEY to fulfilling your trading dream! You could say Discipline to wait is key but I like the positive reinforcement of saying Patience is Key.

We could go into the subconscious mind and how it works but that is for another time…

Practising the 3-Step Entry Method

Today I worked on the Hawkeye 3-Step Entry method. As you may have read in my past blogs, I have chosen this entry method to learn and perfect in Simulation before risking my hard earned capital.

So today was a day of practice and patience.

A picture is worth a thousand words!!

Practicing Patience

Learning to Wait

As you can see from my chart, I was not always patient for my set ups.

Part of it is the learning curve of remembering the entry criteria and the other part is pure impatience. I have a known problem with that and so am working with the Hawkeye software to curtail it.

There are two entries where I was ‘anticipating’ (yes, my other problem) where I thought the market was going and so I traded into the belief that I know more than what the volume indicators are telling me.

Boy, was my hand slapped on those.

Practicing Patience

Thankfully, properly following the entry criteria and sticking to it showed me that being Patient and waiting for the proper set up is Key to a nice profit.

Tomorrow, and the days that follow, will be more practicing my patience until I am strong in trading the 3-Step Entry Method. I hope you practice your patience also.

Great trading everyone and speak with you again soon.


Join Randy in the next free LIVE Hawkeye Demonstration Room held every Wednesday at 9.30am EST US. You will learn more about volume and volume price analysis and see more examples and live trade setups. It is open to all.

Click this link for more information or to join us in class.

Learn to trade the Hawkeye way.

Randy Lindsey
Hawkeye Traders, LLC

Best Laid Plans

Closed

By Guest Contributor, Michele Hurlbut

Making Plans

When something doesn’t go as planned, I remember a phrase my grandparents used to say “Best-laid plans of mice and men…” Growing up I didn’t completely understand what that meant as I never heard the rest of the saying “…often go awry”. As an adult, I know all too well exactly what the saying means.

As humans, we like to make plans about all sorts of things. We like to plan what we are going to be when we grow up, what school we are going to go to, where we will live. We like to plan our vacations and our life goals.

And, sometimes those particular plans don’t work out. Something gets in the way of our “best-laid plans” and so we adapt and change our plans. This helps us grow (we hope.) That is what happened today.

Ready to Go Live. . .

I have been practicing my system (the one I shared with you in my last blog post.) Formulating and learning the rules around it. Successfully Sim trading it for quite some time, and I felt it was time to take the next step.

The plan was to get up this morning and move to trading my system in my live account with 1 contract and 1 target. Starting slow and ramping up is a solid plan for risk management and mental preparation.

. . . Or Not

When I wake up to trade, I do a morning routine. I do this without fail every trading day to get me mentally and physically focused and ready to take on the day. This morning, as I was doing my routine, I noticed I was having a hard time staying focused on my process. This routine has been my process throughout my trading career and I have noticed that when I am unable to focus on my routines, my trading day is not good.

So, although I was very disappointed, I decided not to start my live trading today. I did trade but it was in Sim. And again, I proved to myself that trading with live money on these unfocused days does not pay…I ended the morning negative.

I think I only made one trade that truly fit my rules the whole morning.

Best Laid Plans - example bad trades

Permission to Call It Off

As traders, we are our own boss. We can call in sick any time we want but we know it affects our bottom line. Unlike a J.O.B, we don’t have someone else paying for our time so we usually don’t ‘call in sick.’ As business owners, we usually power through these days and then wish we had stayed in bed. We forget that we are people and sometime need to take a day off when we are not at our best.

I hope you all give yourselves permission to ‘call in sick’ when you are not feeling/acting 100%, like I did today. It is important to protect our capital, not to mention our sanity, so we can be successful and live to trade another day.

Great trading everyone and speak with you again soon.


Join Randy in the next free LIVE Hawkeye Demonstration Room held every Wednesday at 9.30am EST US. You will learn more about volume and volume price analysis and see more examples and live trade setups. It is open to all.

Click this link for more information or to join us in class.

Learn to trade the Hawkeye way.

Randy Lindsey
Hawkeye Traders, LLC

Square One

Image Stuck at Square One

By Guest Contributor, Michele Hurlbut

Stuck at Square One?

It is time to open the Hawkeye website and learn about what I’ve gotten myself into. I am excited about the possibilities, and a little nervous about the feeling I have of being “back at Square One.” Have you ever felt that way? Maybe a little frustration about it?

But then I ask myself, “am I really back at square one?”… I am not!

There is so much I know now that I didn’t know when I first started out. I know about support and resistance, what they look like on a chart and possible reasons they form. About trends and how to identify them. And, I know about price action. All these things I did not know when I was at ‘Square One’.

How much do you know now that you did not know when you first started? Or maybe you are at Square One and now you are looking forward to knowing these things soon.

Ah, the relief I feel as I realize I am not at square one. I let it sink fully in. This is only a single step on my trading journey forward. I can’t wait!

First Steps

So I dive in and watch the most recent Members Monthly Webinar (watch the webinar herethis monthly training is normally available to Hawkeye Members only). It is on the Hawkeye 3-Step Entry Method. Randy explained clearly how to use the Hawkeye Heatmap for the current time frame and then Hawkeye Roadkill for the next two time frames higher. He answered tons of questions and by the time I was finished watching the video I felt I had a basic knowledge of what to do.

Learning From Wins…and Losses

With this new knowledge, I set my charts up like he suggested using the time frames I am familiar with. I added the indicators and did some basic backtesting to become familiar with the patterns he showed us to look for. After that, I spent the next two weeks watching the live markets and taking (in Sim) the set ups I thought fit the pattern. There were some good choices and some not so good choices but they were all learning choices. It has been shown that we learn more from our losers than our winners when we study them and don’t just brush them aside.

The Pay Off

And it is paying off. Today I took this trade:

3 Step Entry Method Example Trade

Great trading everyone and speak with you again soon.


Join Randy in the next free LIVE Hawkeye Demonstration Room held every Wednesday at 9.30am EST US. You will learn more about volume and volume price analysis and see more examples and live trade setups. It is open to all.

Click this link for more information or to join us in class.

Learn to trade the Hawkeye way.

Randy Lindsey
Hawkeye Traders, LLC

Overwhelm

Overwhelmed

By Guest Contributor, Michele Hurlbut

Hi All, it’s Michele again.

Overwhelmed

This week’s Journal Entry is titled “Overwhelm” and you will see why I chose this title as you read on. My new Hawkeye Workspace is fully loaded with all the bells and whistles. While it looks impressive and colorful, it is also daunting at the same time. After watching it for two weeks, I must admit, I am feeling Overwhelmed. There are so many charts and so many indicators on a chart, and I don’t know what they all do. And I am not used to that much information yet.

Because I don’t yet know what all these new tools do, I am trying to make sense out of what amounts to a “foreign language” without ever having gone through the lessons to learn how to speak it. Wow, that was an interesting analogy.

I Didn’t Know Where to Start

Before I sat down to write this journal entry, all I felt was the feeling I call ‘Overwhelm.’ I didn’t know where to start because I felt like there was so much going on and so much to do. My brain just spins it over and over until I’ve made a mountain out of a molehill. I’m sure you know the feeling . . . Then, as I was writing and looking for a way to describe my thinking, “foreign language” popped into my head.

Once I saw it on paper, I realized how much pressure I was putting on myself to learn this “foreign language” overnight. Why would I expect myself to learn something this different, overnight? Crazy, right?

My Trade Plan

Now that I understand the source of the feeling (and boy does journaling help in that endeavor), I can formulate a plan. My plan has the following steps:

1. Take clean charts of my favorite time internals.
2. As I go through the training videos, add the indicator I have just learned to my chart and study how it moves with my current knowledge of price action, and support and resistance.
3. In this way, I will grow into the Hawkeye Trading Software just like I would learn a new language or hobby.

Remember, “Rome was not built in a day”!

Closing Thoughts

So by taking these steps, I now feel confident that my plan is achievable. As a result, my feeling of overwhelm has left and a feeling of calm, clear action has taken its place. I hope this helps you also.

Great trading everyone and speak with you again soon.


Join Randy in the next free LIVE Hawkeye Demonstration Room held every Wednesday at 9.30am EST US. You will learn more about volume and volume price analysis and see more examples and live trade setups. It is open to all.

Click this link for more information or to join us in class.

Learn to trade the Hawkeye way.

Randy Lindsey
Hawkeye Traders, LLC

Coaching Traders with Adult ADD/ADHD

By Kenneth Reid, Ph.D

Sometimes as traders, we all periodically come up against seemingly insurmountable obstacles… such as when our trusty method suddenly stops working and we are forced to switch horses in midstream.

Yikes!

I specialize in coaching traders with Adult ADHD (perhaps 50% of the trader population) who are always changing horses. The typical trader does not spend enough time with a method to learn it inside out.

Symptoms of Adult ADD include not just a revolving door relationship with indicators and methods, but also overtrading, over-confidence, over-reliance on one’s ability to improvise, and a shoot-first-ask-questions-later attitude that makes reading directions a last resort.

I’ve been there; I live there. (When I buy a new appliance the first thing I do is put the directions away in a drawer.)  We like to figure things out for ourselves.

Curiously, the market can induce an ADD-like state in rational individuals who don’t have the disorder. That might have happened to you on your first trading day with Hawkeye.

Trading is like marriage; it looks easy from the outside, but after 5 or 6 years with one system, it doesn’t look the same. Although we are now “experienced,” it’s remarkably easy to regress to a very primitive gut-level approach to problem solving that can destroy an account in a week or two.

Why is that?

Trading is a performance sport. Top athletes are creatures of habit because in the heat of the moment, good habits produce the best results. When we introduce novelty, it degrades our good habits and we have to rebuild them with deliberate practice. So, the best place to practice is by using a SIM account.

I noticed in the previous blog articles that Michele wisely began her Hawkeye Journey in SIM. SIM is very useful if you trade it the same as you would a live account because that takes discipline. It also helps develop and fine-tune your strategy.

I suggest using SIM whenever something new comes into the picture: a new indicator, a new method, a new market, a new platform, a new brokerage. Stay in SIM until you have rebuilt your set of habits. Once you demonstrate you can consistently trade with profits in a SIM account, then you can begin the real work of trading profitably in a live account.

Thanks for your posts, Michele. I’m sure they will encourage and inspire many.


Join Randy in the next free LIVE Hawkeye Demonstration Room held every Wednesday at 9.30am EST US. You will learn more about volume and volume price analysis and see more examples and live trade setups. It is open to all.

Click this link for more information or to join us in class.

Learn to trade the Hawkeye way.

Randy Lindsey
Hawkeye Traders, LLC

The Journey Begins . . .

Arrow

By Guest Contributor, Michele Hurlbut

Hi, my name is Michele and I am a futures Intra-day trader.

I have traded futures since 2012 using support/resistance as my primary system. Using volume bars or volatility indicators were not in my plan. My success rate has been pretty good, but in the last year, the market has changed and my system was not working so great. Market volatility had increased to a point where my R:R (Reward:Risk) ratio was not working. I waited for a long time to see if the market would ‘calm down’ and go back to ‘normal’. However, it’s been too long and it looks like the market has found a ‘new normal’. If you are a seasoned trader, you might be familiar with the market gyrations. I have traded in this long-term Bull market only. As a result, I am not familiar with this new market condition. I was at my wits end and did not know where to turn.

Randy and I first met a few years ago when he was searching for a support/resistance tool to add to his Hawkeye Toolbox. I remembered that Randy used volume and trend together with support/resistance. So I reached out to him two months ago, just to see what he thought of this market.

I have been using the Hawkeye Volume Module for the past 2 months and have found it very enlightening. During this time, Randy was graciously posting some of his charts and entries. Consequently, things started to click more, so I decided to get the whole Hawkeye Professional Package and dive in. I liked the way it was giving entries (my current method did nothing of the sort). These entries were in areas that my current method gave hints at the possibility of an entry IF I understood what the candlesticks were saying. The market has been beating me up for the past year and I am now a little gun shy about my ability to see an entry, let alone take it. I have learned that the mental side of trading can make or break you, and my mental side is a little broken right now.

Being a new user to the Hawkeye system, Randy and I thought it would be great to share my Hawkeye trading journey with you. I expect you will find that you are not alone in your many hours in front of your computer watching charts and studying bars. Hopefully, my journey will encourage you to keep going even when the going gets tough. Trading is an amazing ride and I want you to all join me in it.


Join Randy in the next free LIVE Hawkeye Demonstration Room held every Wednesday at 9.30am EST US. You will learn more about volume and volume price analysis and see more examples and live trade setups. It is open to all.

Click this link for more information or to join us in class.

Learn to trade the Hawkeye way.

Randy Lindsey
Hawkeye Traders, LLC

How Important is Your Win-Loss Ratio?

How important is your win loss ratio?

In today’s article, I want to look at the win to loss ratio and its importance to a trading system.

Let me start by posing a conundrum; would you prefer to walk down the high street with a verified badge on your chest showing off a 92%-win loss ratio or would you prefer to drive down that high street in a top of the range sports car?

The bottom line is that the win loss ratio is just a measure of a system and we should only focus on being profitable.

What happens if we get fixated on our win ratio?

Focusing on our win ratio can result in premature exits from profitable trends, and holding losing trades far too long.  Systems based on a high win loss ratio are also higher risk. They usually result in few losses, but these losses are extremely large and can massively damage your account.

If we get emotionally upset by taking a loss then it suggests that we are more interested in being right than focused on being profitable.

What win ratio should we aim for?

The answer in short is that we should not focus on the win loss ratio as this is only a measure of our system. Our focus should be entirely on our trading rules; to make a profit.

How then should we use our win ratio?

Different trading systems need different win ratios to be profitable.

As an example, if a system has a win loss ratio of 2:1, and we risk $50 per trade, then a win will produce $100. In this scenario, so long as we have a win ratio above 34%, then we will be profitable.

To demonstrate this let us say that we take 100 trades and win 34% = 34 trades.

Wins = 34 x $100 profit = $3,400
Losses= 66 x $50 loss = -$3,300
Total profit $3,400 – $3,300 = $100.

Now, taking 100 trades to only make $100 is not profitable. So setting a minimum 50% win ratio would be more reasonable to trade this system, which yields:

Wins = 50 x $100 profit = $5,000
Losses= 50 x $50 loss = -$2,500
Total profit $5,000 – $2,500 = $2,500

We then test the system over 10 rounds of 100 trades and find out if the system is profitable.

If the system is profitable, we then focus entirely on the trade rules and executing the trades. We are not concerned about losing trades since we only need to win 50% of our trades, and that the system will provide that.

Closing out trades the Hawkeye Tomahawke FX Suite

In the Tomahawke scalping system, the strength of a currency can quickly change since we are trading fast time charts. If we focus on the current combined profit of all trades at one time, and reach our profit target, we should be happy to close out the trades, even if 4 are profitable and 2 are losing trades, as shown in the example below. Don’t be concerned that the -$5.04 trade would be counted as a losing trade as its value is insignificant to the overall profit.

Tomahawke Win Loss Example Chart

In summary, my hope is that this article has helped you think about win loss ratios in trading. Understanding win loss ratios will aid you in becoming a better trader.

If you would like to find out more about the Hawkeye Tomahawke system, please visit us at https://www.hawkeyetraders.com/tomahawke-forex-trade-room/


Learn more about volume and volume spread analysis, and see more examples of live trade setups in the next free LIVE Hawkeye Demonstration Room held every Wednesday. Open to all. Click this link for more information or to join us in class.

Learn to trade the Hawkeye way.

Good trading,

Randy Lindsey
Hawkeye Traders, LLC

Which Mouse Are You?

by Guest Columnist, Kenneth Reid, Ph.D

Hi… this is Dr. Kenneth Reid from HawkeyeMindset.com

Reduce Your Errors

I would like to speak about how to reduce your trading errors. Like tennis, trading is a game of errors. In other words, we generally self-limit our success. Our outcome improves when we make fewer errors .

If your trading method has a potential 60-70% win rate, but on 2 out of 10 trades you execute poorly, it will be difficult to make money as a trader.

So it pays to strive for perfection in those elements that are under our control, since randomness plays such a large role overall.

First Mouse Syndrome

One of the most common issues traders face is a collection of behaviors I call the “First Mouse Syndrome.”

Moneytrap First Mice“First Mice” get whacked when they go for the cheese.

One reason is that First Mice tend to be excitable and they enter trades too early. It could be from greed, fear of missing out or just plain impulsiveness. Impulsiveness is usually driven by an over-reliance on intuition and an under-utilization of a technical method.

Premature entries lead to taking “heat” because the market has not yet developed internal coherence. The more push-back we experience, the more defensive we get. This leads to micromanaging trades and tightening mental stops.

Unfortunately, this almost always works against the trend trader. The key to trend trading is to give the market sufficient room to breathe once a trend is established.

The Hawkeye Trend Indicator

The Hawkeye Trend and Stops indicator is designed to do precisely this. However, with the three speed settings, you have some discretion in how you apply this indicator. Because first mice prefer to get in early, they will typically set Hawkeye Trend to ‘Aggressive.’

If you find that you are getting stopped out of good trades, you may be experiencing the stop hunting games that typically occur in futures and forex near key support and resistance levels. These games trap and punish First Mice.

The irony is that responsible First Mice stop themselves out willingly because they have been taught to manage risk with relatively tight stops. They want to “keep losses small and let winners run.” But 1 wrong + 1 right = Zero (a breakeven trader, at best.)

If you are getting stopped out and then find that the market often reverses and goes your original way, it may help you to think like The Second Mouse.

The Second Mouse

The Second Mouse gets the cheese by simply waiting for First Mice to be stopped out before taking action.

First mice tend to get stopped out when the first pullback fails. For example, if they shorted, the market quickly makes a new high and stops them out. . . and then the downtrend resumes.

If they went long, the market makes a new low and stops them out. . . and then the uptrend resumes.

This process creates the common ABC countertrend patterns that occur within trends. You will get stopped out on the A-leg of the ABC if your stop is too tight . If this is happening for you, consider adjusting Hawkeye Trend and Stops to the Conservative setting.

Moreover, it’s usually not a good idea to use mental stops to manage positions in a trend. Chances are you will react to random noise, micromanage your trade and choke it off.

Closing

You can watch a free video that discusses the First Mouse Syndrome by following the link below. It’s the latest video in the Hawkeye Mindset Mastermind Breakthrough program, which gives you highly practical weekly videos on trading psychology. Check out HawkeyeMindset.com for more information.

Download the free video sample here:

Hawkeye Mindset Mastermind Breakthrough Video Series – First Mouse Syndrome


Join Randy in the next free LIVE Hawkeye Demonstration Room held every Wednesday at 9.30am EST US. You will learn more about volume and volume price analysis and see more examples and live trade setups. It is open to all.

Click this link for more information or to join us in class.

Learn to trade the Hawkeye way.

Randy Lindsey
Hawkeye Traders, LLC

Let Hawkeye Volume Lead the Way

There is no better tool to trade with than Volume, and Hawkeye Volume is the Best! Volume leads the way to price direction.

Why?

I’m glad you asked. . .

Volume is a Leading Indicator

Volume is the only leading indicator that signals when price is about to move prior to it happening. You see, Volume is the fuel that drives the market. And when you couple this with triple timeframes, you have a combination that gives traders all over the world the edge.

Hawkeye Volume displays whether buying or selling volume is dominating the market. In other words, it doesn’t just tell you the volume, as with other trading software, but it actually tells you whether the volume is professional BUYING or professional SELLING. This is displayed in a simple and visual way: red shows professional selling, green shows professional buying, white shows no demand.

Below is a great example of a EURJPY setup this morning:

EURJPY Chart Example

Notice how just before the big price move down, that Volume signaled the intent of price 9 price bars (45 minutes) before the trend began. It is shown by the Red price bar extension with a Hawkeye Pivot (yellow dot). This is significant in that we expect price to reverse 3-5 price bars after a Pivot. However, with opposing volume too, it becomes a compelling signal of market reversal.

In this example, it was quite rewarding. As you can see, using the Hawkeye ATR Levels tool, we achieved a 6:1 Reward:Risk. Setups like this occur every day, and Hawkeye Volume is the best at showing you this action.

The Hawkeye Perspective:

Don’t sit on the sideline and let trades like this pass you by. . . Hawkeye Volume leads the way and is the core component of all our unique indicators.


Join me in the next free LIVE Hawkeye Demonstration Room held every Wednesday at 9.30am EST US. You will learn more about volume and volume price analysis and see more examples and live trade setups. It is open to all.
Click this link for more information or to join us in class.

Learn to trade the Hawkeye way.

Randy Lindsey
Hawkeye Traders, LLC

Re-enter an Existing Trend the Hawkeye Way

In today’s article, let’s take a look at how to trade Forex based on Hawkeye volume-based trading principles. And in particular, let’s consider the case where we missed the initial entry and are looking to re-enter an existing trend a little later.

Re-Enter an Existing Trend

In Forex, we always begin with the Hawkeye Fatman indicator. It shows which currencies are relatively strong or weak with respect to all the other currencies. Below is a chart of today’s Fatman showing that the EUR is weak and the USD is strong. Based on this setup, we know that strength cycles constantly, and usually returns to fair value or to the opposite extreme. So in our charts, we look for a probable reversal of trend direction to start our trade.

Fatman chart

So the Fatman started to show a reversal setup around 0600, and we saw that the initial trade entry on our charts came around 0630, meaning we missed that initial entry! Bummer! What do we do?

Good question!

In our Hawkeye training room, we teach students to study VOLUME, and that is where we find our answer.

Volume is the Key

On the EURUSD chart below, we see the initial entry we missed, marked by the first green up-arrow. Since we missed the initial entry, all we need to do is wait for the pull back on the volume, which signifies buying weakness. When buying strength returns, the trend continues and signals our re-entry.

EUR 5min Chart

As you can see, there are several more opportunities to get into this trend if you missed any of the other previous entries.

The Hawkeye Perspective

As an advanced tip, use the Hawkeye Roadkill indicator. It identifies EVERY volume pull back on a trend, compares it to the longer time volume and signals the best time to enter or re-enter the existing trend. It is a fabulous tool that I would not trade without. But I wanted to make sure you knew how to spot a valid re-entry by just using volume.

I teach this and many other principles in our weekly Wednesday training room. So please come along and join the action.


Join me in the next free LIVE Hawkeye Demonstration Room held every Wednesday at 9.30am EST US. You will learn more about volume and volume price analysis and see more examples and live trade setups. It is open to all.  Click this link for more information or to join us in class.

Learn to trade the Hawkeye way.

Randy Lindsey
Hawkeye Traders, LLC

Gold At A Crucial Point Now

Last week we saw monthly Gold (GC) hitting a critical monthly trendline, as shown by the chart below. This trendline in Gold has been in place since 2011.

Historically, whenever Gold hits this trendline and fails to break it, the downtrend continues.

GC Monthly Chart

If we couple that with the US Dollar index (DX), the DX monthly chart below shows the current trend of weakness in the US Dollar.

However, we see this trend hitting support, with declining volume. If the DX were to continue lower, we need to see volume advancing, not declining.

DX Monthly Chart

Also, the Hawkeye Fatboy chart below shows that daily Gold is overbought and should start to lose strength, as it cycles back to fair value. This will be accelerated if the US Dollar starts to strengthen, and then Gold will begin to resume its longterm downtrend.

Hawkeye Fatboy

Looking at the daily Gold chart below, notice the volume weakness already beginning. Therefore, watch the daily GC chart for the current uptrend to be broken, with confirming selling volume.

GC Daily Chart

Hawkeye Perspective: Gold is at a critical point now, so watch for the daily Volume on Gold to see if strength or weakness will prevail during this time.

Remember, green buying volume shows strength, and red selling volume shows weakness. If the US Dollar starts to strengthen, this will accelerate the potential for a down move in Gold.


Join me in the next free LIVE Hawkeye Demonstration Room held every Wednesday at 9.30am EST US. You will learn more about volume and volume price analysis and see more examples and live trade setups. It is open to all.

Click this link for more information or to join us in class.

Learn to trade the Hawkeye way.

Randy Lindsey
Hawkeye Traders, LLC

Why Trading More Produces Less

Greetings Hawkeye traders, this is Dr. Kenneth Reid from HawkeyeMindset.com . We all want to improve our trading. What’s the best way to accomplish that?

Lazy Traders?

It’s not a question of working harder. There are no lazy traders. In fact, we have the opposite problem: screen time seems to increase way beyond what we originally expected. (Just ask your spouse.)

Unfortunately, screen time isn’t directly correlated with an improvement in our bottom-lines. Why not?

Like any profession, trading well depends on a proper mindset and the execution of specific skills. . . skills that need to be practiced.

Raw screen time doesn’t necessarily build these skills. . . or any skills, for that matter. In fact, excessive screen time can tire you out, zone you out. . . and keep you from developing the real-time skills you need.

It’s a paradox: trading too much is the most common trader problem that’s not even recognized as a problem. Check out this comment from the owner of a popular futures prop shop:

“Our average profitable trader is active less than 3 hours a day. Our average struggling trader logs more than 6 hours a day.”

And I know traders who are in front of their screens 12 hours a day or more!

Sure. . . it’s natural to try harder when you are not getting the results you expect. And it’s natural to expect your results to be proportional to your effort. And in some fields of endeavor these expectations are correct.

But trading isn’t one of them.

Here’s why.

The typical struggling trader operates with an idiosyncratic mix of biases, goals, predictions, snap judgments, impulses and intuitions combined with an equally eclectic set of technical tools.

Although you may swear loyalty to a particular method, such as Hawkeye, when push comes to shove in live trading, many traders quietly change the game.

In this ad hoc situation, the number of unique discretionary combinations available to enter, manage and exit any one trade… probably runs into the thousands.

When the pressure is on, consistency becomes elusive. So elusive that our results can be much worse than chance. Seriously. It will seem like you are missing virtually all the good trades and taking virtually all the bad trades!

I know it sounds impossible, but I hear about this often and I’ve experienced it myself. It causes traders to profoundly mistrust themselves and feel almost cursed.

The good news is that the solution is within everyone’s reach.

Good trading relies on a small group of attitudes and abilities that are the opposite of the idiosyncratic mix we have, by default, in our heads.

Good trading is:

  1. Unbiased,
  2. process orientated,
  3. well-planned,
  4. disciplined, and sometimes
  5. counterintuitive.

A Trading Mindset

This is the mindset needed to trade successfully. We call it the Hawkeye Mindset. (This is how Randy trades, right?) Without it, you are subject to your own random discretionary ideas, impulses and behavior.

Mindset is crucial, but it’s not enough. We also have to master the specific skills regarding entering, managing and exiting trades. Mindset needs to be practiced. . . and so do the skills.

But frankly, most traders never actually practice. . . they just analyze and trade.

Either they feel they don’t have time to practice, they don’t think practice is important, or they think trading itself is practice. But it’s not.

Truly effective practice has three essential ingredients: It’s…

  1. Specific,
  2. Measurable, and
  3. Progressive. . . which means the challenge increases incrementally over time.

I call this “Conscious Practice.” Conscious practice creates hundreds of small breakthroughs, which generate measurable macro improvement. (And they generate dopamine, too. . . so you will enjoy practicing.)

This isn’t just a theory. . . this is the training method that resulted in 90 new records at the 2016 Rio Olympics.

And if you start applying it, you can break through your own limits and set new performance records on a regular basis.

So here’s a quick quiz:

Conscious Practice is ____________, ______________, and ____________ .

Ready to start?

Step 1: Pick a specific attitude or skill you want to get better at. Get very specific.

Step 2: Set measurable goals and track your progress using market replay or practice in a live market in Simulation mode.

Step 3: As you make progress, progressively raise your criteria for success.

Key Point: This recommendation may shock you. . . if you are not yet profitable. . . spend 90% of your time practicing conscious skill development in Simulation Mode. . . and 10% trading live. As you notice your mindset and skills improving, gradually increase the proportion of live trading.

If you are ready to start your own program of conscious practice, download the free video below, which is part of the low-cost Hawkeye Mastermind coaching program available on HawkeyeMindset.com

Hawkeye Mindset Mastermind – Does Practice Make Perfect?


Join me in the next free LIVE Hawkeye Demonstration Room held every Wednesday at 9.30am EST US. You will learn more about volume and volume price analysis and see more examples and live trade setups. It is open to all.

Click this link for more information or to join us in class.

Learn to trade the Hawkeye way.

Randy Lindsey
Hawkeye Traders, LLC

Mindset of a Successful Trader

Mindset of a Successful Trader

It doesn’t matter the amount of money you have. It doesn’t matter if you are a great technical analyst. It also doesn’t matter your depth of knowledge in trading. If you don’t have the right trading mindset, you may never become a successful trader.

The type of mindset you have will determine if you are going to succeed or fail. While having a great psychology is important in trading, most traders just ignore it and see it as something they will work on later. This is a huge mistake.

If you are trading with a wrong mindset, it is not about the money you have in risk capital or how much you have mastered your strategy, you can still fail. No amount of money or strategies can make you successful if you do not have the right mindset about trading.

Below are some important trader mindsets you need to understand if you want to achieve lasting success in the market.

Money and mindset

The truth is that risking money during trading influences your mindset. One important factor to consider in maintaining and achieving the right trading mindset is proper risk management. When you risk more than what you can handle emotionally, this may affect all other part of your trading. This may lead to having a wrong mindset immediately when the trade starts. You may become over emotional and anxious, which is not good for the business. The best approach is to begin your first live trades with small amounts. You have to ‘test the waters’ so as to know your risk spot where your emotion is not too high.

Expectations are key

Most people usually come into the business with high and unrealistic expectations on different things. They are not realistic about how long it will take them to properly learn trading, how long to become consistent and successful, and how frequently they are going to win trades. Starting something with a load of unimaginable expectations, you are simply getting ready for emotional pain.

You have to relinquish every emotional attachment to trading. And also minimizing your risk, just as we have discussed before, can be achieved by not setting too high expectations about your trades.

Simple is better

As humans, we always have the tendency to make simple things complicated, we make things harder than they really should be. This is very true when it comes to trading. Having a messy and complicated trading strategy is the number one thing that can negatively influence your mindset. It is very important that you stay calm and clear your head when trading, and for this to be possible, you need a simple trading strategy, especially one using volume and price action.

Summary

Therefore, building a foundation with a simple but very effective trading strategy is the first step to achieving a proper trading mindset. Next, with a balanced money management approach and with properly managed expectations, consistency and discipline, you will be on the way to developing the right trading mindset, and therefore, consistent trading success.

At Hawkeye Traders, we not only equip you with world-class indicators, and with strategies and training that help you on your trading journey, but we also train you on the proper mindset. We have a whole website dedicated to developing a successful mindset: http://www.hawkeyemindset.com/mastermind/


Join me in the next free LIVE Hawkeye Demonstration Room held every Wednesday at 9.30am EST US. You will learn more about volume and volume price analysis and see more examples and live trade setups. It is open to all.

Click this link for more information or to join us in class.

Learn to trade the Hawkeye way.

Randy Lindsey
Hawkeye Traders, LLC

7 Secret Tips Successful Traders Practice

What separates successful traders from the rest of the pack? Why is it that only a mere 5% really make it in trading? How did these traders do it? While all successful traders have their proven trading strategies and systems to call and manage their trades, they know there is one more important thing to do: focus on improving themselves.

Successful trader

Because the trader is the ultimate resource that can act to produce the desired trading results, he or she must ensure this resource is primed and efficient to perform its best at trading. As such, successful traders pay great attention to the points listed below which elucidate how they go about their trading business.

Treat Trading Like A Business

Top traders know that trading is a serious business and they accord it such importance by considering key factors that affect all businesses. From a trading perspective, these factors include: writing a detailed trading plan; starting out with an appropriate trading account size; knowing the various costs of trading; sustaining and growing the account; and acquiring the right trading knowledge, skills, software and equipment.

Keep The Ego In Check

Trading mistakes can arise from emotional responses directly linked to one’s ego. A trader that needs to be right will let the ego prevail and inflict ruin to his/her account, always trying to will the market which he/she denies cannot be controlled. Being egoistic also means not acknowledging one’s trading mistakes and therefore not learning from them. For example, the ego will egg the trader on to hold a losing trade instead of taking the correct action of cutting loss at the appropriate time.

Be Disciplined In Every Trade

The item that directly affects your bottom line is trading discipline. The serious trader follows his/her trading plan to the letter, and adheres to it as much as humanly possible (Note: even successful traders make mistakes). Trading discipline includes protecting trading capital and sensibly allocating risk per trade; only taking trades that satisfy risk/reward parameters and set up correctly; staying on the sidelines at all other times and not forcing a trade; cutting losses quickly via pre-determined stop loss levels; letting a good trade ride but protecting a winner from turning into a loser. In essence, being disciplined allows the successful trader to show profits consistently and rein in losses should any trading period turn out to be a rough ride.

Protect Trading Capital

The serious trader treats his/her trading money very seriously. It is what enables trading to be done. Additionally, it is also the objective of trading: make winning trades to grow the money. Thus, the successful trader will guard his/her capital zealously, ensuring that risk per trade is controlled so that losers only erode the account, not chew a hole in it. This assures the trader that his/her business can continue, today, tomorrow and into the future.

Don’t Marry Your Trades

The serious trader knows that a single trade does not determine his/her trading success. He/she is fully aware that any trade could result in a loss. Therefore a conscious act of removing any emotional attachment to every trade is essential. While staying disciplined entails waiting for the good trade entries, this wait and eventual trade entry do not compel the successful trader to think that he/she must be right in taking that trade. As such, should the market go against the trader and he/she sees prices approaching the stop loss level, the trader fully accepts that losing is a real possibility and does not rationalize further. The novice trader, in contrast, will often be tempted to move the stop loss further out so as to let the trade have “more room”. Such a trader feels the need to be right and doesn’t know how to walk away from a loser.

Be Realistic, Practical And Persevere

Being realistic is what separates the men from the boys when it comes to trading. The successful trader does not have a get-rich-quick mentality and knows it is hard work; thus he/she treats trading as a business and has the mental fortitude to stay in the game for as long as it takes. Perseverance is a key asset. The trading discipline imposed in the trading plan reinforces this. It results in a personal belief that it is possible to succeed in trading. The serious trader knows he/she is psychologically guided by his upbringing, attitudes and experiences regarding money and success. He is also practical by admitting these limitations and works to break free from such self-defeating barriers. Pursuing the right education from other successful traders are good solutions to the problem.

Know Yourself And Let Others Help You

The successful trader knows his/her strengths and weaknesses when it comes to trading. They are not shy to ask for help. While knowing there is no shortcut to success, the trader often pursues education from the best mentors to acquire the right knowledge and skills essential to becoming successful at trading. As part of the trading plan, the serious trader keeps a trading journal and reviews this daily to learn from past mistakes and internalize winning trade executions.  Also, a mentor can use the trade journal to help the trader make specific and personal improvements.

You may need the help of a trading coach.  Let Hawkeye Traders help you get back on the path to consistently profitable trading. Contact us today at [email protected] and ask about our Trader Coaching Program. You’ll be glad you did.

Trade safe!


Learn more about volume and volume spread analysis. See more examples and live trade setups as well in the next free LIVE Hawkeye Demonstration Room. It is held every Wednesday and is open to all. Click this link for more information or to join us in class.

Learn to trade the Hawkeye way.

Randy Lindsey
Hawkeye Traders, LLC

My Top 4 News Websites You Should Be Reading

Whether you trade stocks, Forex, futures, or options, you need to be up-to-date on financial news. I can’t emphasize how important it is to be aware of pending economic news announcements, or earnings reports if you are currently in an open trade. Not only will it protect you from possible financial ruin, but it can help you to capture a potentially huge windfall. News is important to both fundamental and technical traders alike.

So, here is an overview of my top online sites for news about stocks, forex, futures, and the economy. I do look for different types of information from each one, but I wanted to share my favorite ones with you:

Forexfactory (www.forexfactory.com)
This is my go-to site for economic news releases. The daily calendar gives all the major news that can affect any of the international markets, including GDP, Crude Oil inventories, Unemployment and NFP, FOMC and other world releases and reports… to name a few. Economic releases are important to keep track of, as they can dramatically affect how the market moves. Each scheduled release also has an “Impact” key that shows the expected effect the report can have on the specific region noted.

MarketWatch (www.marketwatch.com)
This is a good site for market news, especially related to stocks. The information is good to know, but remember that they are writers and not traders… so keep that in mind.

finviz – Financial Visualizations (www.finviz.com)
Great overview site for stock traders. This site gives “top 10” lists of specific pattern stocks and signals that have potential trading opportunities. It also gives a great “heatmap” which is a color-coded chart showing sector strength/weakness based on specific companies. It is also a good source for a newsfeed of headlines related to specific names. Lower on the page you can find info on Insider Trading and key Futures stats, including Forex and Bonds.

TradingView (www.tradingview.com)
TradingView is awesome. If you setup a free account, the charting is really good for a web-based application. It is so good that Hawkeye will be developing our suite of indicators specifically to run on TradingView in the near future, and we will host it on our own website, thus freeing you from the attachment to any specific platform. More about this as we get closer to the finish line. Anyway, I like this site because I can filter news based on my interests (specific stock for example). On a single screen, I can review the technical chart and beside it are all the headlines related to the stock on the chart. What a great time-saver.

Of course, there are many others, like Yahoo! Finance, Google Finance, Reuters, Bloomberg, CNBC, etc… I just highlighted my favorites. What is important is the overall sentiment you get from the major headlines and articles, not necessarily what is specifically written in the articles… remember, they are writers, not traders.

Thanks for following my blog.

Trade safe!


Join me in the next free LIVE Hawkeye Demonstration Room held every Wednesday at 9.30am EST US. You will learn more about volume and volume price analysis and see more examples and live trade setups. It is open to all.

Click this link for more information or to join us in class.

Learn to trade the Hawkeye way.

Randy Lindsey
Hawkeye Traders, LLC

Defining Risk in Your Trading

Do you know exactly how much you risk each time you place a trade?

In his recent article ‘The Commitment Secret’, Dr. Kenneth Reid challenged us to commit to an ongoing process of self-improvement. In today’s article, we want to consider the topic of trade risk.

Do you clearly define the point at which you will exit a trade if it goes against you?

If we trade without pre-defined exit points, our risk is infinite. As such, it is impossible to calculate the financial risk of that trade, and exposes our entire account to risk. Not only is this extremely bad for our pocket,  but it’s also a source of a immense emotional pain and psychological damage.

In this scenario, where would we exit the trade, and by then how big will that loss be?

Do you clearly define how much of your account you will risk on each trade?

If I enter a trade with the same lot size for each currency pair, then I am not defining my risk. Why? Because each currency pair has a different cost per pip. For example, one standard lot on the EURGBP is around $12.80 per pip, whereas one standard lot on the GBPAUD is around $7.50 per pip. So the risk on the two trades is not the same with an equal lot size.

Why should we define the risk on each trade?

If we consider how we bet on a horse race then the answer is quite simple.

The odds are calculated on the probability of a horse winning and we use those odds to define our trade parameters. So, for example, if the odds are 10:1 and I bet $1, then a win would return my $1 stake and $10 in profit. However, if my horse does not win then the bookie keeps my $1 bet. In this scenario, I fully understand that I will lose $1 if my horse does not win and I have considered it a worthwhile trade as I have the chance to make $10 by risking $1.

Now, if the bookie couldn’t tell me how much I will lose if the horse fails to win, but that it might be all the money in my account, (which, incidentally, he holds for me in his own bank account) would I then take a bet on that horse? I certainly wouldn’t – but yet, surprisingly, many traders do.

What are the benefits of defining and accepting the risks on each trade?

How about I say you can be the bookie (to define the trade odds) and then also the customer to take that trade? Well, that is just what we do when we trade.
So, for example, I could set a stop loss at -50 Pips and take profit at +100 pips (1:2 risk to reward) and then risk $100 on the trade. If the trade stops out I lose $100 but if the trade is a winner I will gain $200.

But just remember, as the bookie or as the customer, I have no way to determine or influence the outcome of the race, I am just defining my trade parameters and must accept the outcome.

The skill in trading is then to find high probability trades and to pre-determine the exit, which is the subject for another day.

How do we determine the risk in Hawkeye Tomahawke FX?

Hawkeye Tomahawke Chart

Using the Tomahawke method, we use a trade execution tool to place our trades quickly, as we are trading the shorter time charts.

This tool makes us place a stop in the charts. We think about and determine the point to exit that trade should it go against us. In the settings, we also pre-determine how much of our account we wish to risk on each trade (normally  ½ percent on each trade).

When we take a trade, the software automatically calculates the lot size given the number of pips to the stop and the total value we are risking on that trade. So, for example, if we are risking $100 on a trade with a 10 pip stop, then we risk  $10 per pip. The software calculates that as a lot size and enters the trade. Should the stop be hit, we will lose $100 and no more. We accept this as our defined risk.

I hope this article helps you to think about risk in your trades and how to become a better trader.


Join Me in the next free LIVE Hawkeye Demonstration Room held every Wednesday at 9.30am EST US. You will learn more about volume and volume price analysis and see more examples and live trade setups. It is open to all.

Click this link for more information or to join us in class.

Learn to trade the Hawkeye way.

Good trading,

Randy Lindsey
Hawkeye Traders, LLC

Multitasking

by Guest Columnist, Kenneth Reid, Ph.D

Hi… this is Dr. Kenneth Reid from HawkeyeMindset.com This week I’d like to discuss “Multitasking.”

Traders multitask to reduce anxiety and for neuro-stimulation. There’s an upside and a downside to this habit. Let’s take a look at how all this works and I’ll provide a link that will help you change this habit (or any habit) in just 5 minutes a day.

ANXIETY REDUCTION

Traders subscribe to news feeds and guru blogs or chat rooms to help explain and predict market movement. We naturally want to know “why” the market did X and not Y, and what it is likely to do next, because knowledge (even pseudo-knowledge) lessens anxiety.

The question then becomes: “Although you may feel better, how does that ‘knowledge’ actually affect your trading?”

Often theories and predictions work against us, because they are so subjective. If we have a theory about something it can be difficult to see the objective truth… if the truth doesn’t accord with our theory. And that disconnect can get us on the wrong side of the market.

For example, if you think the market ‘should’ go up, you will probably miss the entry for the short sale.

NEUROSTIM

Multitasking also provides neuro-stimulation, the universal antidote to boredom.

Some traders get bored almost immediately… and they absolutely hate it. For them, multitasking is like an ADD drug, because information, engagement, hyperfocus and risk are stimulants that induce a state of pleasant concentration and mild euphoria. It’s a dopamine high.

Consequently, multitasking for ‘neurostim’ can easily slide into trading addiction. Like a slot machine player, these traders are trading to trade. I’ve seen this addictive behavior in doctors and dentists who trade between patient visits or while a patient is getting prepped or numb.

I coached an anesthesiologist who traded in the hallway between operations, and a surgeon who traded forex from his hospital office. Both were losing money. The distraught wife of the anesthesiologist told me he had already burned through his kids’ college fund.

Trading addiction is also a risk for those who work from a home office. One client, a father of three, worked at home for a Fortune 500 company. He preferred to trade, so he did just enough corporate work to avoid drawing attention to himself. Although he was depleting his savings, he prioritized trading over his day job because he believed he was “on the verge of greatness.”

This particular (delusional) belief is common in male traders with Adult ADD or a trading addiction. They can’t see the self-deception, although spouses recognize it quite early… and it scares them.

NEXT STEPS

Reading about multitasking, or any other trader issue, is useful, but it’s not sufficient to actually change a sub-optimal trading behavior. You will forget about it in 5 minutes and go back to trading the way you always have. Nothing will really change.

However, if you are interested in reaching your full potential as a trader as quickly as possible then get on the fast track… join our new Mastermind Breakthrough program at Hawkeyemindset.com.

You get a weekly experiential video that will empower you to eliminate bad trading habits and install good ones in just 5 minutes a day. 50 videos a year on 50 practical topics essential for trading mastery. It’s the easiest way for traders to increase discipline and improve your trading on a daily basis.

The Mastermind Breakthrough videos are based on the same principles and techniques used by Olympic coaches and trainers for Navy Seals. Results have been phenomenal… and if you can afford Netflix, you can afford this service.

Go to www.hawkeyemindset.com/mastermind to find out more.


Join us in the next free LIVE Hawkeye Demonstration Room held every Wednesday at 9.30am EST US. You will learn more about volume and volume price analysis and see more examples and live trade setups. It is open to all.

Click this link for more information or to join us in class.

Learn to trade the Hawkeye way.

Good trading,

Randy Lindsey
Hawkeye Traders, LLC

The Commitment Secret

by Guest Columnist, Kenneth Reid, Ph.D

Hi… this is Dr. Kenneth Reid from HawkeyeMindset.com

Commitment

Every trader I’ve ever met or coached has been 100% committed to trading. When I ask…“When do you plan on retiring from trading?” I always get the same answer: “Never!”

But what are most traders really committed to?

Based on hundreds of coaching interviews, most aspiring traders are committed to various Outcomes… such as winning, making money, becoming wealthy, being right, figuring it all out.

While we all want these things, a commitment to Outcome, per se, can actually work against the aspiring trader. That’s the sticky paradox of trading for a living.

The Commitment Perspective Change

Over the years, I’ve noticed that there comes a time in every trader’s development when he or she needs to make a different type of commitment in order to achieve their full potential. Otherwise they stay permanently stuck at whatever level they are on.

To better understand this, I’d like you to listen to some words about commitment that continue to inspire me. They were written by a Scottish explorer and mountaineer who survived imprisonment in POW camps during WWII.

He didn’t just “face” challenges that befell him, he sought them out. He assumed risk. And in doing so, he learned a secret that literally saved his life. I think it’s something we all need to learn because trading is dangerous, too.

You can watch a free 3-minute video version of this article and hear his famous words here

(This article will have more impact/value if you listen to that video.)

The Commitment Challenge

So today I’m going to challenge all aspiring Hawkeye traders to make a commitment…not to an Outcome… but to an ongoing Process of self-improvement. What would you be improving exactly? Your ability to skillfully and effectively assume risk.

Having this ability gets us into “The Zone,” the sweet spot that lies between being foolhardy on the one hand, and risk averse on the other. As I mentioned in a previous article, another name for this mental-emotional state is ‘flow.’

And the happy paradox is that if we make a commitment to continuous self-improvement, we seem to encounter serendipitous support for achieving all our goals. This isn’t magical thinking…it’s the essence of mastery.

Next week I’ll discuss a way for Hawkeye traders to transform your commitment into highly practical action steps. Stay tuned.


Join us in the next free LIVE Hawkeye Demonstration Room held every Wednesday at 9.30am EST US. You will learn more about volume and volume price analysis and see more examples and live trade setups. It is open to all.

Click this link for more information or to join us in class.

Learn to trade the Hawkeye way.

Good trading,

Randy Lindsey
Hawkeye Traders, LLC

The Hindsight Trap (Part 2 of the Money Trap)

by Guest Columnist, Kenneth Reid, Ph.D

Greetings Hawkeye traders. This week I’d like to discuss a common trader issue that’s rather difficult to spot. I call it The Hindsight Trap.

Looking back on a cold chart, it’s natural to think that we could’ve, would’ve or should’ve known what was going to happen at those key inflection points. Indeed, hindsight reinforces a common trader belief that the market is predictable…at least by us. But this is a trap.

However, this assumption violates one of Mark Douglas’ key coaching principles: Anything can happen.

And if we didn’t catch that amazing move, hindsight also tends to foster regret and a subsequent imperative to not miss out. But when we adopt that particular imperative, which is half fear and half greed, traders become over anticipatory. We jump the gun and we become highly goal oriented.

And here’s the rub… the more important an outcome becomes, the more likely we will adopt the attitude that the end justifies the means. And once we switch over to that mode of operation, we tend to abandon discipline. Instead, we start to improvise. This is the hindsight trap.

To make matters worse, I believe there is a gender factor in this switching process: it happens so easily and quickly for men that we barely notice it… but less so for women. (Is this a testosterone issue? Probably. Men tend to be highly goal-oriented.)

True story: I was recently able to coach a woman to become a profitable futures trader in just three months, whereas men typically take quite a bit longer. The speedy progress was due to the student, not the coach.

Shelly was willing and able to follow very simple rules even when she was wrong, even when she lost, and even when she missed out. And she was willing to humbly accept that she couldn’t know what was going to happen next, so early on she just stopped guessing.

Bottom-line, she didn’t outsmart herself.

For Shelly, the inevitable obstacles and delays she faced in achieving her end-goal did not justify a change in means. She trusted her rules and focused on maintaining discipline, rather than being overly concerned about the result of her last trade.

If you want to reinforce a process-oriented Mindset in your trading, I have prepared a free video for you to download and listen to. The video has a special soundtrack, so for the best result, use stereo headphones. (And this week you don’t have to opt-in to download.) Enjoy!


Join Randy in the next free LIVE Hawkeye Demonstration Room held every Wednesday at 9.30am EST US. You will learn more about volume and volume price analysis and see more examples and live trade setups. It is open to all.

Click this link for more information or to join us in class.

Learn to trade the Hawkeye way.

Good trading,

Randy Lindsey
Hawkeye Traders, LLC

The Money Trap . . . and how to avoid it

by Guest Columnist, Kenneth Reid, Ph.D

Greetings Hawkeye traders, this is Dr. Kenneth Reid from HawkeyeMindset.com

In this article I’d like to discuss what I call The Money Trap… what it is, how to avoid it and the empowering state of mind you can achieve, if you succeed.

[This article is a summary of a video I produced with a special soundtrack that facilitates whole brain learning. You can download the video here]

As some of you may already know, I have a Ph.D. Clinical Psychology and I’ve been a trading coach for 16 yrs. I’m an active trader myself (stocks and futures) and I’ve been a Hawkeye user since 2007.

Whatever market or markets you trade, volatility ‘mean reverts.’ In other words, it oscillates from low to high and back again. During periods of high volatility even experienced traders tend to over-focus on their P&L because it fluctuates so much.

But once we start obsessing about money, we are already in The Money Trap.

HOW THE MONEY TRAP WORKS

The Money Trap in trading is like scoreboard pressure in sports. It’s the pressure athletes feel during the last few minutes of a close game… or at a key moment where winning the very next point is crucial.

In trading, however, the game never ends… unless we end it. And because we are putting capital at risk, each and every trade has “scoreboard” significance.
The Money Trap has us when we adopt these four internal Imperatives:

Don’t…

  • be wrong!
  • miss out!
  • lose money!
  • give back gains!

Many aspiring traders are caught in The Money Trap all the time, when they are trading a live account. These four (negative) imperatives are constantly running through their mind as they try to trade. And that’s a problem.

WHY YOUR BRAIN WORKS AGAINST YOU

Whenever our security becomes an issue… as it does when we constantly focus on money… our brain automatically goes into survival mode and constricts our field of mental and visual focus.

No matter how much screen real estate you have, the pressure to be right, not miss out, not lose, and not give back gains results in… tunnel vision. At critical moments, you will be gazing at an area of your screen about the size of a quarter!

This is why, when you look back over your trades later, you realize that you missed the obvious. (Maybe you were short when you should have been long… or vice versa.) But it’s even worse than that.

When your finger is on the mouse and you are hyper-focused on the price bars as they form, do you think you will remember to follow your trade management rules?

Brain research suggests the answer is ‘No.’

When we feel survival pressure, our prefrontal executive function is bypassed in favor of a faster circuit near the brain stem. That’s our reptilian brain… not our slower, more reflective human brain. So bye bye Hawkeye trading plan.

With your Lizard Brain in charge, you might cut your winners short, or chase price, or move your stop, buy high, sell low, double down or just freeze… all without actually thinking.

So how can you avoid The Money Trap; how can you stop your Lizard Brain from hijacking your trading?

THE SOLUTION

Fortunately there’s an effective solution. Let me give you an example from the world of elite sports because it applies to trading, too.

Have you noticed that the quality of athletic performance in certain Olympic events has increased dramatically over the last few decades?

In the 1980s a diver could make the Olympic team with a 1 ½ somersault. But in 2016 Michael Hixon needed to execute a perfect forward 4 ½ to qualify for the Rio Olympics. How was so much improvement even possible?

20th Century coaching culture was 100% focused on Outcomeon winning. Vince Lombardi summed it up: “Winning isn’t everything, it’s the only thing.”

In the 21st Century, however, peak performance coaches turned that success formula inside out. They realized that Outcome is beyond one’s control. So they began to encourage athletes to focus on Process not Outcome.

By not focusing on results, athletes had less stress. Less stress meant less “choking” and better adaptation to the circumstances at hand. Remarkably, athletes began to experience a peak performance state you may have heard of called ‘FLOW.’ And this was a game changer. These athletes had an edge few could compete with.

‘FLOW’ FOR TRADERS

In trading, the outcome of any particular trade is not only out of our control, it’s also randomized. According to Mark Douglas: “There is a random distribution between wins and losses for any given set of variables that define an edge.”

If you have a method with a 70% win rate, the 30 trades out of 100 that are losers will be randomly distributed in the time series. You can’t know in advance when they are coming.

If the Outcome of any particular trade is randomized by the market gods, does it make sense to adopt imperatives that imply we should attempt to control it?

Probably not.

In trading we have a choice… focus on Outcome (something we can’t control) or focus on executing our trading Process (method), which we can control.

Here’s the key point: cultivating a Process Mindset is the most effective way to reduce (even eliminate) the most common trader fears:

The Fear of:

  • Being Wrong
  • Missing Out
  • Losing Money
  • Giving Back Gains

Take a moment to imagine what it would be like for you to trade without fear. That’s the state of FLOW.

I’d like to leave you with the following question: What if creating and maintaining that state of mind became your primary goal as a trader?

(I’ll have a follow-up article next week. Until then, good trading and may the flow be with you!)


Join us in the next free LIVE Hawkeye Demonstration Room held every Wednesday at 9.30am EST US. You will learn more about volume and volume price analysis and see more examples and live trade setups. It is open to all.

Click this link for more information or to join us in class.

Learn to trade the Hawkeye way.

Good trading,

Randy Lindsey
Hawkeye Traders, LLC

Market Update and Insights

by Guest Columnist, Max Larsen, Future Finances, Inc.

This week we welcome Max Larsen, President of Future Finances Inc. to the blog as a guest columnist for a review of the week’s economic news. Max is a professional money manager, with $200 million under management and a long time user of Hawkeye.

1. Weekly Wrap
2. Technically Speaking
3. Business Optimism Goes Stratospheric
4. Inflation is Creeping In
5. Johnny Depp – A Lesson on What Not to Do

Weekly Wrap

The past week was rife with earnings, economic data and commentary from two major central banks, but the market shrugged off the busy event calendar remaining in its range bound ways.

The big news of the week was a decent jobs report with employers adding 227,000 jobs last month according to the Labor Department. This was the biggest gain since September although wage increases were rather modest. This from The Wall Street Journal (weekly summary from Briefing.com):

The backdrop of a steady but unspectacular labor market is likely to keep the Fed cautious about raising interest rates and could prevent the central bank from colliding with President Donald Trump as he aims for faster economic growth.

Indices Weekly Figures

We shouldn’t forget about earnings season. Our very own Brad Huffman chimed in:

In addition to a slew of economic reports, earnings season continued to unfold. These were generally supportive of the current trend. The most significant weakness has come from large multinational companies indicating concerns about overseas activity. Despite those concerns, both earnings and sales growth are poised to expand for the quarter.

Please remember that historically speaking February is one of the weakest return months of the year with the worst part coming towards the end. It may not happen this year. There is a lot of money flowing into stocks right now.

Technically Speaking

I have two charts to share today. The first is from Arthur Hill of StockCharts. He points out that it has now been 79 days since we’ve seen greater than a 1% decline in the S&P 500. Talk about “range bound”…

Just look at the bottom indicator called the ROC or rate-of-change. This is nothing more than how much the S&P 500 changed on a percentage basis on a daily basis. I high-lited the 79 days in blue. It denotes a strong market to me.

S&P 500 Chart

The second chart is one you’re very familiar with. This is the 8-months chart of the S&P 500 (daily prices). Notice how we came into the “Support” zone last week and bounced out on Friday.

S&P 500 Chart

I still contend that we are due for a pullback. It may not happen, but I could envision a minor correction to the “Critical Support” area (red high-lite) which would only be less than a 5% retracement and still well within the upward trend line and above the 200 day moving average. We’ll see…

Business Optimism Goes Stratospheric

We have gotten numerous emails and phone calls on people’s concern for the stock market’s lofty state. Once again here’s Brad Huffman on a nice reply that I had to share:

Thanks for the note. The market is responding to views that tax and regulatory changes from the new administration will help improve economic conditions. We do believe in the short term we will see a slight pullback (maybe 5%), but that would be normal and draw in new investors. The technical and fundamental pictures are pretty healthy right now, but volatility will remain present as it did last year.

We have several positions in the portfolio that help us hedge any market swings so unless we see significant deterioration in the charts, we are comfortable with the moderate risk exposure we have in the portfolio.

Brad is correct. Just take a look at the most recent NFIB Small Business Index.

NFIB Small Business Index Chart

Like its title says – it measures the business optimism on a quarterly basis. This stratospheric 38-point jump in the number of business owners who expect better business conditions is staggering.

Whether you like the President or not – and I know there are many who don’t – it is what it is and we have to live with it. That said, there is little doubt the WSJ’s headline hits it on the head: “Trump Pace Has Heads Spinning.” Many businesses are very encouraged that someone is finally attacking the mind-numbing regulations and restrictions.

Inflation is Creeping In

Consumer Price Index YTD ChartWe’re starting to see the possible resurrection of a little inflation. The Eurozone just reported a 1.8% rise in consumer prices while we’re hitting 2.1% in the U.S. The Wall Street Journal chimed in:

After years of fighting against deflation, the U.S., the eurozone and Japan show glimmerings of life in consumer prices and wages, evidence that an era of exceptionally low inflation is receding from the global economic landscape.

Several factors are behind the move, including a rebound in energy prices, falling unemployment which is reducing slack in some labor markets, and central banks’ low-interest-rate policies that spur lending and economic growth.

To be sure, any economic shocks could reverse this trend. Still, this is important since certain asset classes – like commodities and gold – tend to thrive in this environment. However, those sectors which are bond proxies – like telecom services and utilities – tend to do badly when inflation and interest rates rise. Be forewarned…

Johnny Depp – A Lesson on What Not to Do
Johnny Depp

Johnny Depp is having money problems and is suing his business managers for mishandling his finances. It turns out that it may not be all their fault and are counter-suing since the Pirate of the Caribbean star was spending more than $2 million a MONTH to maintain his lifestyle. In spite of repeated warnings he is now having serious money problems. This from CNBC.com:

The lawsuit said Depp paid more than $75 million to buy and maintain 14 homes, including a French chateau and a chain of islands in the Bahamas.

Depp also spent heavily to buy a 150-foot yacht, fly on private jets and cultivate collections of fine art and Hollywood memorabilia requiring 12 storage facilities to maintain, the lawsuit said.

$2 million per month and $75 million in non-income producing assets? What could possibly go wrong? He’s obviously a very talented actor yet it boggles the mind that he could be so inept with his finances – whether he had an advisor or not… You can read the entire article HERE.

That’s more than enough for this week my friends. Congratulations to the New England Patriots. Wow, what a game. Multiple records broken – including the biggest comeback in Super Bowl history. It just goes to show you – never give up. Have a fantastic week!


Join us in the next free LIVE Hawkeye Demonstration Room held every Wednesday at 9.30am EST US. You will learn more about volume and volume price analysis and see more examples and live trade setups. It is open to all.

Click this link for more information or to join us in class.

Learn to trade the Hawkeye way.

Good trading,

Randy Lindsey
Hawkeye Traders, LLC

Hawkeye Welcomes 2017 with Many New Updates

2017-happynewyear-hk-1400x750-1024x549

As we begin 2017, the entire Team at Hawkeye Traders wish you and yours all the best for a healthy, prosperous, and bright New Year!

The incredible support from you and the rest of our extended Hawkeye family of informed and engaged traders is what makes our work possible and enjoyable. We are deeply grateful!

We have many exciting updates planned for you this year. Below are some of the new updates coming your way from Hawkeye Traders:

  • Hawkeye Clubhouse – weekly live training, free indicators, special discounts, and more…
  • NEW Hawkeye 2-Day Basic Training Workshop (in-person and online)
  • NEW Hawkeye 2-Day Advanced Training Workshop (in-person and online)
  • Hawkeye Tomahawke is now available for NinjaTrader 7
  • Hawkeye will launch MT4Professional.com very soon… stay tuned!
  • and Lots of new indicators.

We want to help you make 2017 the best year ever. Together, we can make concrete strategies from your new year’s resolutions, transforming your ideas into accomplishments!

On behalf of everyone at Hawkeye Traders, thank you – and Happy New Year!

Randy Lindsey
Hawkeye Traders, LLC

P.S. Don’t forget to sign up for our live demonstration room held every Wednesday. Open to all.


Click this link for more information or to join us in class.

Part II – Why Volume is So Important

In last week’s video newsletter, I highlight a short trade in GBPJPY which was a beautiful example of volume leading the way to price action. In that example, I used a lot of the Hawkeye tools in harmony to show volume and price action working together (the edge using volume).

Today, I want to show you “Part II of Why Volume is So Important” from the perspective of Hawkeye Volume tools ONLY. You should see quite easily how understanding Hawkeye Volume can give you a distinct advantage (the EDGE) in your trading.

Why Volume Is So Important - Part II (Video)

Last week’s video newsletter was shown on the NinjaTrader Platform. Therefore, this week’s video newsletter was shown on the MT4 platform. Hawkeye tools work in any market and any timeframe, to give you the volume edge you are looking for.

Join me in the next free LIVE Hawkeye Demonstration Room held every Wednesday at 9.30am EST US. You will learn more about volume and volume price analysis and see more examples and live trade setups. It is open to all.

Click this link for more information or to join us in class.

Learn to trade the Hawkeye way.

Good trading,

Randy Lindsey
Hawkeye Traders, LLC

Why Volume is So Important – Volume Leading Price

In today’s video blog, I highlight a short trade in GBPJPY which is a beautiful example of Hawkeye Volume leading the way to price action. This shows why using Volume in Forex trading is so important.

The Hawkeye Volume tools were spot on again. As a result, the potential for good profits is high.

092416 Video Blog

This example showed Volume leading the way to price action. Using volume in your trading is important. Coupled with price action, it is the Edge you have been looking for.

Be sure to join me in the next LIVE Hawkeye Demonstration Room.

Join me in the next free LIVE Hawkeye Demonstration Room held every Wednesday at 9.30am EST US. You will learn more about volume and volume price analysis and see more examples and live trade setups. It is open to all.

Click this link for more information or to join us in class.

Learn to trade the Hawkeye way.

Randy Lindsey
Hawkeye Traders, LLC

Market Meltdown – Hawkeye Knows

So many market pundits are saying a market meltdown is here etc. Well, Hawkeye Volume does not lie. Today, I’m going to show you why looking at volume will tell you if the market meltdown is here or not.

Emini Daily Chart – Market Meltdown?

Daily Emini Chart

Look at the Hawkeye Volume circled at the bottom of the chart. It’s white for the last four days showing no demand, i.e. the sellers or buyers are not in control. A meltdown would show increasing red selling volume.

Then look at the price where the magenta arrow is. See how the price came up and touched the Hawkeye dot and then backed off – classic price action. Until the daily price breaks the last Widebar (magenta), price will go sideways, but with no advancing volume prices will remain in this range. Price needs high volume to commence a down trend or for the market to meltdown.

Emini Weekly Chart – Market Meltdown?

Weekly Emini Chart

Last week red volume but not high volume. As on the daily markets require high volume to reverse.

And following 6 ways a market moves the Hawkeye Trend dot has gone flat, so we are in congestion waiting for the next isolated or phantom low to show congestion parameters.

Emini Monthly Chart – Market meltdown?

Monthly Emini Chart

Interesting. Look where the dotted line and the magenta arrow are – a doji. If this month does NOT take out the high of doji a Hawkeye Pivot will form which could push the market down for 3,5,7 timeframes. Hawkeye volume knows if the market meltdown is real or not.

[The magenta arrows are for illustration only and do not form part of the software]

Join Randy in the next free LIVE Hawkeye Demonstration Room held every Wednesday at 9.30am EST US. You will learn more about volume and volume price analysis and see more examples and live trade setups. It is open to all.

Click this link for more information or to join us in class.

Learn to trade the Hawkeye way.

Final Note from Nigel

This will be my last blog post. I am retiring from the day to day work of Hawkeye and I have sold the business to my old partner Randy Lindsey. It has been wonderful to have been a small part of seeing so many of the ‘Hawkeye family’ not only go on to be such successful traders but also become close friends, and I am sure I will still attend the live seminars when invited.

When Hawkeye started back in the late 80s, I certainly never have thought there would be nearly 4,000 traders now using my volume algorithm. Please learn volume; 6 ways a market moves; find the right timeframe for you – as slow as possible; do a lot of work on your mental approach; money management/risk reward; and stop searching for the next indicator.

Farewell my friends and Good Fortune,

Nigel Hawkes
Hawkeye Traders

How to Make Money from a KISS

Make money from a KISS. If you trade the Emini, the Hawkeye KISS gives you a big heads up and saves you a minus trade.

Based on all the stocks on the NYSE, Nasdaq and Amex, the KISS represents if more stocks are being bought or sold. For example, if the red line is rising it shows that more stocks are being sold across all markets and vice-versa for the green line.

Hawkeye KISS

KISS

In this example above, you can see the 3-minute KISS just starting to show a sideways movement. This indicates a pause, or a possible reversal in price. The KISS is not showing any buying as it would require the green line to rise with conviction. As a result, we should sit on our hands and wait.

Let’s now look at the price.

Blue Tick Speed Emini

ES Blue

Where I have placed the cyan arrow the program indicated a Volume Roadkill long entry, which was not elected.

Why? Well lets look at the yellow and red tick speeds.

Red and Yellow Tick Speeds Eminii

ES Yellow & Red

As you can see the Heatmaps (the indicator on the bottom of the charts) are red, and the trend on the price dots show trend run down.

Hawkeye Perspective
By combining all three tick charts and seeing what the underlying stocks are doing across the exchanges, there was FAR too much risk in a long entry off the blue timeframe. Therefore, no trade was the right trade, and saved us a losing position.

We demonstrate this and many other methods in our live demonstration room held every Wednesday, and this is open to everyone. Click this link for more information or to join us in class.

Good Fortune,

Nigel Hawkes
Hawkeye Traders

[The magenta and cyan arrows are for illustration only and do not form part of the software]

An Important Week for the British Pound

This coming week will be very important for the British Pound.

Why? Well look at the Hawkeye Fatman.

Fatman Daily Chart

Fatman Daily

I have deleted the other currencies so we can clearly see the USD (cyan) and GB Pound (brown).

At the first cyan arrow the two currencies are trading in the same direction, followed by the magenta arrow where they are again both in the same direction. On the daily chart below this is represented by the white congestion dots on the Hawkeye Trend.

But now look at the second cyan arrow, the USD is rising and the Pound continues to decline.

GBPUSD Daily chart

GBPUSD Daily

I have displayed just the volume off the daily chart shown on the middle plot, and have used the Roadkill 3-day volume on the bottom plot.

Note that the volume has shown no demand on the 3-day (white volume), reverting to selling volume on the last 2 bars. The daily volume above has 6 bars of selling.

Now look at the price. The Hawkeye Trend has gone back into downtrend. I have placed a yellow line from the last major Hawkeye Pivot, if this is taken out, LOOK OUT! It is in freefall.

We demonstrate this and many other methods in our live demonstration room held every Wednesday, and this is open to everyone. Click this link for more information or to join us in class.

Good Fortune,

Nigel Hawkes
Hawkeye Traders

[The magenta and cyan arrows are for illustration only and do not form part of the software]

A Rookie’s Mistake

Here is a common mistake that rookies make.

Gold Daily Chart

This is the daily gold chart, but it applies to all markets and all time frames.

A Rookie’s Mistake

Here is the mistake.

A Hawkeye Pivot is formed at the yellow arrow. Most rookie traders will draw a line off the high (the blue line).

WRONG.

You need to draw a line off the low of the bar as well (the yellow line). If it was just off the high of the bar then it was only touched twice.

BUT off the low it was hit eight times. So now you understand that this is a major resistance area.

BY DOING THIS YOU HAVE INCREASED HOW YOU PERCEIVE THIS AREA BY A FACTOR OF FOUR.

We demonstrate this and many other methods in our live demonstration room held every Wednesday, and this is open to everyone. Click this link for more information or to join us in class.

Good Fortune,

Nigel Hawkes
Hawkeye Traders

[The magenta and yellow arrows are for illustration only and do not form part of the software]

Where The Money Is.

One of the main questions I am asked is – what market shall I trade?

My answer is – any one where there is a feeding frenzy.

At the moment this is the British pound, the grain and agriculture complex, gold, oil, and to specialise in one market intra-day I recommend the US bonds.

And most important of all is the timeframe. PLEASE do try and trade the longer timeframes, that’s where the money is.

So let’s have a look.

Hawkeye FX GBP
FXGBP Daily Charts

Here is the new colour coded Hawkeye Tomahawke chart of all the GBP crosses.

See the many opportunities to trade on big news with Brexit. But this can also be replicated with the Euro.

Soy Beans and Hogs
Soy Beans

Live Hogs

Examples of the grain and agriculture markets. As you can see these markets are in defined trends.

US Bonds
I love this market. Why? Because you get long, defined trend runs.

US Bonds Weekly Charts 
Bonds Weekly

Just look at the weekly uptrend since the beginning of 2016, making sure you only take long trades on the daily chart.

Now, if you go to your intra-day charts you know only to look at long trades where there is lower risk.

US Bonds Daily Charts
US Bonds Daily Chart

By reading the chart the Hawkeye way, using volume and price, you can clearly see a recent double top. Two yellow dots (indicated by the magenta arrows) at the last market high, then retracing to the Hawkeye stop at the green crosses (indicated by the cyan arrow).

You know you are in congestion and pull back in the weekly trend. So, only longs to be considered till the weekly changes to a down trend.

We demonstrate this and many other methods in our live demonstration room held every Wednesday, and this is open to everyone. Click this link for more information or to join us in class.

Good Fortune,

Nigel Hawkes
Hawkeye Traders

[The magenta and cyan arrows are for illustration only and do not form part of the software]

Gold Mining Shares ETF Give Big Bangs for the Bucks.

Last week gold went up 2% but the gold miners’ index, ETF GDX, rose 11%.

But be careful. We are highly overbought on gold and gold miners’ stocks GDX and should expect a pull back soon within the overall uptrend. In fact, a recent report from Morgan Stanley Australia, states that miners are now extremely overvalued. Example: Newcrest Mining (NCM.Australia) trading at $21.76 Australian Dollars, compared to fair value of $A12.90. That’s 68% overvalued.

Gold 133 Minute Chart (GLDV Golds ETF)
Gold Chart
The 133-minute chart (a third of a day that the ETF trades) shows a classic volume upthrust, followed by 2 bars of no demand volume indicating a probable pullback.
 
GDX 133 Minute Chart
GDX 06-13-16
The ETF of the gold miners is clearer. Again a volume upthrust, but look at the Trend dots. They are going flat, indicating this move is now in congestion entry, so expect a pullback in the overall uptrend.

[feature_box style=”26″ only_advanced=”There%20are%20no%20title%20options%20for%20the%20choosen%20style” alignment=”center”]

Definition of an Upthrust
An Upthrust Bar is a wide range bar, with a high volume and closing down. It indicates that the prices were marked up during the day, trading activity was high as indicated by the high volume, and the prices dropped to near the low (or to the low) towards the closing hours.

[/feature_box]

We demonstrate this and many other methods in our live demonstration room held every Wednesday, and this is open to everyone. Click this link for more information or to join us in class.

Good Fortune,

Nigel Hawkes
Hawkeye Traders

[The magenta arrows are for illustration only and do not form part of the software]

Here We Go. Nearly There on Gold.

We are nearly there on Gold. Friday saw a big move, and as I have been banging on about for some months, there will be great opportunities this year.

So let us look at GDX, the gold miners ETF, which is a leading indicator for the gold price.

Daily Charts GDX
Daily GDX
As you can clearly see (indicated by the cyan arrow), ultra high volume resulting in the daily price commencing a new uptrend.

My favorite stock for gold is Newmont Mining (NEM). So let’s take a look at some charts.

Newmont Mining Weekly
Newmont Weekly Chart

Look at the last Hawkeye Pivot low (yellow dot). This is pushing price up on buying volume. So the last Pivot highs (shown with the yellow dotted line) are being tested.

Newmont Mining Daily
Newmont Daily Chart
Interestingly the high volume bar (with the yellow dot) occurred in price congestion, followed by declining volume, indicating accumulation (see my free volume book here for further information), resulting in the price commencing a trend run. But it has still to break the Pivot highs to the left (indicated by the yellow dotted line). When it does, with no part of the price bar straddling the dotted line, then we know we are in a strong uptrend.

Hawkeye Perspective
Nearly there! Be patient, this coming week will tell all.

We demonstrate this and many other methods in our live demonstration room held every Wednesday, and this is open to everyone. Click this link for more information or to join us in class.

Good Fortune,

Nigel Hawkes
Hawkeye Traders

[The cyan and magenta arrows are for illustration only and do not form part of the software]

Big Bucks to Me on the British Pound

Big bucks to me on the British Pound! With the referendum on the UK’s exit from the European Union in June, there are going to be violent moves with the GBP.

So let’s get set to benefit from this wonderful opportunity.

Overall chart setups that Hawkeye has identified in all timeframes, Trend set to conservative speed.

The Monthly price is in a downtrend. The Weekly price is also in a downtrend bias, but now in congestion with Pivot high two bars back.

So let’s look at faster time charts.

Daily Chart
GBP Daily Chart
Although in congestion bias up, the volume turned to no demand on Friday and there are two Pivot highs pushing the market down.

Intra-minute Charts

120-minute Chart
GBP 120-Minute Chart
Down day Friday.

60-minute Chart
GBP 60-minute Chart
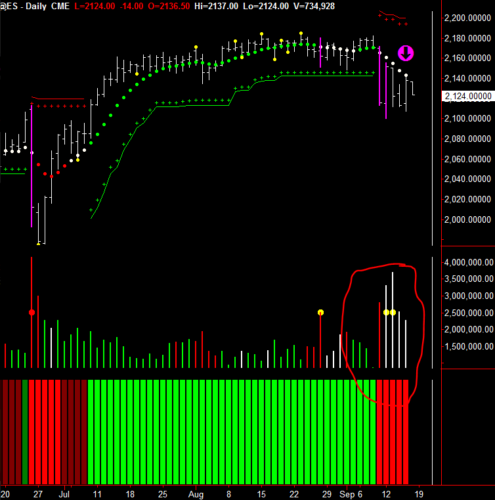
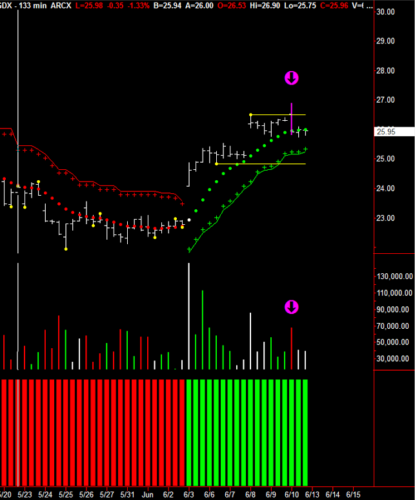
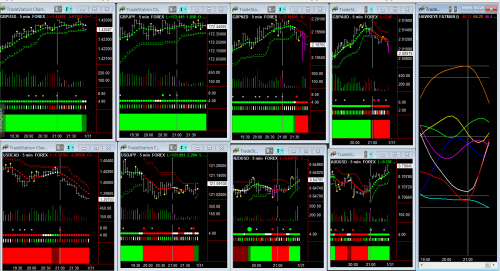
Great short at 10.00am Eastern.

30-minute Chart
GBP 30-minute ChartAnother great short at 05.30am Eastern.

Hawkeye Perspective 
Please look to trade the GBP crosses at your preferred speed. That’s where the action will be for the next 4-6 weeks. So big bucks to me on the British Pound.

We demonstrate this and many other methods in our live demonstration room held every Wednesday, and this is open to everyone. Click this link for more information or to join us in class.

Good Fortune,

Nigel Hawkes
Hawkeye Traders

[The magenta arrows are for illustration only and do not form part of the software]

Brace Yourself!

Brace yourself! Over the next few weeks the market will test the last Hawkeye weekly Pivot high, and then test the last weekly Pivot low at 2030. It’s also forming a weekly wedge profile and when broken – so watch out!

Let us recap on the last few weeks.

The S&P appears to be in the first stage of breaking down. We have a triple top on the Monthly, congestion entry on the Weekly and downtrend on the Daily.

Apple, as mentioned last week, broke down. The next test will be the Hawkeye weekly Zones at $76.

BUT here is the big story. Retail is in a bad, bad way. Profits are plunging for Macys, Kohls, Nordstrom, and Gap stores.

PacSun, Aeropostale and Quiksilver have filed for bankruptcy.

Amazon is doing great, but is that because the retail pie is shrinking or have people really changed their buying habits?

A great quote I found on the web:

“A wise man once said, our entire economy is based on folk buying stuff they don’t need, with money they don’t have…on credit. When that is shaken, and folk realize they don’t really need that new pair of shoes, or their 30K mileage car will last a couple more years…We’re toast.”

So what does Hawkeye say? Let’s look at one of the retail Exchange Traded Funds (ETFs) – RTH.

Monthly Chart
Monthly ETFRTH
Triple top in congestion and Hawkeye Volume showing two months of white no demand volume.

Weekly Chart
Weekly ETFRTH
The price was rejected twice when it tried to break through the Hawkeye stop area. Trend is white and in congestion and three weeks of no demand and the last week selling volume.

Daily Chart
Daily ETFRTH
A Pivot high, indicated by the magenta arrow, is pushing prices down, with the Hawkeye Volume in downtrend.

Hawkeye Perspective
Brace yourself! We are at major turning points on many sectors. So many opportunities to trade options and ETFs.

We demonstrate this and many other methods in our live demonstration room held every Wednesday, and this is open to everyone. Click this link for more information or to join us in class.

Good Fortune,

Nigel Hawkes
Hawkeye Traders

[The magenta arrows are for illustration only and do not form part of the software]

Learn This Trick: It Will Make Money

As you know I have been bullish on gold since mid-December and closed out my long positions last week and am waiting for a pullback and a re-entry.

What made me want to close my position?

I’m showing you two charts and this technique can work on any multiple timeframes that you might be trading.

Monthly Gold Chart
Gold Monthly Chart
You can see at the end of February the Hawkeye Volume turned green, Heatmap dark red and there was also a Hawkeye Pivot two bars previously, indicating that we will have 3,5,7 bar reaction from this point.

The price goes up as expected and has reversed off the Hawkeye stops, which on the slower time frame always acts as resistance

Daily Gold Chart

Gold Daily Chart
The magenta arrow shows the red Volume has entered the market. This coincided with exactly the same point on the daily chart as the monthly chart when the price stalled at the monthly Hawkeye stops.

I have placed a dotted yellow line and also a down magenta arrow where this took place.

Hawkeye Perspective
Strategy for the upcoming week – I now want to see the daily finding support at the daily stop level and reverse to the upside in harmony with the weekly and the 133-minute chart.

And when the monthly stops are broken this market will truly be on its way.

You can use this method on any instrument you might be trading and any multiple time frame.

I will be teaching this at the upcoming April online webinar and encourage you all to come and register to really learn how to drive the Hawkeye engine. As long as you register you will receive the recorded webinar so you don’t have to be actually present to benefit from this education.

Hawkeye Traders Annual Online Conference

We demonstrate this and many other methods in our live demonstration room held every Wednesday, and this is open to everyone. Click this link for more information or to join us in class.

Good Fortune,

Nigel Hawkes
Hawkeye Traders

[The magenta arrows are for illustration only and do not form part of the software]

Get Ready To Say Bye-Bye To The Euro

Just before Christmas, I said that 2016 there would be a great trade in gold and that certainly is the case so far. So I hope some of you loaded up on the one stock that I really like – Newmont mining, NEM.

Say Bye-Bye to the Euro

Now it’s the turn of the Euro, so get ready to say bye-bye to the Euro.

Europe is in a mess, with a huge migration problem and steady discourse between member states on how to react to this problem. This ultimately, I believe, will be the catalyst that drives the Euro path as each country looks after its own interests and citizens. Unlike America, with just one central bank, each country in Europe still has its own central bank. Each of these banks can make their own decisions, which ultimately each will do.

The Euro since 2008 has had a 32% decline and this is supposed to be a major currency. So let’s look at the charts as I believe we will have a great opportunity to trade on the short side.

Euro Monthly Chart
Euro Monthly Chart

Since the beginning of 2009, the Euro has been in decline. And right now, it is entering congestion on the monthly chart with overhead resistance (where I have placed the blue line). However, if the low of 2015 is taken out, brace yourself!

Euro Weekly Chart
Euro Weekly Chart

This market timeframe is displaying classic congestion with choppy volume between selling, no demand, and short-lived rallies on buying volume.

Notice where the price went right up to (where I have placed the magenta arrow) which coincides with the Hawkeye barrier which generated a yellow Pivot.

We now need to see this market come back and take out those April lows

Euro Daily Chart
Euro Daily Chart

As you can see from where I have placed the cyan arrow, the price is choppy and the Hawkeye Trend dots have gone flat, signaling more congestion.

We now wait for a Hawkeye Pivot high to come in, which will push the market back down. And subject to a close under the low Pivot 1.0825, congestion will end, with an exit to the downside. This will trigger our entry into this trade. Bear in mind that the other timeframe resistance and support areas must support this move.

Hawkeye Perspective

As I have with gold, I’m highlighting a position trade here which could last for several months. Eventually, I do believe a great opportunity will come our way this year.

We demonstrate this and many other methods in our live demonstration room held every Wednesday, and this is open to everyone. Click this link for more information or to join us in class.

Good Fortune,

Nigel Hawkes
Hawkeye Traders

[The magenta and cyan arrows are for illustration only and do not form part of the software]

Not Too Late To Reap These Rewards

I will keep it short this week as I wish to follow on from last week that we have the opportunity in the GBP pairs for substantial gain.

Do try and trade the longer time frames and hold even if it is a micro lot.

If you feel you have missed the market just wait for a pullback in the faster time frame.

In this example below on the 480-minute (a third of a day) the magenta arrow shows the start of a downtrend.

GBPJPY 480 Minute Chart

GBPJPY 480 Minute Chart

The daily and weekly charts are also in a downtrend.

GBP Daily & Weekly Charts
GBPJPY Daily Weekly Chart 1
GBPJPY Daily Weekly Chart 2

Wait until the 480 minute pulls back to green, then heads back to red. Now you have all three in the same direction and you can take a low-risk trade.

This technique applies to any three time frame set up.

I would also like to congratulate Chris T., who is a Hawkeye trader, in his first month of going live from sim achieved 386 pips. Good work!

We demonstrate this and many other methods in our live demonstration room held every Wednesday, and this is open to everyone. Click this link for more information or to join us in class.

Good Fortune,

Nigel Hawkes
Hawkeye Traders

[The magenta arrows are for illustration only and do not form part of the software]

Great Forex Opportunity and the Hawkeye View on Crude

Forex GBP
There is fundamental news over the next week on the GBP as the UK tries to negotiate a better package with its membership of Europe, which will result in an in/out referendum.

The markets don’t like uncertainty so there will be many fabulous opportunities to trade the GBP FX Pairs.

GBP Pairs Daily Charts
FX Pairs Daily Chart 1
FX Pairs Daily Chart 2

All are exhibiting a downtrend and the magenta arrow on the daily Fatman shows there is still some way to go.

All are at critical support levels and this coming week will show if this support holds.

GBP Pairs Weekly Charts
FX Pairs Weekly Chart 1
FX Pairs Weekly Chart 2
All Pairs except the GBPCAD are in downtrend with little support below.

The cyan arrow on the Fatman shows oversold. But with the daily Fatman still in downtrend the weekly could stay down here for some time.

How To Trade
Go and look at the lower time frames i.e. 30 minutes, and only take shorts.

Crude Daily Chart
Crude Daily Chart

Regardless of production cuts, or what is said at the next OPEC meeting, crude oil is still in a strong downtrend.

You can see whatever positive news props the market up for a day or two is quickly met with sellers.

The market has not had more than three positive days in a row in well over a year.

Rallies should be viewed as selling opportunities.

Hawkeye Perspective
When a market has been in a downtrend for this long it is not going to turn around quickly.

It is going to take much more than one country cutting production to put a bottom in crude.

We demonstrate this and many other methods in our live demonstration room held every Wednesday, and this is open to everyone. Click this link for more information or to join us in class.

Good Fortune,

Nigel Hawkes
Hawkeye Traders

[The cyan and magenta arrows are for illustration only and do not form part of the software]

Market Update. Not Too Late For Gold?

SPY
Yesterday buyers stepped in as the second half of the trading day developed.
SPY Charts 02-15-16
This can be interpreted in two ways.

First, as profit-taking ahead of the long weekend, which is normal.

Second, that the market tried twice to break lower and failed.  As far as technical analysis goes, 80% of breakouts fail at the first attempt.

So next week will confirm if this is indeed the start of a bounce.

Gold
For those who follow my Newsletter, you know that prior to Christmas, I went bullish on Gold and chose NEM Newmont Mining as my preferred stock to trade this move.

Lets look at the charts.

Gold Charts 02-15-16

A low-risk entry at the end of 2015 when the 133-minute chart clicked into the upside. I was stopped out on February 25, but will reenter if last week’s high is taken out by a close.

Hawkeye Perspective
After such a strong move lower, the odds of some sideways trading action is very high.

Markets don’t just fall off the chart; they run, then consolidate, then run again.

I believe we are in the beginning of a consolidation period.

We demonstrate this and many other methods in our live demonstration room held every Wednesday, and this is open to everyone. Click this link for more information or to join us in class.

Good Fortune,

Nigel Hawkes
Hawkeye Traders

My Favorite FX Pairs

Today, I want to show you my favorite FX pairs. I am showing you my main workspace this week.

Favorite FX Pairs

These are my favorite FX pairs that seem to give constant results. One of the problems with FX is that there are so many pairs. So, I stay focused and just look at these on any time frame.

Look at the 15 minute Fatman on the right of the chart which shows the pairs with the lowest risk of trading. I look at the extremes.

Look right at the end of the day to see the British pound (brown line) became overbought and the Aussie dollar (red line) started to rise from oversold, as was the CHF.

I suggest you don’t trade the CHF as it has a large margin requirement.

If you change this chart to 30 minutes the same powerful setups are there. Remember the Fatman changes to 90 minute.

It still amazes me how the Fatman hits the trades on any time frame – right on the nail.

We demonstrate this and many other methods in our live demonstration room held every Wednesday, and this is open to everyone. Click this link for more information or to join us in class.

Good Fortune,

Nigel Hawkes
Hawkeye Traders

Full Analysis on the S&P

With so much in the news regarding financial meltdown, let’s take a good Hawkeye look at the eMini.

Monthly S&P Chart
Daily S&P

Firstly look at the Hawkeye Volume – three months of no demand and one month of selling volume, giving you the heads up that the dominant uptrend was going to retrace.

Now, look where I have placed the dotted lines on the price. The higher one shows a double top with the two Hawkeye Pivot dots in yellow, the lower dotted line shows where price came to and found support right at the Hawkeye stops (indicated by the green crosses).

6 Ways a Market Moves shows congestion, and if prices rise next month a Hawkeye Pivot low will be printed. However, if the low of this monthly bar closes under the Hawkeye stops, a down trend will be established.

Weekly S&P Chart
Weekly S&P

A congestion break-out to the downside found support where I have started the blue line on price. Now look at Hawkeye Volume – although a major price move was not accompanied by ultra high volume, just high volume, and at the end of the week, Friday Hawkeye Volume shows buying volume. And if next week is up, a Hawkeye Pivot low will be established

Daily S&P Chart
Monthly S&P

Now it gets interesting. Remember what I teach at Hawkeye seminars – “The Tanker Effect”; when the markets are fast and volatile price shoots through the previous support. Look at the lowest price bar. Three days back it straddled both previous lows (shown by the blue lines on the chart), and rallied on buying volume, followed by two days of neutral volume indicating support as shown by the price action.

And now the final piece. 6 Ways a Market Moves. Look at the Trend dot crunching right up, still down so still a trend run. But if Monday is up the dot will go flat indicating congestion entrance.

We demonstrate this and many other methods in our live demonstration room held every Wednesday, and this is open to everyone. Click this link for more information or to join us in class.

Good Fortune,

Nigel Hawkes
Hawkeye Traders

[The cyan arrows and red lines are for illustration only and do not form part of the software]

Make-Your-Mind-Up Time on US Bonds

Its make-your-mind-up time this week on the 30-year US Bonds. They have been in a range for the past year; with the FED raising interest rates one would think Bonds would sell off, but the opposite is happening, suggesting the market does not expect another rate raise for some time.

So let’s look at the charts.

US Bonds Weekly Chart
As you can see, the price touched the upper Trend line on Friday and closed at its highs. Also the volume has seen buying for the last 6 weeks supporting this price move. However, there is overhead resistance to break through on the daily.

US Bonds Daily Chart
Hawkeye Zones clearly show resistance all the way up to 163, and buying volume is accumulating. So if these Hawkeye Zones are breached, its off to the races, and if it stalls out and breaks under 153 a downtrend will be in place.

Hawkeye Perspective
An interesting week ahead with all the turmoil in the markets. Let’s look to Bonds for a great trading opportunity.

We demonstrate this and many other methods in our live demonstration room held every Wednesday, and this is open to everyone. Click this link for more information or to join us in class.

Good Fortune,

Nigel Hawkes
Hawkeye Traders

[The cyan arrows and red lines are for illustration only and do not form part of the software]

Are We In Crash Mode? – HAWKEYE Has The Answer

Firstly I do hope you opened the email announcing the International Trading Profits Summit in beautiful, warm Palm Beach, USA in March. I really have assembled a wonderful team of traders to give you the tools and knowledge to make 2016 a fabulous year. Extended to three full days and kept at the same price of $750. So please come along.

Secondly, I wish you a very Happy and Prosperous New Year!

So, lets jump right in and take a look at what the new year is bringing in. All financial letter writers will be talking about the first week of trading, and in particular the stock markets, which have all had nearly a 10% down move from the 2015 highs.

With the markets rallying in the morning session only to be sold off in the afternoon, this the typical thumbprint of a market in crisis, with the bias to the downside. But let’s look at Hawkeye and the charts.

ES Monthly Chart
ES Monthly Chart

You can see where I have placed the yellow dotted line there had been four attempts to break that price, but now we are in congestion. With the Trend dots flat and white, and support off the Hawkeye Zones at 1785, and volume showing no demand and bias to the downside.

ES Weekly Chart
ES Weekly 01-11-16

This makes it all far more visible. Price rejected off the Hawkeye Zones and testing the Hawkeye Zone at 1887. Interestingly, Friday’s volume was normal and close to the bottom of the range which leads me to think that it was an amateur down bar. If the professionals were selling there would have been far more volume.

ES Daily Chart
ES Daily 01-11-16

This really does tell the story – the downtrend on Thursday gave high volume followed by average volume on Friday. Again suggesting amateur selling not professional.

Hawkeye Perspective
This week will tell all. There was good jobs news last week in the USA and the market should have rallied. So let’s see if it finds support off the daily and weekly Zones and rallies.

We certainly don’t want to be long until Hawkeye gives it to us on the daily and weekly. Major support is at hand. But with China in free fall, anything is possible

We demonstrate this and many other methods in our live demonstration room held every Wednesday, and this is open to everyone. Click this link for more information or to join us in class.

Good Fortune,

Nigel Hawkes
Hawkeye Traders

[The red arrows and lines are for illustration only and do not form part of the software]

Do You Have Patience?

do you have patience?

Do you have patience? I had an extremely distressing email this week from a user who after my last gold email went long. I specifically said that gold was in accumulation and would zigzag till weekly resistance was broken. AGAIN THIS REINFORCES THAT THESE NEWS LETTERS ARE FOR EDUCATION ONLY.

So lets look at gold again and my opinion has not changed 

Weekly Gold Chart

Gold Weekly Chart

The price is in a Hawkeye Zone, indicated by the cyan arrows. Now look at the Volume – four red and one green bars, followed by two red bars. But the last two red Volume bars have no effect on the price. The Zones are holding and the Hawkeye Trend dots are starting to go flat = no momentum.

Daily Gold Chart

Gold Daily Chart

Thursday there was a down day and volume was rising, but not enough with the range of the bar to show aggressive volume. Hence, on Friday the price rallied and closed at the Hawkeye Trend dot on declining volume, indicating no follow through on the previous selling.

Look at the two dotted lines indicating the congestion zone.  I do hope you guys really study the Six Ways a Market Moves.

Hawkeye Perspective

Do you have patience? Hawkeye shows that Gold is still in accumulation mode, and the longer term bias is short. So wait until the weekly goes long. Nevertheless, it could be a great trade for 2016.

We demonstrate this and many other methods in our live demonstration room held every Wednesday, and this is open to everyone. Click this link for more information or to join us in class.

Good Fortune,

Nigel Hawkes
Hawkeye Traders

[The cyan arrows are for illustration only and do not form part of the software]

Using the Fatman to Get Fat

Using the Fatman to get Fat

Using the Fatman to get Fat. There has been a lot in the Hawkeye Skype room this week on the many ways to interpret the HAWKEYE FATMAN currency strength indicator, and many comments that many traders find it hard to hold a trend and come out far too early. So lets look at a simple strategy.

Fatman 90 Min Chart
fatman2
This is set to 90 minutes (3 times the speed of my fast chart) as i am trading off the 30/60/120 min charts, which gives many low risk trade entries. Look where I have placed the magenta and cyan arrows…both at extremes, showing weakness in the Aussie dollar (red) and strength in the euro (green) which equates to a low risk entry.

EURAUD 30 Min Chart
euraud3
Where the first cyan arrow is the Hawkeye volume roadkill cyan dot, indicating a buy. The other 2 time frames; 60 and 120 min charts, are both displaying green buying volume and green trends with rising trend dots; so BANG entry.

Now to the difficult part…staying in the trend. THIS IS WHY YOU HAVE TO LEARN 6 WAYS A MARKET MOVES.

Look as the trend unfolds, there are two areas of congestion indicated by the blue boxes, and each time after a pause it breaks out and continues trend run. We knew that the bias was to the upside as both the 60 and 120 minutes are in solid uptrend, so hold tight…the market is just pausing.

Now look at the last several bars and you can see the trend dots starting to crunch up…this is consistent with the Fatman showing the AUD and EURO approaching the oversold and overbought area, so time to exit trade.

Hawkeye Perspective

By understanding “6 ways a market moves” keeps you safe and stops you mentally hijacking yourself. By using the Fatman to get fat, you save yourself from lean market times.

We demonstrate this and many other methods in our live demonstration room held every Wednesday, and this is open to everyone. Click this link for more information or to join us in class.

Good Fortune,

Nigel Hawkes
Hawkeye Traders

[The cyan and magenta arrows are for illustration only and do not form part of the software]

The Bottom in Precious Metals is In!

The precious metals market has been in a solid downtrend for quite some time. However, Hawkeye knows, using Volume Spread Analysis, that accumulation is showing in these markets. And by the reaction of price to this accumulation, this could be the opportunity of 2016! Let’s look at the charts…

NEM Daily
NEM Daily

One of the world’s largest miners, NEM, has shown nothing but accumulation. Look at the Cyan arrows I have placed on the chart, all showing higher bottoms and the rising volume… again showing accumulation. Then BANG… on Friday, Hawkeye shows a wide-bar up with confirming very high Volume Radar.

GDX Daily
GDX Daily

The Gold Miner’s Index, GDX (with a basket of major miners), is also showing accumulation. Again I have placed Cyan arrows on the chart showing higher Hawkeye Pivot lows, and again on the Hawkeye Volume, showing strong breakout volume on Friday.

Gold Futures Contract Daily
GC Daily

While this Gold futures chart is not quite as clear, you can still see 2 days of buying volume and a Hawkeye Pivot low on the price, all shown by the Cyan arrows I placed on the chart. Compare with the Gold ETF – GLD.

Hawkeye Perspective
Like Gold, Silver and Platinum charts show the same profile. However, there is overhead resistance on the weekly charts to break through. So Gold will probably zig-zag in price, accumulating more volume in the process, in order to continue it’s advance through this resistance.

I am excited about the prospect next year for precious metals. That’s why I will hold a Special Webinar just on this topic in January 2016. I will send an email out with registration details soon.

We demonstrate this and many other methods in our live demonstration room held every Wednesday, and this is open to everyone. Click this link for more information or to join us in class.

Good Fortune,

Nigel Hawkes
Hawkeye Traders

[The cyan arrows are for illustration only and do not form part of the software]

You Must Learn This Entry Technique

I always preach that you are trading risk rather than a market and the example below highlights just that.

EURUSD Chart Setup

Look at the slowest time frame (bottom left). The Heat Map on the bottom stayed red, both bright and dark, throughout the whole day, indicating the bias was to the downside.

The other two time frames, especially the faster (on the right hand side), gave buy signals. But they were not elected as the slow time frame indicated too much risk.

Hawkeye Perspective

Using triple time frame entries filters the potentially negative trades and ALWAYS  keeps you the right side of the market. 

We demonstrate this and many other methods in our live demonstration room held every Wednesday, and this is open to everyone. Click this link for more information or to join us in class.

Good Fortune,

Nigel Hawkes
Hawkeye Traders

[The red arrows are for illustration only and do not form part of the software]

[sg_popup id=13743]