Volume Trading Basics Pt. 3: Forex

Join countless traders worldwide who use
the Hawkeye algorithms day in and day out to gain a powerful edge

Volume Trading Basics Pt. 3: Forex

As we’ve previously discussed, volume is the ultimate indicator.

It increases exponentially our potential for trading success, our confidence, and our analysis of risk on each and every trade.

Without it, trading is a lottery. With it, you potentially have the winning ticket.

Just as with every other indicator, the Volume tool works across all the time frames from intraday time and tick based charts for scalping strategies, to longer term daily and weekly charts for trend traders.

The Hawkeye Volume Indicator also adapts to work in all markets — from Forex to index futures, from stocks and ETFs to options.

Today in our Back to Basics series with Hawkeye, we’re going to talk volume trading with Forex.

While volume trading with Forex presents us with some unique challenges, these mountains quickly become mole hills when you’ve got Hawkeye in your corner.

The Forex Volume Problem

Unfortunately, Forex volume cannot be measured as precisely as it is for equities, where every share traded equates to one on the volume bar.

So, selling 200 shares means 200 in selling volume. In stocks, the number of shares traded is managed and reported by the central exchanges, such as the New York Stock Exchange.

There are many exchanges around the world that keep track of every share bought and sold, so it is relatively easy to get a precise measure of share volumes being traded on a minute by minute basis. The same is true in the futures markets.

However, in the spot Forex market, there is no central exchange. So we cannot count how many contracts or the size of contracts traded at any given time.

Therefore, to count volume in Forex, it is the number of ticks, or changes in price, which is used, and from which we derive our volume.

One tick measures one price change. As a tick moves up and down volume rises. When volume rises, it signals market activity with participants actively buying and selling currencies. So, from this analysis we can get a relative measure of volume using tick data — but how do we know if it’s buying or selling volume?

Hey, we fixed that for you…

This is where Hawkeye is unique. It uses complicated mathematical algorithms to establish (with an 80%+ accuracy) whether the tick volume is buying or selling volume.

So now, for the first time, Forex traders have the most important of all indicators available to them: VOLUME.

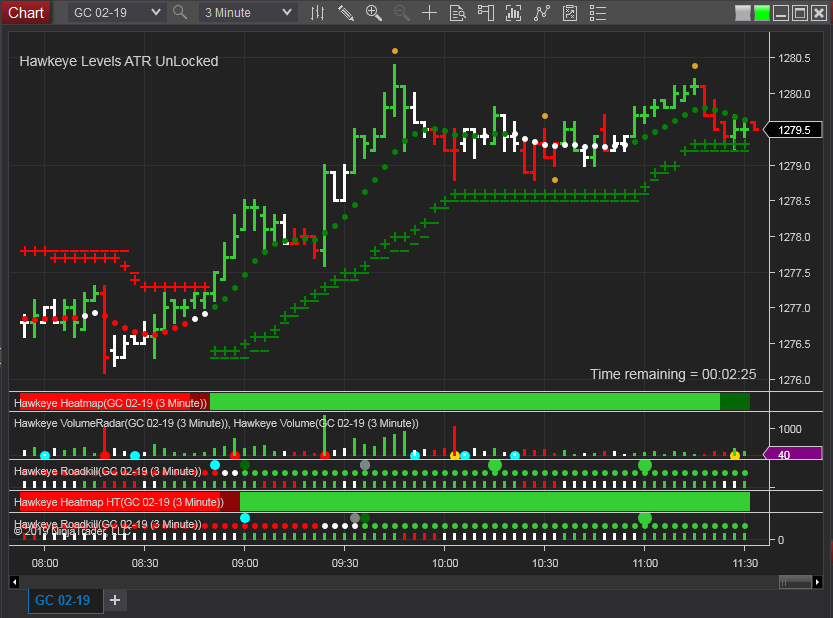
The combination of the volume, volume spread analysis and trend indicators in Hawkeye make it the most accurate software tool available for Forex traders.

We can trade with confidence, knowing that we are trading with the trend and the money flow, rather than against it.

The Hawkeye Volume indicator gives us our own unique radar system to safely navigate the Forex markets.

Is it any wonder that professional Forex traders use Hawkeye?

Click here now to learn more about Hawkeye and become the precise, profitable Forex trader you deserve to be today!

Click here now to learn more about Hawkeye and become the precise, profitable Forex trader you deserve to be today!

These 2 Elements Are Critical To Successful Trading

If you’ve been following along, we recently started our discussion of volume trading basics.

Today, we’re going to continue that discussion with volume and trends.

In the Hawkeye software, volume and trend is where the rubber meets the road.

Without the combination of these two variables, a trader doesn’t know the best times to enter the trade or exit for optimal profits.

When you have this information at your fingertips, you can see the precise moments when the market movers and institutional funds are moving into a trade, as well as when they take their money and run.

This makes your job as a trader…

Much Easier
Much More Profitable and…
Much Less Risky

Otherwise, like most other traders without Hawkeye in their toolbelt, you’ll be guessing…

To the detriment of your trade account balance and profit margin.

Volume and Trend

Volume helps us to determine the health of a trend.

An uptrend is strong and healthy if volume increases as price moves with the trend, and decreases when the market moves into a counter trend.

These are called correction periods or ‘pull backs.’

When prices are rising and volume is decreasing, it tells traders that a trend is unlikely to continue. Prices may still attempt to rise at a slower pace, and once sellers take control (which is shown by an increase in volume on a down bar), prices will fall.

A downtrend is strong and healthy if volume increases as prices move lower and decreases when the price begins to re-trace (pull back) upwards. When a market is falling and volume is decreasing, the downtrend is unlikely to continue. Prices will either continue to decrease, but at a slower pace or stop falling and start to rise.

Volume and Reversals

When volume spikes at certain price levels, professional traders know that this is a clear signal of increased interest being shown by traders at that price level. If there’s significant interest, as revealed by the volume bar, it means the level is an important one. This simple observation of volume allows traders to identify important support and resistance levels which are likely to play a significant role in the future.

Where volume spikes are extreme, larger than any historical spikes, and generally called a volume climax, traders should look for reversal clues from the price itself. Single volume spikes alone can often bring the market to an abrupt halt. These extreme volume spikes often occur during fundamental economic announcements which occur daily.

As we’ve seen with recent events such as the pandemic, the Presidential election and the announcement of multiple COVID-19 vaccines, news cycles can dramatically affect volume, and pricing as well. News can cause a spike in volume for a single day then disappear again.

Reversals, however, happen not over a single day but over a series of days. If higher than average volume stays in the market for several days a huge volume spike, a volume climax, will often signal a point of market reversal.

Volume and Breakouts

Volume can help to validate all kinds of breakouts. When the market is consolidating on low volume, an increase in volume can signify that a breakout is due. A breakout occurring on rising volume is a valid breakout, while a breakout with low volume is more likely to be false.

Why? Simply because the lack of volume signals a lack of interest from the market and traders.

Trend lines and other breakouts are validated or voided in exactly the same way. So, as you can see, volume is without question the most important and powerful indicator of all. It’s remarkably accurate at predicting future moves. When you start to incorporate Volume Price Analysis in association with a volume indicator, you then have an amazing trading tool at your disposal.

That tool is Hawkeye…

Click here RIGHT NOW for a free training video where we show you the power of Hawkeye in action! Hurry, action takers are making profits without you!

Back to Basics: Volume Trading Pt. 1

We’ve said it time and time again:

When it comes to trading, volume is the only true, leading indicator.

For years, professional traders have relied on volume as their trusted source for understanding market accumulation prior to upward momentum…

And distribution prior to downward momentum.

Hawkeye’s Volume Indicator gives you the edge with the ability to see professional buying, selling and periods of no demand.

It’s the heart of my Hawkeye trading method and will help you take your trades to the next level.

Trading using volume is preferential for a number of reasons.

    Volume confirms the strength of a trend or suggests its weakness
    Rising volume indicates rising interest
    Falling volume suggests a decline in interest, or a statement of no interest
    Extreme volume readings, i.e. climax volume, often highlights price reversals
    Points where the market trades on high volume are points of strong support and resistance
    Breakouts and market spikes can be validated or ignored with the help of volume

Hawkeye takes market volume and compares it to other factors, such as each bar’s open and close and the range of a specific number of preceding volume levels.

These variables, together with the average true range of the market price, make up one of the world’s only Volume Price Analysis indicators…

The Hawkeye Volume indicator.

The brain behind Hawkeye is a complex algorithm that clocks more than 300 calculations per volume bar…

Instantly communicating to you whether buying or selling volume is currently dominating the market.

Simply put, other trading software will only tell you the volume… leaving you to guess the rest.

Hawkeye actually tells you whether that volume corresponds to buying or selling pressure.

Buying volume = a Green Bar
Selling volume = a Red Bar
Periods of no market bias = a White Bar

The result is one of the most accurate volume prediction indicators on the market today.

Taking account of the opening and closing bar and tracking the preceding volume bars means that Hawkeye can sense the market mood…

And when combined with the other exclusive Hawkeye indicators, it can give you targeted trade entry and exit points.

What does this mean for you as a trader?

Precision trades to optimize your risk capital at the push of a button.

Here’s what a formerly stressed-out traveling salesman had to say after firing his boss and changing his life using the power of Hawkeye and V-Swarm:

Who doesn’t like printing money? *crickets*

That covers Part 1 of our overview of volume.

Stay tuned for Part 2 where we’ll take a look at volume and trends…

But if you can’t stand the thought of going another day without making money on better trades…

Click here to learn how to change your life by changing the way you trade with the incredible 1-2 punch of Hawkeye and V-Swarm!!

Back to Basics with Hawkeye: Pricing

You may have noticed that lately, I’ve been talking a lot about the Hawkeye “Rules of the Road.”

That’s because I’ve been getting a lot of questions about the foundations of this powerful software and how it tracks the market to provide savvy investors with consistent, sizable returns.

Even the best, most sophisticated tool in the world is useless if you have no idea how to properly deploy it.

So, we’re going to get back to basics and discuss some of the concepts that are fundamental to using Hawkeye effectively…

Starting with Volume Price Analysis, the foundation of all the Hawkeye Traders tools and indicators.

If you don’t first understand the concepts of price and volume, using Hawkeye effectively will be an uphill battle.

This is for those investors who are new to the market, or those who are experienced, but need a refresher.

Take a look at this:

Credit: The Data Visualization Catalogue

These vertical, colored bars on the chart are called “open/high/low/close” price bars, or OHLC bars.

The tick marks that you see attached to the left and right of the bars illustrate the stock’s price at market opening (left side) and the price at market close (right side).

On a down day, the right side close tick is lower than the left side open tick. On an up day, the right side close tick is higher than the left side open tick, which means that the price closed at a higher valuation than when it opened.

If the closing tick is located on the top part of the green bar, let’s say, in the top 40%, it’s considered a strong bar.

For red bars, the inverse is true. It’s considered a strong bar if the closing tick is in the lower 40% of the part of the bar.

A good way to remember this is “strong bar up” or “strong bar down,” otherwise it’s considered a weak bar.

Again, these are (OHLC) price bars.

They’re different from “candles,” which are a different type of price bar. Let’s take a look at those next.

Credit: Towards Data Science

These are candlestick price bars, or just candles in typical trader parlance.

The candle body represents the range between the open and the close, while the wicks on either end of the candle body represent the highs and lows.

The candles are colored red if the close is below the open. The candles are colored green if the close is above the open.

Although the Hawkeye tools are compatible with both OHLC bars and candlesticks, it’s important to note that the Hawkeye Volume Paintbar should only be used with OHLC bars.

Otherwise, you will inadvertently hide the true open and close of the candle.

Stay tuned for our next discussion, when we’ll explore volume and how it works in conjunction with price to form Volume Price Analysis, the foundation of Hawkeye. Until then…

Click here for the full scoop on this exclusive software, and learn how to win big by leveraging the power of Hawkeye and V-Swarm today!

Maximizing Your Profits by Managing Your Emotions: The Hawkeye Trading Rules

The 2020 Presidential Election is finally over…mostly. It was a wild, emotional ride, and there were a lot of key takeaways.

Two that stood out to me were how much we’re governed by our emotions as humans…

And how that unpredictable emotional scale translates to market performance in real time.

When investors are uncertain, the market struggles. When investors are optimistic, the market surges.

And when we have an election as emotionally charged as this one has been, those market swings can be all over the place.

Investors and pundits have struggled to anticipate these changes for years, with wildly inconsistent results. The problem is that financial gurus are usually tracking and acting on outdated information.

When this happens, their recommendations are usually a day late and a dollar short — more specifically YOUR dollars.

While no one can predict the emotions of others, we can track it historically and account for it in our future trades. Having access to this valuable information gives you the power to trade with consistent, repeatable profits, while significantly lowering your risk exposure.

How? Through the science and magic of volume trend analysis. Volume trends are the realized expression of human emotion in the market.

Volume is the ONLY leading market indicator which reveals true market intent, BEFORE it happens. All other indicators are lagged, and will tell you what has already happened… which does no favors for your trade account balance.

Only one tool effectively harnesses the power of volume, practically giving you a crystal ball to predict future market shifts…Hawkeye.

Analyzing price and volume to give us market direction and actionable investment intelligence is an extremely difficult process to not only understand, but also execute…
Unless you have the right tools.

Most traders struggle to master this difficult skill, since our emotions are telling us to exit as soon as we have a small profit in any position. With Hawkeye, however, this skill is mastered easily, as we simply follow our simple exit rules, guided by the most powerful indicators available.

Fortunately for you, Hawkeye is a volume company. Our founder and creator of the Hawkeye software, Nigel Hawkes, has studied the equivalent of a Ph.D in Volume Price Analysis, and this was where his own trading journey started.

Hawkeye is your ultimate turnkey solution to predicting market trends early enough to take action. This gives you access to consistently profitable trades…

…all underpinned by the unique Hawkeye algorithms that forecast the market’s intent based on Volume Price Analysis. If the first golden rule of trading success is to keep things simple, then the second golden rule is to trade without an opinion, and to simply trade what we see on our charts.

The Hawkeye calculations are not influenced by human opinion, political ambition, or natural disaster. Hawkeye simply analyzes the price and volume relationship using a combination of standard deviation and price pattern recognition, which is then coupled with the volume price algorithms to deliver the most powerful trading software in the world.

In the coming days and weeks, I’ll be providing a breakdown of the Hawkeye Trading Rules for our top volume indicators. So, keep a close eye on your mailbox, so that you don’t miss this valuable info.

But if the thought of going another day without access to this life changing info is eating you up inside…

Click here to discover more about our Hawkeye and V-Swarm technology and how you can start leveraging it today!

Caution…Newbie Trader Ahead

Have you ever found yourself behind a slow driver on the highway?

You’re on your way to an important event, like your weekly work staff meeting, that you’re usually late for…

Just when your road rage is about to boil over and you prepare to buzz by them with a few choice words and gestures, you look at the back of the Sunday driver in Tuesday morning rush hour traffic only to see the dreaded bumper sticker…

Caution…Student Driver

With the wind taken out of your sails, your temper cools as you reluctantly realize that you were once a new driver who didn’t know the rules of the road.

Learning the markets is similar.

You step into this completely new world with a different language, different math and no clue where to begin.

Trading isn’t rocket science — unless you’re brand new to it, and then all the charts, graphs and indicators might as well be the blueprints to the International Space Station.

With that in mind, the team here at Hawkeye Traders has put together an outstanding Member’s Training area for you.

Jam packed with literally hundreds of webinars, courses and Mastermind Trainings, our members area will get you up to speed on volume trading in no time at all.

The team and I have put all of our resources and collective trading knowledge in one central location, with the best support, so that you can have access to the same cutting edge trading tools that the pros (at least the successful ones) use to consistently win in the markets.

We take “new to you” concepts like the Hawkeye 3-Step Entry/Exit method and break them down into easy to understand, bite-sized chunks, so that you can get up to cruising speeds to trade like the Wall Street insiders.

Wondering what the heck is a 3-Step Entry/Exit method?

While nothing in the market is failsafe… it’s just about the closest thing we’ve ever found.

It’s a literal step-by-step process to help you identify the highest probability and lowest risk trade entries.

And if you follow the process that we lay out for you in Hawkeye, you could end up like our friend Vauna G.

Vauna was a nurse who started trading in 2018 with no prior trading experience.

In less than 12 months she was able to replace her income and trade full time all with the power of V-swarm.

This invaluable tool can even be used across multiple trading platforms like TradeStation, NinjaTrader and Metatrader 4 (MT4).

A full breakdown of this exclusive, wildly successful volume trading methodology and other priceless trading tools can be found in our Member’s Training Area…

So what are you waiting for? Stop sitting on the sidelines of the market and get in the game by using our winning playbook today!

Click here for a free webclass on how to harness the power of the Hawkeye software and trading methodologies!

Click here for a free webclass on how to harness the power of the Hawkeye software and trading methodologies!

How To Boost Your Graphics Card and Monitor Combo

In our last trading hardware discussion, we talked about performance specs to optimize your trading desk’s processing power, memory and disk space, to combat trade slippage.

Click here to catch up on that breakdown.

Today, I’ll be sharing my hardware recommendations for the best monitor display and graphics card setup.

Trading from home is the digital equivalent of being in the middle of the trading floor feeding frenzy. Exchanging that much data in real time can crash servers.

Now imagine those traders all trying to smush together into one selfie at the same time…Everyone pushing and shoving to get their face in the frame. It would be a nightmare.

That’s exactly what happens on your monitors when you’re trading from home. Well…almost.

In the selfie scenario, all of the traders get COVID because they weren’t practicing social distancing and then the trading floor has to lock down.

In the monitor scenario, your graphics card seizes up and your computer crashes, because it can’t handle the massive data load of displaying all of your charts and graphs in real time.

Both cases mean that now you can’t trade, which is like throwing cash out of the window.

And that’s only good for the people outside…not you.

So, if you’re not going to take the following advice, I’ll just need your address and the start time of the free cash giveaway and you can stop reading here.

But, if you DON’T like losing cash because of simple hardware issues…

Monitors and Graphics Cards

Most traders can get by with only two monitors. But if you’re trading more than one market, you’ll need more than two monitors. Which means you need to get your hot little hands on a dedicated graphics card.

Just like you need a CPU that can handle the big data surges, you need a graphics card that can keep up with the massive amounts of data coming through the server and loading onto your charts.

At a minimum, your new graphics card should have 4GB to 8GB of on-board memory, in addition to an advanced graphics processor.

This relieves your main CPU of all the graphical requirements needed for the monitors and instead, outsources all that work to the GPU (Graphics Processing Unit).

In other words, your CPU tags in your GPU to do all the heavy lifting for your display, while it focuses on maintaining your trading applications and systems at a steady clip.

Take that, trade slippage!

Some people will simply buy a gaming graphics card, which is typically more than sufficient for our needs as traders. Nvidia graphics cards are my go-to.

When I first started I didn’t have a dedicated graphics card, and my computer would frequently crash during periods of high volatility. An awesome NinjaTrader rep steered me to a dedicated graphics card to fix the problem. Once I got one in place, my computer stopped crashing.

Now, if you’re serious about trading, or you’ve been trading seriously for a while and you know you’re in it for the long haul, I’d ultimately recommend having a computer that is dedicated solely to trading.

The more applications and demands you put on that computer outside of trading, the more processing power, memory and hard disc space you’re taking away from trading functions and allocating elsewhere.

Now that we’ve got the graphics on your trading rig squared away…

Click here to learn more about the Hawkeye system by watching a comprehensive training video!

Hardware Choices To Help Prevent Slippage

In the last newsletter, we started talking about the dreaded menace that haunts every trader…slippage.

Click here for a refresher on the concept and great strategies to help you combat slippage today.

Slippage is defined as the difference between the expected price of a trade and the price at which the trade is actually executed.

And slippage is always a possibility with market orders…especially if the stock is volatile.

Now, the novice trader may say, “What’s a few cents here or there?“

But those of us in the know understand that in this game, time is money and if we’re losing both, we’re losing big…

And here…we play to win.

Last time, I gave you some strategies to make your trades more slippage proof.

Today, as promised, we’re going to get down to brass tacks, or more specifically…nuts and bolts.

Things are going to get a little technical, but you’ve got this.

We’re going to talk about your trading hardware and optimizing it against slippage.

If strategy is the brains of your trading operation, your trading rig is the muscle…

All the best strategies in the world are useless if you can’t get your trades through consistently because of technical issues.

    The Problem

      If you’ve ever seen the trading floor on the stock exchange, you know things can get crazy rather quickly.

      At least they used to… countless traders pushing, shoving, yelling into phones, trying to get their trades in at their desired price.

      The same feeding frenzy happens in online trading.

      Many times, particularly at the market open, there’s a huge surge of volume and data coming across the server that will crash most out-of-the-box computers that aren’t built to trading specifications.

      If you don’t have a computer that’s beefy enough to handle the processing of all the indicators, data flow and graphical display, it’s going to slow you down and can definitely lead to slippage.

        The Solution

      My big 3 necessities for a trading computer are as follows:

    • A CPU (Central Processing Unit) that is benchmarked at 10,000 or greater
    • 8GB RAM (Random Access Memory) on 64-bit operating system
    • 250GB SSD (Solid State Drive)
    • Slippage can be directly attributed to your CPU and your processing speed.

      CPU performance is also directly related to the amount of memory on your computer.

      Memory is basically the working area your computer has to do business in.

      So, if you don’t have a lot of memory, your computer has to work much harder to keep up with the demand you’re putting on it.

      When it starts running out of memory, your computer has to swap things in and out and start putting things on your hard drive, which really slows things down.

      This is a big reason why many hard drives have been upgraded to solid state drives.

      A solid state drive (SSD) is definitely a requirement these days for traders, along with a CPU with plenty of onboard memory.

      Most traders will do well with a 64-bit computer with a minimum 8GB of RAM, and a minimum 250GB SSD.

      Keep in mind that the more things you’re doing on your computer outside of trading, the bigger the drive you’ll need to prevent your trading applications from getting bogged down.

      A 500GB SSD should be the max anyone would need for trading and most other basic computing functions.

      Finally, your CPU must be benchmarked, because it can make or break your trading performance.

      The basic benchmark for trading computers is 10,000 or greater.

      If you’re trading on a computer with a benchmark under 10,000, you’re underperforming and will likely get bad fill, slippage, and generally poor performance from your trading.

      Putting these initial pieces in place will significantly optimize your trading game and allow you to focus on more important things…

      Like making money.

      Next time, we’ll continue this discussion and talk about monitors and graphics card requirements for trading, but until then…

      You can learn more about the Hawkeye method and how this amazing tool can help you achieve consistent profitability by clicking here.

How To Keep Slippage From Sabotaging Your Trading

Have you ever placed a trade…

Only to have the order filled at a price you didn’t want?

Whether price went up or down — in your favor or against it — this can be a frustrating experience.

It’s a phenomenon known as slippage…

And it can really throw a wrench in your trading if you’re not aware of it.

The good news, though, is that there are steps you can take to help prevent slippage from sabotaging your trading.

Now slippage is defined as the difference between the expected price of a trade and the price at which the trade is actually executed.

It’s possible for slippage to occur in your favor.

… But typically, when traders talk about slippage, we’re talking about price moving against us.

So what causes slippage to occur in the first place?

Well, you have to consider the fact that when you execute a trade order from your computer, it doesn’t get filled instantaneously.

There is always some amount of lag time between you placing your order…

And the order getting filled.

That means slippage is always a possibility when you’re using a market order…

Especially if volatility is high.

However, as I mentioned, there are some things we can do to help prevent slippage.

For instance, instead of using a market order, you can use a limit order to ensure you only get filled at the price you want.

Of course, there is a trade-off to using a limit order instead of a market order.

See, a market order will get filled as soon as possible, at the best possible price.

With a limit order, though, your trade will only get executed if the price reaches your specified order price…

Which means there’s a possibility that your trade order never gets filled at all.

Now, the reality is that there’s no real way to prevent slippage from ever occurring, apart from only using limit orders.

But that’s just not feasible for a lot of traders.

So, the reality is that you need to do everything you can to prepare for slippage…

And to minimize its impact on your trading.

The best way to do that is by ensuring that you have the right hardware in place to process the incredible amounts of market data being fed to your computer…

And to handle the massive memory and processing demands of your trade charting and analysis software.

Now, in the next Hawkeye newsletter we’ll dive deeper into the basic computing requirements most traders will need to ensure smooth trading with minimal slippage.

In the meantime, you can learn more about how Hawkeye helps traders boost their results no matter what instrument, timeframe, or style they prefer by clicking right here!

One Simple Hack For More Consistent And Disciplined Trading

It’s Monday, and I hope you’re well rested and ready to tackle the week ahead!

Last week, we talked about the importance of trading psychology…

More specifically, having the disciplined mindset to focus more on your trading process than on your profits.

“But Randy, the whole point of trading is to be profitable!”

Yes, that’s true…

We trade in the markets as a means of making money.

But here’s the thing…

When you focus too heavily on your profits and losses — particularly when you’re first starting out or in the early stages of your trading journey…

You tend to lose sight of what’s really important:

Developing and STICKING TO a reliable, battle-tested system that can continually produce winning trades over the long term.

See, a lot of traders can do the first part — developing a plan.

Where most traders get tripped up is the “sticking to it” part.

But I’ve got a simple “hack” you can use that will help ensure you stick to your trading plan…

And help you develop discipline as a trader.

Now before I tell you what this easy trick is — and how you can start implementing it today to be more consistent and disciplined in your trading…

I want to show you something that one of our Hawkeye community members posted in the Inner Circle just a few days ago.

Our friend John wrote:

“After many years of trading and listening to a lot of traders, I have found that you have to have your own trading plan and STICK to it.

“Take some time to develop and test your trading plan.

“I used to have a rubber band on my wrist and would snap it before hitting the mouse button to make sure ALL rules were in play before taking the trade.

“Discipline is hard, but it’s the most important part of trading.

“There was a time when I thought 3 out of 5 of my trading rules was good enough… Wrong!!!”

Now, there are a few things I want to point out here.

First, John is echoing something you hear me preach all the time.

You have to have your own trading plan… and you have to STICK TO IT.

But notice that John didn’t say you need any old trading plan.

He didn’t say you need Randy’s trading plan… or Warren Buffett’s, or Bill Ackman’s or any other trader’s plan.

You need YOUR OWN trading plan.

This is key because no two traders are exactly alike.

You have your own way of trading… and if you don’t, it just means you haven’t spent enough time developing your own way, just as John pointed out.

I also like John’s strategy of keeping a rubber band on his wrist and snapping it before pulling the trigger on a trade…

To remind himself to check off ALL the boxes of his trading plan.

Just like he said, 3 out of 5 just isn’t good enough.

Now, the rubber band to remind yourself to check all the boxes on any given trade is a pretty good tactic…

But I want to take it a step further.

This is quite frankly the easiest… yet most powerful trick I know to ensure that you stick to your trading plan for each and every trade.

Ready for it?

Here it is…

Make a checklist.

That’s it.

It’s really that simple.

See, when you have a written checksheet that you go through for each and every single trade you take, it forces you to fully qualify those trades…

And ensures that you stick to your plan.

Now, our friend Anthony posted a handy day trading checklist in the Inner Circle last week that you can reference for this task.

Of course, you may need to make a few alterations depending on your personal trade plan…

But the framework is there for you to see how Anthony qualifies each and every trade he takes to ensure that it aligns with his trade plan.

Now if you’re not a Hawkeye member and you’d like to learn how you can access the Inner Circle and see Anthony’s day trading checklist…

AND learn how Hawkeye’s simple 3-Step Method for spotting and confirming trade setups and entries can make building your own trade plan much, much easier…

Then click right here to view a free training video and watch how simple trading with Hawkeye truly is!

This Is My Favorite Chart Setup

In previous issues, we’ve talked about using different timeframes for different strategies.

We’ve also talked in-depth about developing a personalized trade plan…

And testing that plan to dial it in and make sure you can rely on it in real, live market conditions.

Well, today I want to tell you about my personal favorite timeframe, at least from a day trading perspective…

As well as the process of testing I went through to find out which timeframe I preferred.

Now, the 5 minute chart is a popular timeframe that a lot of traders prefer.

The 5 minute timeframe also allows you to leverage the power of harmonics for your higher timeframe charts that you’ll use to confirm trends…

So, for instance, if you’re using the 5 minute as your fastest timeframe, you could use the 10 and 15 minute charts as your higher timeframes, since they are both integer multiples of 5.

Of course, other traders prefer the 1 minute chart as their fastest timeframe.

For me personally, though, the 1 minute chart is a little too fast…

And the 5 is a little slower than I’d like for my trading.

But the 3 minute chart, for me, is right in that sweet spot.

With the 3 minute chart as my fastest timeframe, I’m able to see trends developing quickly enough that I can get in early…

And get back out again without taking on unnecessary risk.

Now, when I was developing my personal trade plan, I tested just about all of the fastest timeframes, starting with the 1 minute and working up to the 5 minute.

As I said, the 1 minute was just too fast for my taste.

Two minutes was OK…

And the 4 minute did not work at all for me.

I’m not sure if it had something to do with the harmonics and the fractal nature of the market…

But the more I played with the 3 minute — and the corresponding 6 and 12 minute charts for higher timeframe confirmation — the more I liked it.

Plus, the 3 minute really corresponds well with the hour chart, as 60 is also an integer multiple of 3.

In fact, my go-to chart setup for most of my day trading looks like this:

This is the Nasdaq E-mini futures (ticker NQ) on the 3 minute (top left)…

The 6 minute (bottom left)…

12 minute (top right)…

And one hour (bottom right).

Now, if you’re new to the world of Hawkeye or to trading in general, you may feel a little overwhelmed looking at these charts.

But I assure you, once you understand what’s going on, reading these indicators — and understanding at a glance what the market you’re watching is doing — is really simple.

We put together a training video to break down the foundational Hawkeye indicators and show you exactly what you’re looking at here…

And how these tools can help you see which way the market’s heading before it gets there.

So if you’re ready to learn more, you can watch that in-depth training video for free by clicking right here!

Benefits Of Trading Correlated And Uncorrelated Markets

On Monday, we started talking about market correlation…

And how to identify correlation between markets using the Hawkeye Fatboy indicator.

Today, though, I want to follow up and talk about why understanding market correlation is beneficial for our trading.

Now, there are benefits to trading both correlated and non-correlated markets.

First, the advantage to trading non-correlated markets is portfolio diversity.

For example, if one asset or instrument you’re trading is going up, and a non-correlated instrument you’re trading is going down…

It helps to bring balance to your portfolio and reduce the amount of overall risk you’re exposed to.

Now on Monday, I showed you how I keep my Fatboy set to track the four major indices — the Nasdaq, the S&P, the Dow, and the Russell.

But I also track gold and crude oil, which are two uncorrelated markets in regard to the equities indices.

Again, this helps me maintain some balance in my portfolio.

If I see equities trending down, I may increase my gold or crude oil positionings to hedge those trades to a degree.

Now, the advantage to trading correlated markets is that it enables you to hold multiple positions in markets that are trending in the same direction.

What’s more, trading correlated markets can give you more confidence in your positions, as they can serve as additional confirmation that the trades are trending in your favor.

Of course, the degree of correlation can change within both correlated and uncorrelated markets.

That’s why it’s important to have a reliable system or indicator that can help you see precisely what degree of correlation the markets you’re trading are in at any given time, which is precisely what the Hawkeye Fatboy is designed to do.

Now if you’re not yet trading with the predictive power of Hawkeye and you’d like to learn more about our proprietary suite of indicators, you can watch a comprehensive training class by clicking right here.

Once you have the fundamental tools in place for reading and understanding volume in the markets, you can make the most of market correlation using a tool like the Fatboy.

Understanding Market Correlation For More Precise Trading

I hope your week is off to a great start!

Today I want to talk about market correlation… and how we can see correlation between multiple markets to help us in our trading.

Now, when markets are correlated, it means they are moving essentially in step with one another.

The benefit of knowing how correlated or uncorrelated individual markets are is that it can give you a broader perspective on the overall nature of the market at large…

And help you diversify your portfolio to reflect the changing degrees of correlation if needed.

Now, at Hawkeye we have a tool that was developed specifically to measure correlation between several markets or instruments…

It’s a tool called the Hawkeye Fatboy, and it instantly reveals which markets are correlating and which are not, giving you valuable insight into the overall market with one quick glance.

Here’s a look at the Fatboy set to my own personal settings.

Now, what we’re primarily looking at here is the group of wavy bands that are moving along together mainly between the green and red horizontal lines.

(The single red and yellow band across the bottom is a new indicator that’s still in development at the moment.)

Now, the first step in using the Fatboy is to set the indicator to track the particular markets or instruments that you normally trade and want to analyze for correlation.

Personally, I set my Fatboy to track equities futures across 4 major indexes: the S&P (ticker ES), the Nasdaq (NQ), the Dow (YM), and the Russell (RTY).

I also have crude oil (CL) and gold (GC) tracking on the Fatboy to help me see how they’re being impacted by the indices and vice versa.

So, each one of those wavy bands represents one of those instruments that I’m tracking.

The more tightly bound those bands are to one another, the stronger their correlation.

As the bands begin to spread apart from each other, they’re less and less correlated.

So, when two or more bands appear to be sitting on top of one another, that’s a very strong degree of correlation.

Now, looking at these particular markets and their current position on the Fatboy, we see that the Russell (the pink band) is building strength…

… While the other indices are losing strength.

But how exactly does understanding correlation or non-correlation help you in your trading?

Well, typically when you see uncorrelated markets, you can expect choppy, range-bound price action.

On the other hand, when you see a strong correlation between certain markets or instruments, you’ll typically see nice corresponding trends.

Now, here’s what’s great about the Fatboy: It doesn’t only show correlation and non-correlation.

See, those horizontal red and green bars represent areas of overbuying and overselling, so you can see where the instruments that you’re tracking are in relation to being overbought or oversold.

In essence, the Fatboy tells you three things in one easy indicator: whether an instrument is gaining or losing energy…

Whether the instrument is overbought or oversold…

And how correlated that instrument is with other instruments that you’re tracking.

Now, in the next edition, we’ll talk more about the pros and cons of trading correlated and non-correlated instruments.

In the meantime, you can learn more about the basis of the Hawkeye methodology and our flagship indicator by watching a comprehensive training video — just click here to view it now!

This Hawkeye Trader Has Something Very Special To Share…

I’ve said it before, and I’ll say it again…

The best part of my job is seeing the success of fellow Hawkeye traders.

Nothing makes me happier than watching a trader come into our community…

Embrace our methodology…

And ultimately break through and achieve the success they’d only previously dreamed about.

Because the truth is, that success is 100% attainable.

It just takes a disciplined approach…

A strong mindset…

The right tools…

And a proven strategy.

Now, we’ve had plenty of incredible success stories over the years.

But when this trader that I’m about to introduce you to told me the kind of success he was seeing with his trading thanks to Hawkeye…

I knew he had something really special.

And now that he’s achieved the security, freedom, and lifestyle of his dreams for himself and his family…

He wants to pay it forward to the Hawkeye community.

Now, some of you are already familiar with Anthony from his newsletter, Big Energy Profits…

And many of you have interacted with him directly in our Hawkeye Inner Circle Skype group.

But for those of you who aren’t familiar with Anthony or his inspiring story, let me tell you a little bit about him.

See, 10 years ago, Anthony’s life looked much, much different than it does today.

He was doing all he could to keep his family’s automotive repair business above ground…

While balancing four mortgages… car payments… credit card debt… and massive overhead associated with the business.

More than once, bankruptcy looked like a viable option for Anthony and his family’s business…

The business they’d built from the ground up, from its modest start in Anthony’s grandparent’s garage.

Anthony knew that if he didn’t find a solution, his family stood to lose everything.

Well, as so many folks do, Anthony decided to try his hand at the markets…

And he credits Hawkeye with giving him the tools he needed to blaze a path from where he was…

To where he is now.

100% debt free…

Enough money in the bank to send his kids to the top universities multiple times over…

And the freedom of time to live a life on his own terms.

See, using Hawkeye, Anthony has developed a rather genius trade strategy that he has mastered over the course of a decade.

He spends less than an hour at his trading station every week…

And last year, he cleared nearly $400,000 in profits.

This year, he’s on track to break the one-million mark.

What’s most intriguing is that he does it trading just one single instrument.

Now, as I said, Anthony has refined, fine-tuned and tweaked this strategy over years and years of diligent, patient and grueling back-testing and development.

And now, it runs like a well-oiled machine.

This Thursday at 1 p.m. Eastern, he’s going to hold a live training event to share all the details of how it works…

And offer you a very special chance to join his brand new trade service which will allow you to take the exact same trades he’s taking…

And to profit right alongside him.

You can learn more about Anthony, his story, and this potentially life-changing opportunity by clicking right here.

This is an event you will not want to miss!

Your Trade Plan Is Worthless Without This…

Over the past several issues we’ve been talking about the 3 keys to a winning trading plan.

We’ve covered key No. 1, which is to have your trading plan in writing…

And we’ve also talked extensively about key No. 2, which is to backtest and forward test your plan.

Now, we’re ready to tackle the third… and most important… key to a winning trade plan.

Ready?

The third key is to TRADE YOUR PLAN!

Here’s the reality…

Even the best trade plan in the world will FAIL if you don’t stick to it or are unable to trade it in a live market.

I mean, the whole point of developing a trade plan…

Putting it in writing…

And taking the time to backtest and forward test it is to ensure that you have the best chance of success in the live markets.

But all that hard work will be for nothing if you stray from the plan once you actually go live.

Now, I’ve been coaching traders for a long time.

And you’d be surprised at some of the things I’ve heard when trades didn’t go their way.

“It was a fat-finger trade…”

“The dog hit my trade button…”

“I fell asleep…”

I mean, I’ve heard every excuse in the world.

And you know what they say about excuses.

At the end of the day, only YOU can ensure that you actually stick to your trading plan.

Now, another thing to keep in mind is that there are aspects of live trading that no trade plan, no matter how well-researched or thought out, can account for.

I’m talking about things like order fills and slippage issues.

Trades that were good in testing might not have actually filled in a live market due to low volume or limited transactions at that price.

So, you should always account for slippage in your trades, because it will make your results much more realistic.

Other unforeseen factors that can lead to unexpected losses include your server going down…

Your internet connection failing…

Natural disasters…

And unexpected news events.

Look, even the best trader with the best plan can’t predict things like these.

So it’s important to keep them in mind when assessing your plan…

And it’s important to have a backup plan just in case disaster strikes.

So, there you have it…

The 3 keys to a winning trading plan.

Remember: it’s easy to get into trading.

The true challenge is in becoming a SUCCESSFUL trader.The true challenge is in becoming a SUCCESSFUL trader.

And I can promise you one thing…

Every trader who achieves success has put in countless hours of behind-the-scenes work…

Most likely over the course of years and years.

Remember, you only get out what you put in…

So if you’re serious about making it as a trader, you’re going to have to commit yourself to it.

Of course, having the right tools and techniques on your side is a major part of the process…

So if you’d like to learn more about how Hawkeye’s suite of trading tools and our 3-Step Method for managing trades can help you, then then click right here to view a comprehensive training video!

Testing Your Trade Plan for Maximum Impact

I hope you’re well after a long Labor Day weekend!

In our last issue, we began breaking down the second key to a winning trade plan…

Which is to backtest and forward test your strategy.

Now, we mainly focused on backtesting last time…

And before we move on to the third and final key to a winning trade plan, we need to talk more about forward testing and cover some words of caution regarding both forward and backtesting.

Now, you may be more familiar with forward testing than you are with backtesting, even if you’ve never heard it referred to as “forward testing” before.

Forward testing is where you actually trade your plan following all the rules in a live market…

Except that the trades are executed in a simulated (sim) account.

See, backtesting helps you dial in your strategy…

But forward testing is where you get to prove whether the work you did in backtesting paid off or not.

Simulated trading — a.k.a. forward testing — is a great way to build confidence in your strategy and your ability to execute it under live market conditions.

Now, one of the keys to successful forward testing is keeping detailed records.

You need to log everything that happens during each trading session, so that you can remember later as you’re tweaking and refining your strategy.

Another major key to forward testing is that you are not putting any real money into the markets!

This is what makes sim trading so beneficial.

It allows you to trade in real time under real market conditions… without putting any real money on the line.

Now, some folks will tell you that this is precisely what makes sim trading not beneficial.

They say that there’s no way to replicate the emotions that come with putting actual money on the line during a real trade.

However… I disagree.

You see, the mind is an extremely powerful tool.

And the reality is that if you approach your forward testing with the same mindset that you would approach a live trade with, you’d be surprised at how realistic it really can feel.

Now, there are some things you need to watch out for as you backtest and forward test your plan.

First, don’t backtest over extremely long periods of time relative to your timeframe.

For example, if you trade on the 5 minute timeframe, don’t backtest two years of data.

It’s simply not going to help you.

Second, be careful of over-optimizing your plan while backtesting.

If you recall, last time we said that when you select a period of historical data to backtest, you should divide it into thirds.

Two-thirds of the data will be your “in-sample data,” which you’ll use to run your trade plan and tweak, alter and optimize the strategy…

While the final third will be your “out-of-sample data” which you’ll simply use to verify the results of your strategy.

However, it is completely possible to over-optimize your plan based on the in-sample data to try and maximize your profits based solely on that data…

Which will only hurt you in the long run.

So, remember to generalize your in-sample testing and tweaking and avoid “curve fitting” your strategy.

Otherwise, you could end up with a plan that produces incredible profits on one specific historical data set…

But performs poorly in live markets.

OK, that wraps up Key 2 to a winning trading plan…

And next time, we’ll cover the third and final key.

But in the meantime, if you want a much more in-depth look at how Hawkeye helps traders understand and visualize markets in a whole new way, just click right here to watch a comprehensive training video!

The One Thing You Must Do Before Trading Live

Recently, we’ve started talking about the 3 keys to a winning trading plan.

Last week, we looked at the first key…

Which is to have your plan in writing.

Today, it’s time to dive into Key No. 2…

And this one is something you absolutely MUST do before ever taking a live trade.

I’m talking about backtesting and forward testing your trading plan.

Now, backtesting means using your plan on historical market data to see how it would have performed historically.

Many platforms support automated backtesting…

But if you don’t have that function available to you, you can simply go through your entry and exit rules manually using the historical data.

Forward testing, on the other hand, refers to testing your plan on the live edge of the market.

Forward testing is often referred to as paper trading… and it’s typically done in a simulated account, or sim account for short.

Sim trading is great because it allows you a chance to learn the particular platform you’re using…

While simultaneously practicing entering, managing and exiting trades according to your plan.

Not only does this build up your experience with using the platform and following your trading plan, but it also builds up your confidence as you begin to see that your plan will actually work.

Of course, if it’s not working, the sim account gives you the opportunity to tweak, rearrange and reorder your plan as necessary without risking real money as you work out the kinks.

Now, there are a few things you should keep in mind when backtesting and forward testing that will help ensure you get the most out of your testing.

The first thing is, whenever you’re backtesting, you want to select historical data that represents the current trading climate as much as possible.

That means that if the market you plan to trade is currently in a period of congestion or range-bound trading, you want to choose a period of historical data that looks roughly the same as the current period.

It’s also critical that you look at the same timeframes that you’ll be trading live when you’re backtesting historical data.

Now, the second important thing to keep in mind when backtesting is that you want to use both in-sample data and out-of-sample data.

Here’s the key to testing with in-sample and out-of-sample data…

You will only actually backtest your plan on the in-sample data.

As you’re backtesting the in-sample data, you will use the results to optimize your settings and strategy…

Then, you’ll run the out-of-sample data and analyze the outcome without influencing any of the optimization of your plan.

So, how do you determine in-sample and out-of-sample data?

It’s pretty simple, really.

Once you’ve identified a period of historical data that you want to use for your backtesting, you will divide that dataset into thirds.

Then, you simply define two-thirds of the period as your in-sample data…

And the leftover third will serve as your out-of-sample data.

For instance, if you chose a time period of 3 weeks as your backtesting data period, you could use the first two weeks as your in-sample data…

Then use the last week of the period as your out-of-sample data.

Now, what happens if you backtest with your in-sample data, optimize your results, then run the out-of-sample data and see low correlation?

(In other words, the out-of-sample data test did not perform as well as the in-sample testing that you optimized.)

Well, it often means that your system is over-optimized…

And it might not perform well in a live market.

In that instance, you’d want to go back to backtesting…

So that you can continue to iron out the details, settings and specifics of your plan.

Once you see a strong correlation between your in-sample results and out-of-sample results, you are in a good position to take your trading plan to the live market.

In a future issue, we’ll discuss more about forward testing your trading plan, as well as the third key to developing a winning trade plan…

But for now, you can learn more about Hawkeye’s proprietary 3-Step Method and how it helps you trade with more consistency by clicking here to watch a full training video!

Energy Market Update: Is It Time to Trade This Sector?

Sometimes, knowing when NOT to trade is more important than knowing when to trade.

And in today’s video breakdown, Anthony is analyzing the energy sector and demonstrating how Hawkeye gives traders a clear picture of the market…  

As well as a simple set of rules for getting into trades and knowing when to wait for more opportunistic conditions. 

Check out the video to get Anthony’s take on crude, gasoline, home heating oil, and natural gas… 

As well as some insights on trading mindset that can help you achieve new levels. 

You can learn even more about the Hawkeye suite of indicators and how they can help you achieve consistent profitability in your trading by clicking right here for a full training video!

Quick and Dirty U.S. Index Breakdown: A Hawkeye Perspective

In today’s video breakdown, Anthony takes a look at the three major U.S. indexes to show you how Hawkeye helps identify the most opportunistic index to trade. While the daily charts showed long entries on the Dow, S&P and Nasdaq at the beginning of August, the weekly and monthly charts indicated that only one was all clear for takeoff… and it’s still going long and strong. Watch the video to see Anthony demonstrate the predictive power of the Hawkeye system.

To learn even more about how you can begin leveraging the power of volume in your everyday trading, click here to view a full training video that will walk you through our methodology step by step!

Key No. 1 to a Winning Trade Plan

On Monday, we started talking about the single most important thing that every trader needs if they want to succeed…

A trading plan.

We discussed exactly what a trade plan is, as well as some of the key characteristics that define a solid trading plan.

I also told you that there are 3 keys to a winning trade plan…

And today, we’re going to look at the first key.

Key number one to a winning trading plan is to have your plan in writing!

Now, this may seem a bit arbitrary on its face…

But in a moment you’ll realize just how crucial it really is.

You see, when your plan lives only in your head, it’s too easy for it to change based on whim or emotion.

On the other hand, when your plan is fully thought out and documented in writing, it’s much more concrete.

Your written trading plan should be right beside you every time you actively trade.

That way, you can refer to it when you need to…

And it will be there to guide you no matter what situation you find yourself in.

What’s more, thinking through and physically writing out a comprehensive trade plan will give you time to really think about all the elements involved in trading and how they will impact your life.

Now, I told you before that one of the key characteristics of a good trading plan is that it’s personal.

That means not simply replicating someone else’s trade plan…

Because we all have our own unique personalities, perspectives, and goals.

As such, we need to develop a plan that is tailored to our own situation.

So… how do you ensure that your trade plan is personalized?

You start by asking yourself the following questions (and writing down the answers):

  1. How much time can I commit to trading?
  2. What skills do I currently have?
  3. What skills/knowledge do I lack?
  4. How much risk can I tolerate?
  5. How will trading affect my relationships? (Remember that relationships affect emotions, which can greatly affect your trading.)
  6. Do I have all the necessary tools for trading? (These include an up-to-date computer… a reliable internet connection… an active account with a trading platform… and any trading software or indicators that you will use.)
  7. What are my personality traits? (Am I greedy? Self-disciplined or compulsive? Patient or impatient? Overly confident or lacking in confidence? Decisive? Emotionally stable? A gambler who is willing to risk money I can’t afford to lose?)

As you can see, these questions will require some real self-reflection and honesty.

But the more honestly you answer these questions, the better positioned you’ll be to create a trading plan that you actually stick with.

Now, we also need to talk about the elements that every written trading plan should include.

First, your trade plan needs to clearly state your goals and objectives.

For example, will you trade for a living, or as a way to supplement your income on the side?

What instruments will you trade?

What timeframes will you trade? For instance, will you be a day trader, a swing trader, a position trader, or a combination of those?

How much will your initial investment be?

More importantly, can you afford to lose that entire initial investment and still provide for your family?

Now, your trading plan also should include your daily trade routine.

Remember, the more structure you have in place for yourself, the more productive your trade sessions will be, since you won’t have to waste time wondering where you should start or what you should do next.

Your daily routine should consider things like time for research…

Time for continuing education…

Being sufficiently rested so you have an alert mind…

A trading environment that’s free from distractions…

And ideal times of day that you will trade and when you will sit out of the market.

Of course, your trading plan must also address the specifics of the strategies you’ll use for the markets you’ll be trading.

That means clear entry rules to determine under what circumstances you’ll enter a trade…

Risk rules that regulate how much you’ll risk on any given trade…

And exit rules that tell you when to close a trade.

Finally, a part of your plan should be to keep detailed records of your daily trading activities.

That means journaling not just your profit and loss numbers, but the specifics of the trades…

The whys and hows of what you did.

Documenting the process will help you learn what works… and what doesn’t… so that you don’t repeat costly mistakes.

In our next installment, we’ll look at key number 2 of a winning trading plan…

But if you’d like to learn more about how Hawkeye can fit into your trade plan to help you optimize your results, then click here to watch a free training video!

The Single Most Important Element of Successful Trading

Lately, we’ve been looking at the fundamentals of the Hawkeye trading methodology and breaking down the core tools that drive the Hawkeye system.

Today, I want to continue our discussion of trading fundamentals…

And talk about perhaps the single most important element that EVERY trader needs if they want to be successful.

I’m talking about a trading plan.

Now, if you’ve been a Hawkeye trader for a while, you’ve likely seen our training on the 3 keys to a winning trade plan.

If you haven’t seen that training, don’t worry, because I’m going to be detailing the 3 keys for you in upcoming issues.

First, though, it’s important to understand precisely what we mean when we talk about a trading plan…

See, a trading plan is a written set of rules that defines how and when you will place trades.

A trading plan includes the markets that will be traded…

The timeframes you’ll use to make your trade decisions…

The indicators and settings that are applied to the charts that you trade from…

All the rules about how much you’ll risk on any one trade, a.k.a. position sizing…

And, of course, your rules for entering, managing, and exiting each trade.

Now, a trading plan also has some very specific characteristics.

See, it’s not enough to simply duplicate someone else’s trade plan, because every trader has their own unique quirks, preferences and peculiarities.

That’s why the first characteristic of a trade plan is that it’s PERSONAL.

A good trade plan is tailor-made to fit YOU, the individual trader.

But here’s the thing…

As you gain more experience and knowledge from trading over time, you’ll learn things and make discoveries about your own trading that will require you to update your trade plan.

Which means the second characteristic of a trade plan is that it’s a “living document.”

Yes, your trading plan will… and should… evolve over time.

The catch here is that you must only make updates to your trading plan AFTER the market is closed for the day…

And NEVER in the middle of an active trading session.

Now, before we dive into the 3 keys to a winning trade plan, let’s briefly talk about why having a documented plan is so crucial to successful trading.

I like to think about preparing a trade plan like a mountain climber approaches preparing for a major expedition.

I mean, think about it…

Any serious climber looking to scale a challenging mountain has several things in place before their journey ever begins.

Of course, the climber will undergo intense physical training…

They’ll have a map that they’ll study for hours on end, learning the lay of the land and examining all the possible routes to the top…

They’ll research the weather… the terrain… what kind of wildlife they may run into…

They’ll make an exhaustive list of everything they need to pack to make sure they’re equipped for any scenario…

They’ll have an idea of where along the route they’ll be able to stop and rest so they can complete the entire journey…

And they’ll have a journal or a camera they can use to document the journey and recount mistakes they made so that they don’t repeat those same mistakes later.

Well… it’s the same with trading.

See, the mountain climber who fails to carefully plan his expedition will likely encounter disaster.

And the same is true for traders venturing out into volatile markets without a trading plan.

Your trade plan keeps you on course… and helps you avoid traps and hidden dangers along the way.

Now, in the next issue we’ll start breaking down the 3 absolutely critical keys to a winning trading plan…

But in the meantime, if you’d like to learn more about how Hawkeye can help you make better, more informed trade decisions and keep you in line with your trade plan, just click here to view a free training video now!

Volume Trading Essentials For The Everyday Trader

I hope you’re having a great week so far!

Last week, we started looking at the fundamentals of volume trading with Hawkeye.

I showed you how the Hawkeye Volume, Radar, and Paintbar indicators work to give you a foundational view of the interaction between volume and price…

And how you can begin using them to make better informed decisions no matter what instrument you’re trading.

Well, today I want to dive a little bit deeper into the next layer of indicators that work synergistically with the Volume, Radar and Paintbar…

And when combined, give you everything needed to use Hawkeye’s proprietary 3-Step Method for entering and exiting trades with precision.

Now, last time I told you that the Hawkeye Starter Package includes the Hawkeye Volume, Radar, and Paintbar indicators — the three most critical, foundational tools in the Hawkeye stable.

But the Starter Package also includes two other important tools that help keep you safe from fluctuations in the market and choppy price action.

I’m talking about the Hawkeye Pivots and Hawkeye WideBar.

Take a look:

Now, you’ll recall that the larger yellow dots you see along the top of the Volume indicator at the bottom of the screen are the Hawkeye Volume Radar.

But if you look closely, you’ll see smaller yellow dots at the tops and bottoms of certain price bars.

Those are the Hawkeye Pivots.

The Pivots identify isolated highs and isolated lows in the market.

An isolated high would be a price bar with a higher high AND a higher low than both the previous and the next bar, while an isolated low is a bar with a lower low and a lower high than the previous bar and the next bar.

Now, the Pivots are a lagging indicator, meaning the software doesn’t paint the Pivot dots in real time.

However, when you see a Pivot form, you can expect to see three to five bars of price retracement follow.

Now, let’s quickly talk about the Hawkeye WideBar before we move into the Trend + Stops.

See that big, purple price bar right in the center of the chart image above?

That’s a Hawkeye WideBar.

Now, the WideBar signifies a price bar that has twice the average true range (ATR) of any of the preceding 14 price bars.

Whenever you get a price bar that has two times the ATR of the preceding 14 bars, Hawkeye paints that bar purple…

And when you see this, you can expect one of two things to happen next:

  1. Price will return to trade within the range of the purple bar for the short term
  2. Price will make a true breakout in one direction or the other

In other words, the WideBar alerts you to a coming breakout…

Or a fakeout.

Now, with those 5 indicators, you’re able to begin leveraging the predictive power of volume in your trading.

But by adding the Trend + Stops Module, you have all the necessary components to follow the Hawkeye 3-Step Method for entering and exiting trades with laser-like precision.

Let me break down the Trend + Stops Module for you.

Looking at this chart from left to right, you see a series of white dots at the base of the price candles that turn green as price is rising…

Then, as price starts moving sideways, you see those dots turn white again.

Those dots are the Hawkeye Trend tool, and they let you know when price is in a trend.

Green dots mean price is trending upward, or long…

Red dots signify a down trend, or short…

And white dots represent a neutral trend, meaning price is in congestion, consolidation, accumulation or distribution.

Now you may have heard the phrase, “The trend is your friend.”

That’s true, but I’d add one caveat:

The trend is your friend… until it’s not.

A consolidation period, or sideways, choppy movement that would be signified by white trend dots, absolutely decimates a trend trading strategy.

That’s why it’s just as critical to know when NOT to be in a trend as it is to know when to jump into one.

Now, the last piece of the puzzle is the Hawkeye Stops.

See the little crosses below the price bars and the trend dots that are connected with a green line?

That is the Stops indicator, which as the name implies, shows you where your stops should be at any point along the trend.

Now if the trend is long, you’ll see green stops below the price bars…

And if the trend is short, the stops will be colored red above the price bars.

These stops are also a very good indication of support and resistance, and you’ll often see price treat those levels as such.

Now, as I mentioned, these tools combined — the Hawkeye Volume and Trend + Stops indicators — give us the foundation for following the 3-Step Method…

Which gives us a standard, step-by-step approach for making definitive decisions on entering and exiting trades.

That means no more guesswork…

And no more emotional decisions.

Instead, you simply follow the simple rules to manage your trades.

Now, we’ve put together a special training video that shows you how you can get started trading using these tools today… along with a very special offer on the Hawkeye Volume and Trend + Stops package.

You can view it for free right now by clicking here!

Simple Risk Management Strategies To Prevent Devastating Losses

It’s been another wild week in the markets, with the S&P coming within a hair of an all-time closing high on Tuesday and Wednesday.

What’s more, Tesla stock moved even higher after the automaker announced a five-for-one stock split to take effect at the end of the month.

Now, if you recall just about a week ago we talked about Apple’s four-for-one stock split and what that meant for investors…

But today I want to continue our conversation from Monday about trading fundamentals.

In that issue, I walked you through the very basics of volume trading with Hawkeye, including a look at our primary set of indicators.

This time, though, I want to talk about something that many new traders overlook…

Most often to their own detriment.

I’m talking about risk management.

Now, if you follow trading news, you know that 2020 has seen the largest influx of retail traders in history.

The trouble is that oftentimes, new traders are attracted to the markets because they see it as a quick way to make some easy money…

And they don’t give enough consideration to the RISK that is inherent in trading.

Modern broker platforms like the popular Robinhood app don’t make it any easier, with their flashy marketing and gamified approach to trading.

But here’s a truth that I have said before and that I will continue to stand behind:

If you don’t have a documented trade plan that dictates every single trade you make — INCLUDING profit target and stop loss levels — then you are not trading…

You are simply GAMBLING.

Now, one of the first steps in developing your trade plan is determining your risk level.

Your risk level, as you may have guessed, is the amount of capital you are willing to lose on any given trade…

And it’s enforced by what we call a stop loss.

Stop losses are one of the most fundamental tools when it comes to risk management.

A stop loss is a predetermined price at which you will sell the instrument you’re trading and take a loss.

For instance, say you want to go long on a stock that’s currently trading at $20.

You manage to get in at $19.95…

So you set your stop loss at $19.90.

That means that if the stock price dips down to $19.90 or below, the stop loss order will kick in and your broker will sell the stock for you.

As you can see, this prevents you from losing too much on any one trade if it turns and goes against you.

Now, that’s all well and good…

But how do you determine where you should set your stop loss on any given trade?

Well, many traders use the one percent rule.

This rule states that you should never put more than one percent of your account balance at risk on any single trade.

So, if you’re starting out with a $5,000 account, the one-percent rule means that you would only risk $50 on any trade.

Now, depending on what instrument you’re trying to trade, a $50 risk may be somewhat limiting…

But, as your account value grows, you can start looking at position sizing, which essentially means increasing the number of contracts per trade while keeping your risk level the same.

We’ll talk more about position sizing… as well as take profit levels, which is the other side of stop losses, in a future issue…

But for now, if you want to learn more about how Hawkeye can help you get started with trading using a tried-and-true, methodical method that ensures you’re TRADING and not GAMBLING…

Then click right here to view a free training video that will walk you through the fundamentals of the Hawkeye system!.

Welcome to Summertime Trading

Welcome to summertime trading. In today’s market update, I talk about summertime trading characteristics, and give my unique perspective on what to expect going into vacation season.

From the charts

Most of the major markets are currently in consolidation. This is where price trades sideways for a certain period of time, and the price action is characterized by choppy, range-bound prices. Volume is usually lower, and the volatility flat.

The S&P, Dow, and Russell markets all show neutral trend dots, and the Nasdaq, while still in an uptrend, is nevertheless in congestion. The Bond markets are showing signs of accumulation as funds are rotating more out of stocks. This can be seen by a rising US dollar index as well.

Gold is the only market that shows building energy (Fatboy chart), but even the charts show a hesitation of precious metals as it attempts to break into new highs. Last but not least is Oil, which has gone flat in a tight range between $42 and $37. While the daily trend for $CL is bullish, the weekly trend is congested bearish, and the monthly trend is bearish.

The Hawkeye Perspective

Summertime trading is characterized by chaotic prices, and choppy, range-bound trading. Many traders have left their desks and gone on vacation, leaving the markets to the autobots. So trade with more caution than usual, pulling in your profit points and stops to account for the choppiness. Look for other strategies to trade these markets, and trend/momentum based strategies typically get hammered in choppy markets. Stay abreast of the market by getting a copy of your own Hawkeye indicators of tools. Learn what volume and price are telling you by learning to trade the Hawkeye way.

How to Double Your Account Every 36 Days

If you’re like most traders, you dream about hitting those “home run” trades…

You know, the ones that will bring you 100, 200, or even 500+% profit in one fell swoop.

Of course, with so many systems and algorithms being advertised as “the only system you need to rake in 1,000+%,” it’s no wonder why so many traders have these grandiose dreams.

Now, don’t get me wrong — it’s entirely possible to hit a “grand slam” trade…

Home run

But the reality is that they are few and far between.

Discover How You Can Fire Your Boss… And Make A Full-Time Living At Home With Base Hit Trades

Here’s the truth…

It’s much easier to get on base than it is to knock one out of the park…

And, in fact, by racking up smaller “base hit” wins on a more frequent basis, you can theoretically double your account in just 36 days.

Let me explain…

You see, in finance, there’s a mathematical principle called the Rule of 72.

This rule states that if you divide the number 72 by a fixed rate of annual return, you’ll find the number of years it will take to double your money.

Rule of 72 diagram

As you can see, at an annual rate of 4%, it would take you 18 years to double your money…

And while the chart doesn’t show it, an annual rate of 2% would mean you’d wait 36 years before seeing a 100% return.

But what if, instead of an ANNUAL rate of return, you were making a DAILY rate of return of just 2%…

And rolling those earnings over into the next day’s base hit win?

Can you see now how easily you could actually DOUBLE your account in a mere 36 days…

Just by making a 2% profit every day?

It may seem counterintuitive… but the numbers don’t lie.

Consistently bagging smaller gains… 2, 3, even 5%… can add up to BIG returns in a relatively short period of time.

In fact, it’s entirely possible to earn a FULL TIME living by making base hit trades from the comfort of your own home…

In less than 30 minutes per week.

So if you’re ready to learn how you can fire your boss and trade from home for a living…

Enjoying the freedom to live life on your own terms…

Then click here to get free access to our on-demand webinar.

Learn to trade the Hawkeye way.

How to Trade On the Exchange Floor Without Leaving Your House

The Secret Indicator Used On the Stock Exchange Floor Every Day

Have you ever visited a stock exchange and watched the floor traders live and in person?

Of course, ever since 9/11, that’s much easier said than done…

But if you’ve actually been there, right in the middle of the action…

You know there’s an energy on the trade floor that just can’t be felt anywhere else.

Open outcry trading

Learn How To Trade Like The Bigwigs On Wall Street

Here’s the thing…

That energy… that palpable excitement that surges through the exchange as a massive opportunity begins to break out…

THAT’S the real indicator those floor traders rely on.

Of course, most trading algorithms and indicators used by Main Street traders like us are based on price and time.

… But the truth is, neither price nor time tell the true story of what’s going on in the market, for one simple reason…

They’re based on historical data.

In other words, they’re what we call lagging indicators

And the fact is, there’s only ONE indicator that actually leads price, rather than lagging behind it.

It’s that rush of energy that erupts on the exchange floor as traders start yelling “Buy, buy, buy!” or “Sell, sell, sell!”

For decades, the only people who could use that indicator were the ones actually there, on the stock exchange floor…

But now, everyday traders like you and I can harness that powerful indicator… that invisible force that courses through the exchange like a million watts of electricity…

How, you ask?

Easy…

With the power of V-SWARM.

Testimonial

If you’re ready to learn more about V-SWARM…

The ONLY indicator that actually leads price moves instead of lagging behind them…

Then click here to join an on-demand webinar today!

Learn to trade the Hawkeye way.

So, I Thought I Could. . .

By Guest Contributor, Michele Hurlbut

Hi everyone, it’s Michele again.  So, I thought I could just open my charts and start trading my new software without spending time going through all that training. You know, I thought I could save some time and make money too, right? Well, things don’t always work out the way you plan, so here is my first journal entry:

On Friday afternoon, I downloaded my Hawkeye Professional Package and then closed my charts and computer with the intention of getting back to it later that day.  Also, I planned to start setting things up and reviewing the website over the weekend.  Guess what? Yep, surprise, that didn’t happen.

And here it is Monday, and I haven’t reviewed the software material.  I think to myself, “I’ve been trading for a while, and I’m familiar with many indicators, how hard can it be?” So, I thought I could do this.

So I open my charts and my new software, and start trading.  (I bet you’re laughing to yourself right now thinking ‘I’ve been there’ and ‘oh, is she going to be in trouble…’)  Fast forward a few hours and I am soooo glad I was in Sim mode today!!  Yep, total disaster (note: please don’t try anything new with live money!)  I did have a couple moments of ‘true brilliance’ I tell myself as it goes to my target. But reality is that most of the day was utter chaos and “willy-nilly” entries.

Why?  Because my Ego got in the way; I can read a chart! I can read price action! Why do I need to look at videos and learn the way this software is supposed to work? (She writes “tongue in cheek”).

Ok, let’s go back to my first article to you. Do you remember the reason I bought the Hawkeye system? Because the volatility of the market had increased to a point where my current system Reward:Risk ratio did not work.  So then why do I think I can 1) use my current trading style on different colored charts and expect a better outcome (the definition of insanity 😉); and 2) totally throw money away by purchasing a system that I am not taking full advantage of?

Now that I write this on paper, it seems so silly to let my Ego get in the way of my success.  The Ego is a wily creature that creeps up on you when you least expect.  It takes control and then we/I usually end up in negative P&L territory.

A strong person will recognize when Ego has taken over (it may be in hindsight, but it is recognized all the same). Once recognized, they turn the situation around to where their rational self is back in control.  Now they can drive their own “destiny bus” down the Highway.

So, I thought I could jump right into trading without taking the time to learn the new system, and I was so wrong. Now I am off to watch my lesson videos. I can’t wait to see the wonders there! Have a great week everyone!


Join Randy in the next free LIVE Hawkeye Demonstration Room held every Wednesday at 9.30am EST US. You will learn more about volume and volume price analysis and see more examples and live trade setups. It is open to all.

Click this link for more information or to join us in class.

Learn to trade the Hawkeye way.

Randy Lindsey
Hawkeye Traders, LLC

A Hawkeye Volume Setup for +90pips on the EURAUD

Australian flag

There is no better tool to trade with than Hawkeye Volume!

Why?

I’m glad you asked. . .

Volume is a leading indicator, signaling the intentions of price ahead of time. You have heard it said that “Volume is the fuel that drives the market”. And traders all over the world gain the edge they are looking for when Hawkeye Volume is coupled with triple timeframes.

Hawkeye Volume and Price

Hawkeye makes volume price analysis simple. The Volume indicator shows whether buying or selling is dominating the market using simple color codes:  Red shows professional selling, Green shows professional buying, and White shows no demand. In other words, it doesn’t just tell you the volume, as with other trading software, but it actually tells you whether the volume is professional BUYING or professional SELLING.

Below is a nice example of a 15 minute EURAUD setup:

Hawkeye Volume leads to +90 pip EURAUD Setup

Notice how just before the big price move down, that Volume signaled the intent of price way before the trend began, shown by the oval and Red price bar extension. The red bar also has a Hawkeye Pivot (yellow dot). Therefore, we expect price to reverse 3-5 price bars after a Pivot. With opposing volume however, it is a compelling signal of market reversal. On top of that, we also see a Price Action Failure, shown by the aqua box on a triple top. Here, volume and price are working together to signal the intent of price to make a substantial move down.

The results were quite rewarding, as this example shows. Using the Hawkeye ATR Levels tool, a 8:1 Reward:Risk value was achieved, yielding a potential +90 pip trade. Note that the entry was a standard Hawkeye setup, following our 3-Step Entry/Exit Method. Our training courses teach this Method. These types of setups occur every day, and Hawkeye Volume is the best at showing you this action.

The Hawkeye Perspective

Don’t sit by and let trades like this pass you up. . .  As a core component of all our unique indicators, Hawkeye Volume leads the way to a trading plan that can generate consistent profits daily.


Join me in the next free LIVE Hawkeye Demonstration Room held every Wednesday at 9.30am EST US. You will learn more about volume and volume price analysis and see more examples and live trade setups. It is open to all.

Click this link for more information or to join us in class.

Learn to trade the Hawkeye way.

Randy Lindsey
Hawkeye Traders, LLC

[sg_popup id=13743]