Trending Market Insights: Nearly 900 Tick NQ Rally

Join countless traders worldwide who use
the Hawkeye algorithms day in and day out to gain a powerful edge

Trending Market Insights: Nearly 900 Tick NQ Rally

trending market

Trending Market Strategy: Nearly 900 Tick NQ Rally Identified On Hawkeye Congestion Exit Setup

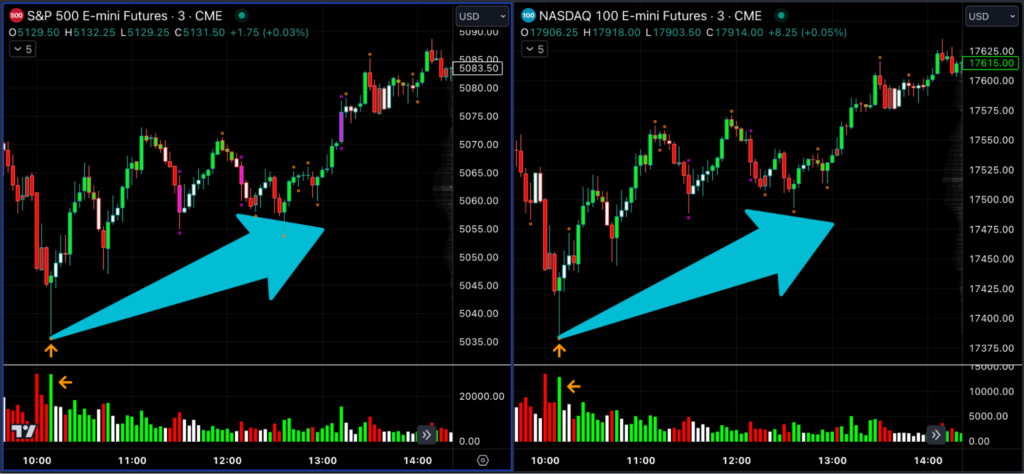
Anthony Speciale here with Hawkeye Traders. I hope everyone is having a phenomenal day as we witness record highs on the NASDAQ and the S&P 500.

It’s an exciting time, and today, I want to share some valuable insights on how you can approach a strong trending market.

When the market is trending strongly, it’s natural to feel uncertain. You might think, “The market can’t go any higher, can it?” and start wondering if you should short it.

Conversely, in a downward market, you might think, “Maybe this is the bottom,” and consider going long. This mindset can lead to trouble.

As someone who has worked with traders for many years and overcome my own hurdles, I’ve learned that when the market is trending, it is often exhibiting momentum.

Think of it like rolling a ball – it will keep rolling until it encounters resistance or support.

As long as market participants don’t see the market as overpriced or underpriced, there’s a better chance of success by trading with the trend rather than trying to pick the session high or low.

Attempting to pick highs and lows can shift your mindset from trading to gambling, which is dangerous.

In gambling, the odds are against you. If you approach the market with consistency and discipline, employing your personal trade plan, you shift the odds in your favor.

This is the difference between gambling and trading.

In a strong trending market, there’s a better chance that the market will continue in its direction rather than reversing suddenly.

I’ve experienced this firsthand. In my early career, I tried picking highs and lows, but as I learned from my losses, I started waiting for clear patterns before making my move.

It’s better to be slightly late to the right party than early or on time to the wrong one.

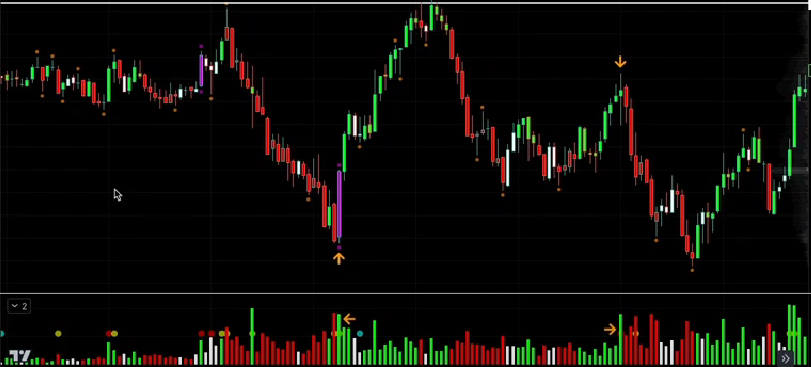
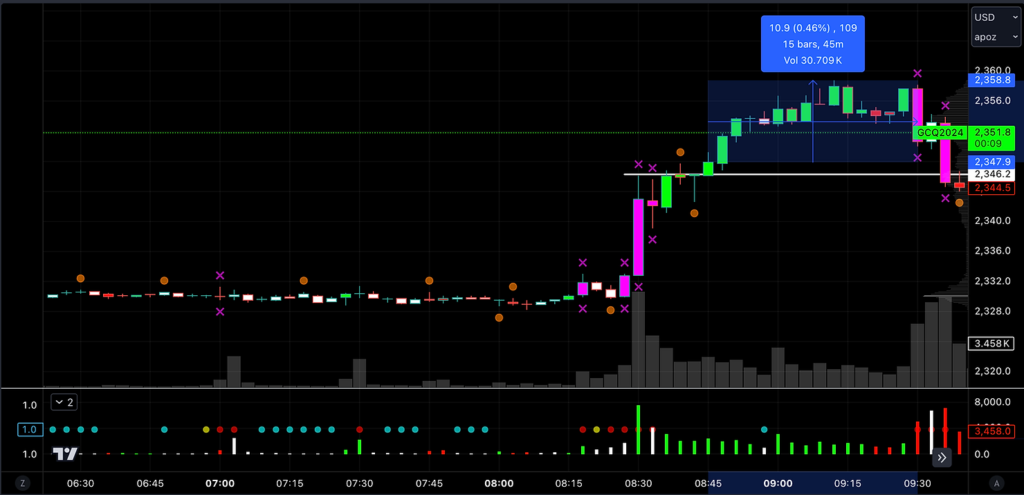
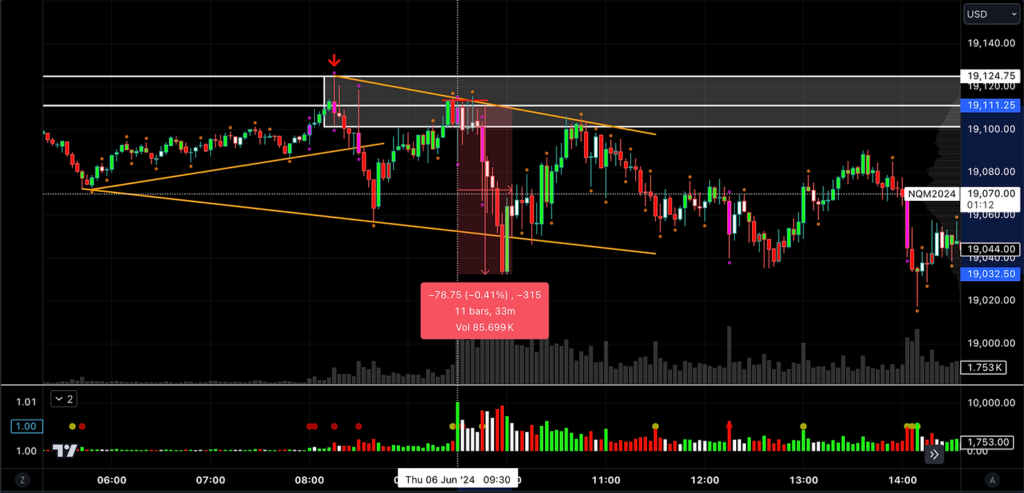
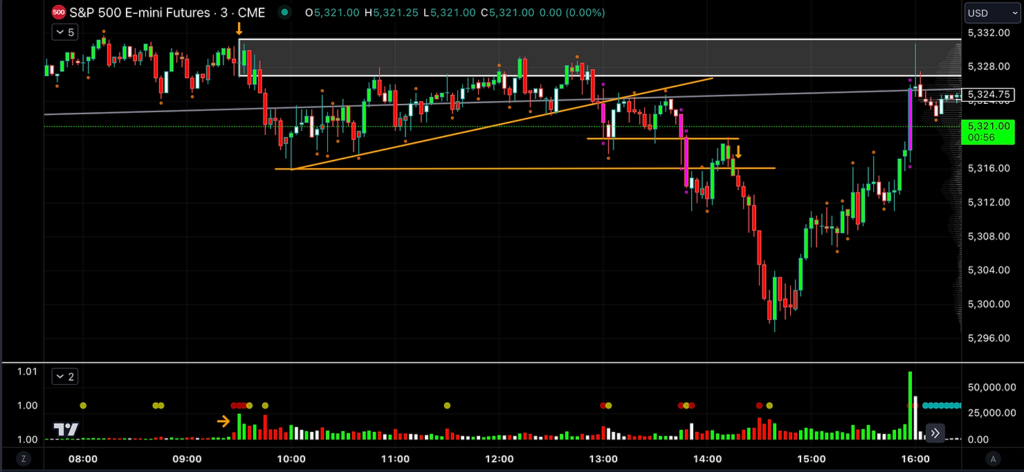
Let’s dive into a practical example using the NASDAQ. Today, I want to focus on the Hawkeye Wide Bar. This tool is particularly useful in strong trending markets.

trending market

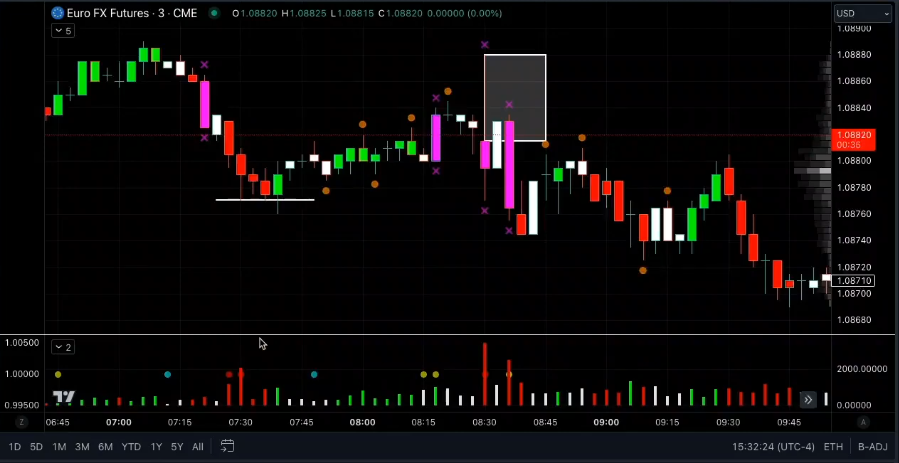
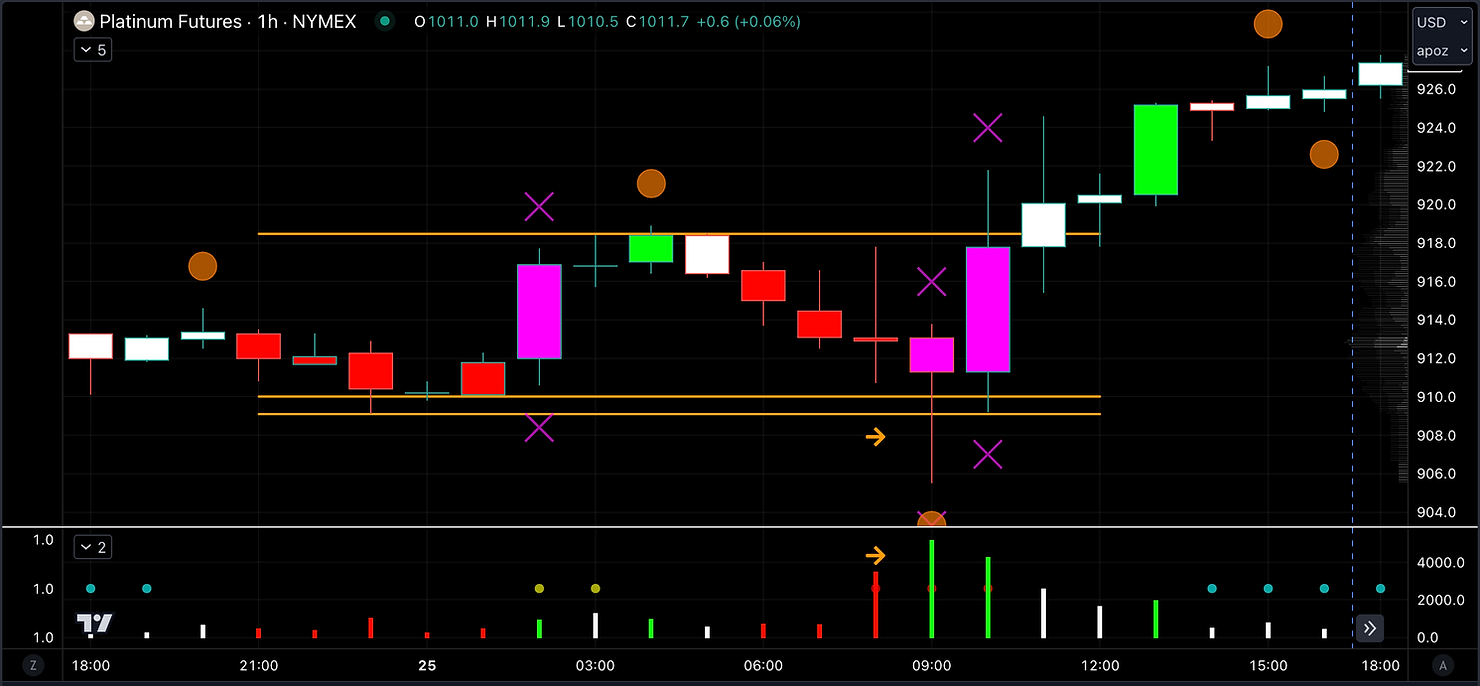
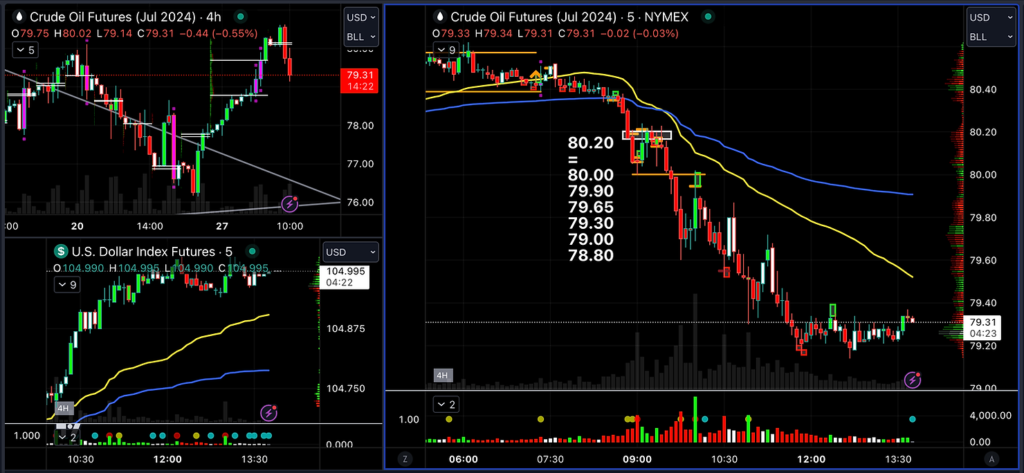
We’re looking at the NASDAQ 100 E-mini Futures on a 5-minute chart, using the Hawkeye Volume, Paint Bar, Wide Bar, Pivot, and Radar Dot indicators.

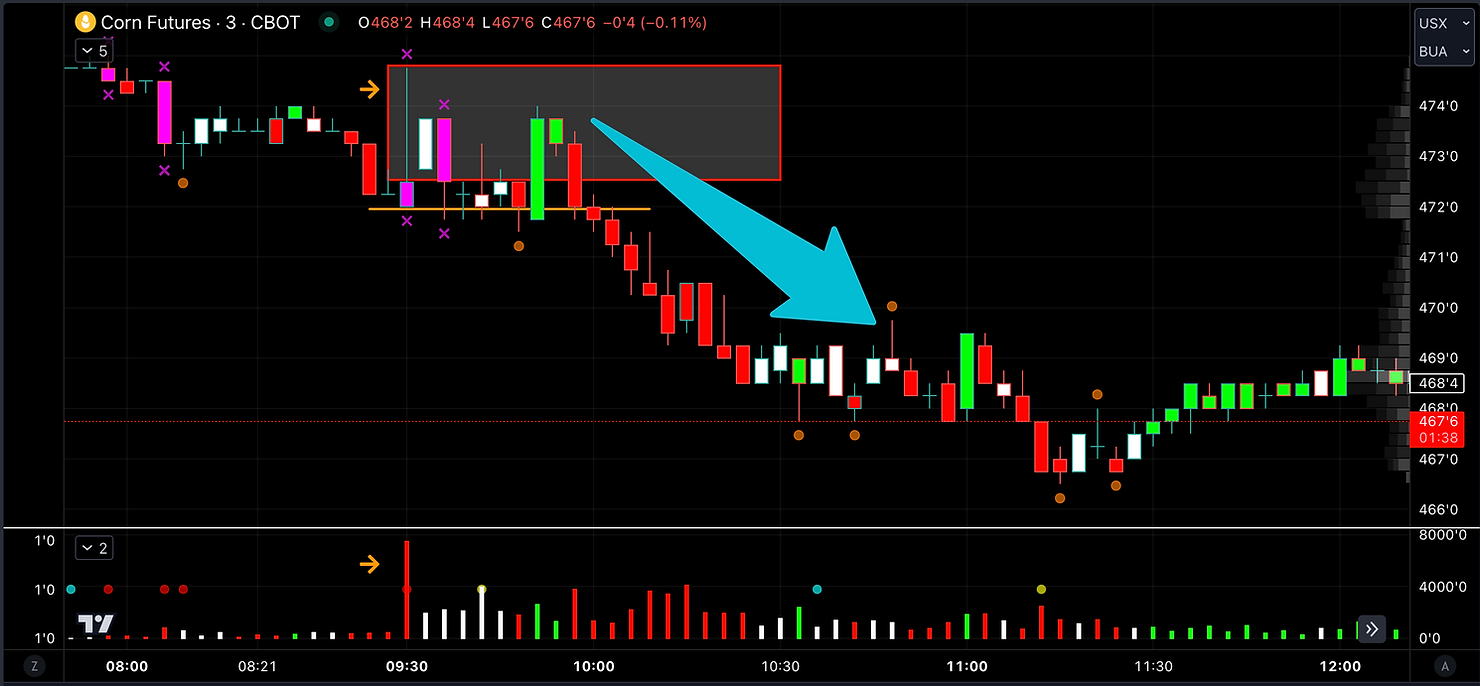
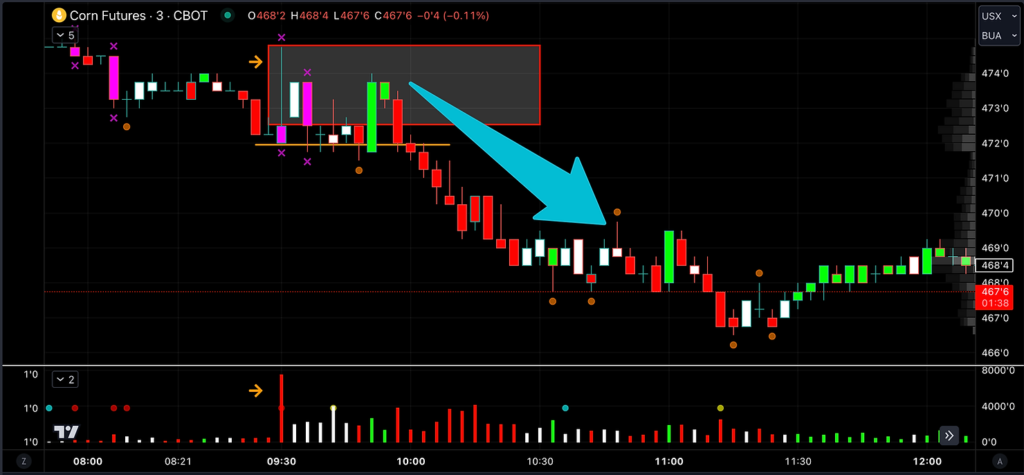
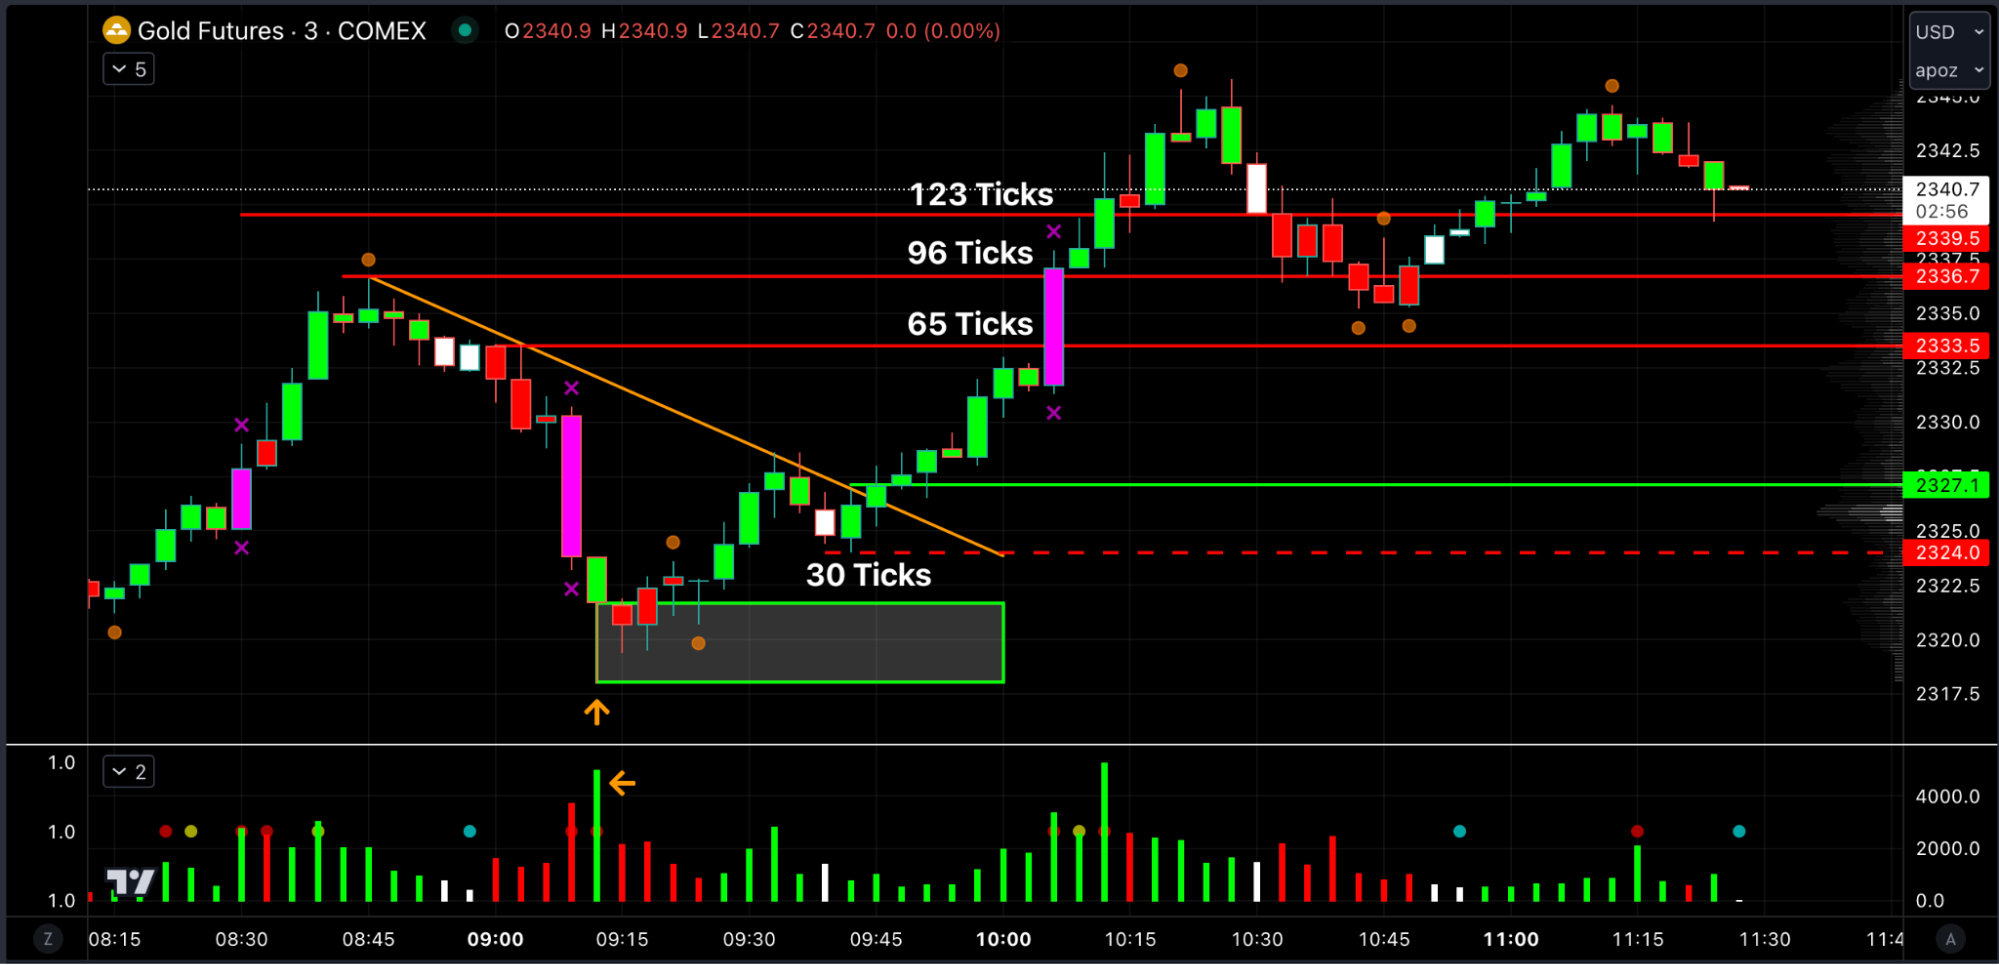
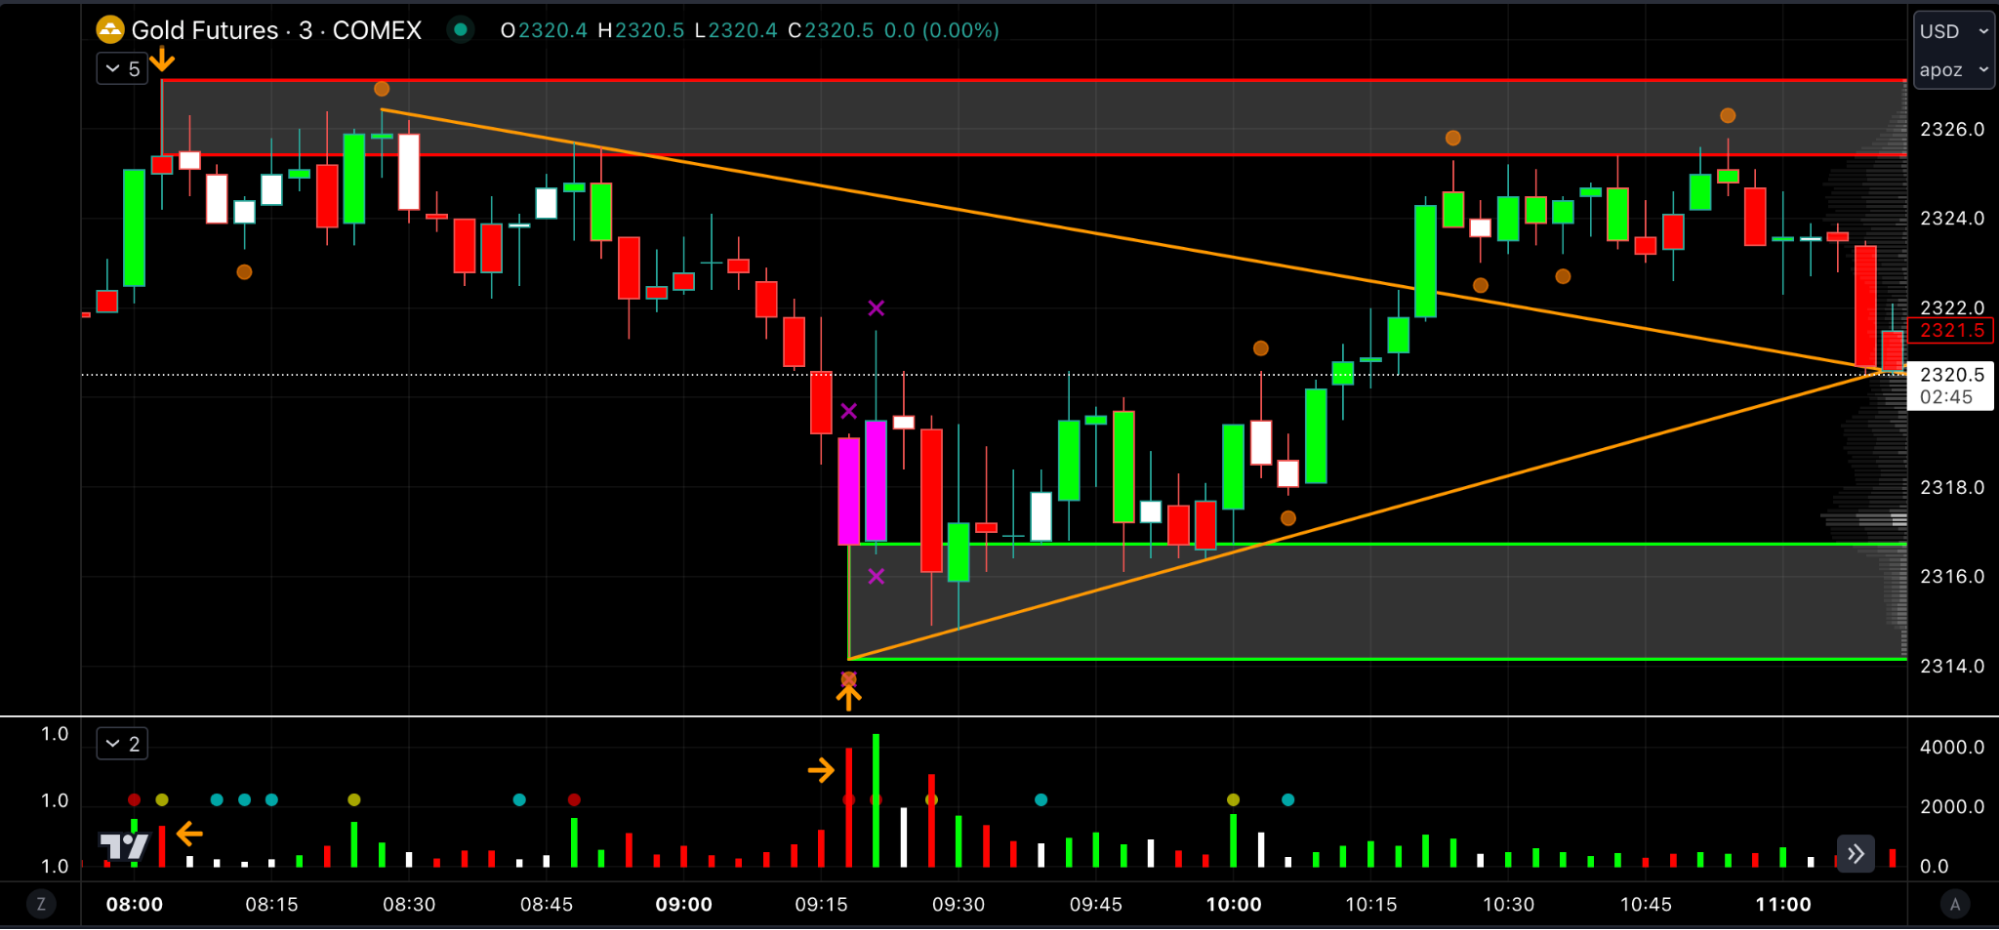
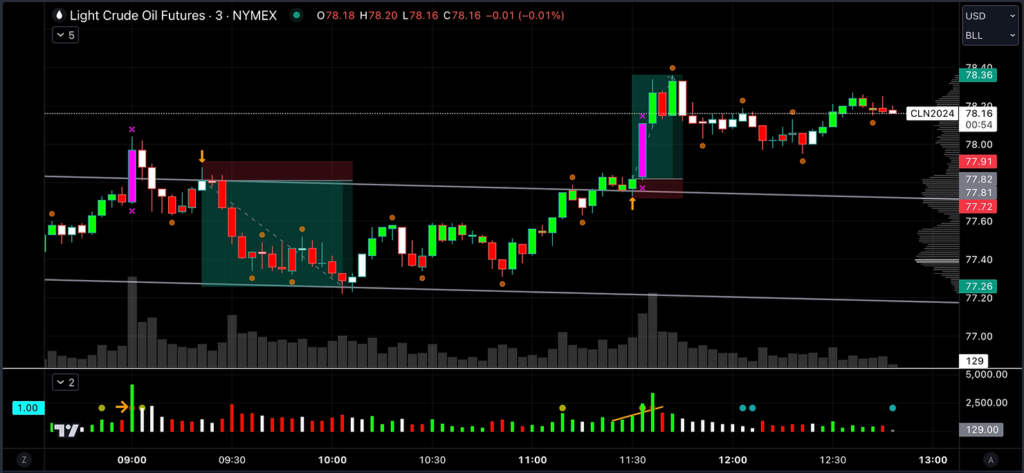
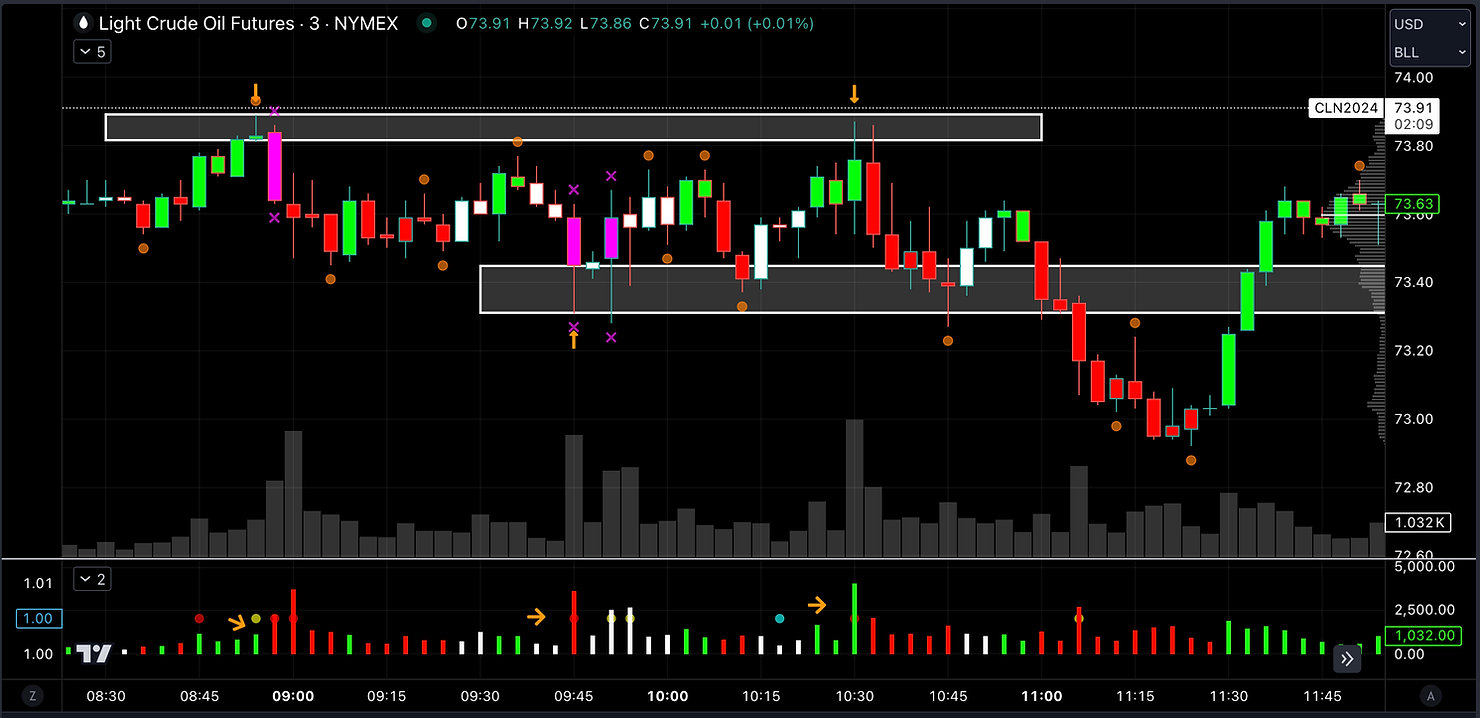
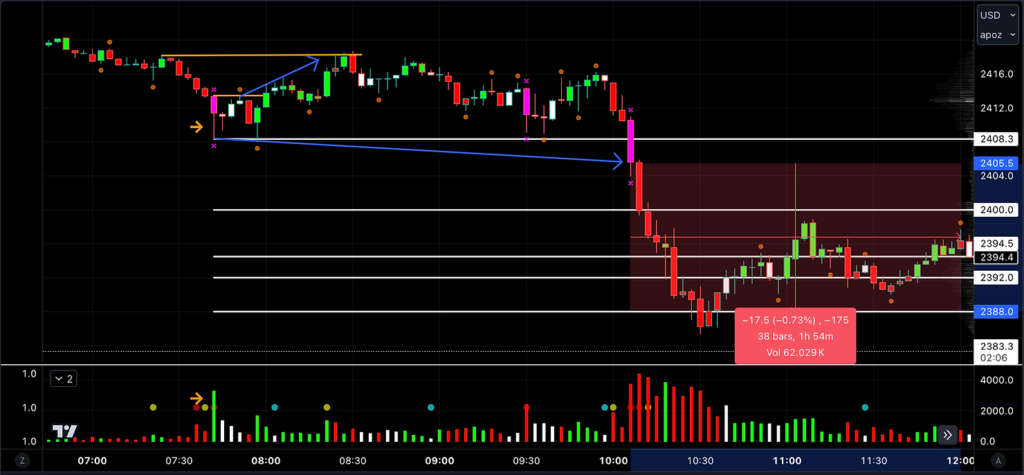
In a trending market, I pay special attention to the Wide Bars, marked in magenta.

When a Wide Bar appears, I draw lines at its high and low.

This helps me identify potential support and resistance levels. For instance, if the market consolidates and then closes above a Wide Bar, that bar becomes support.

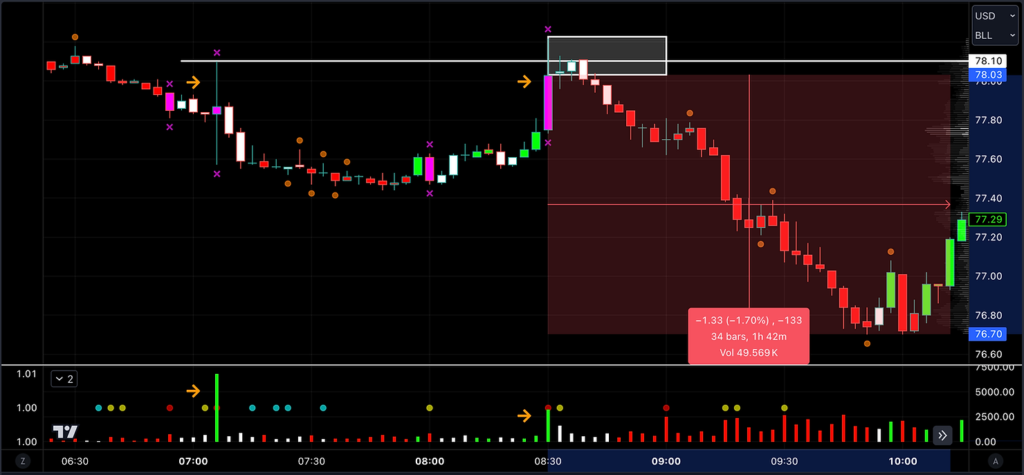
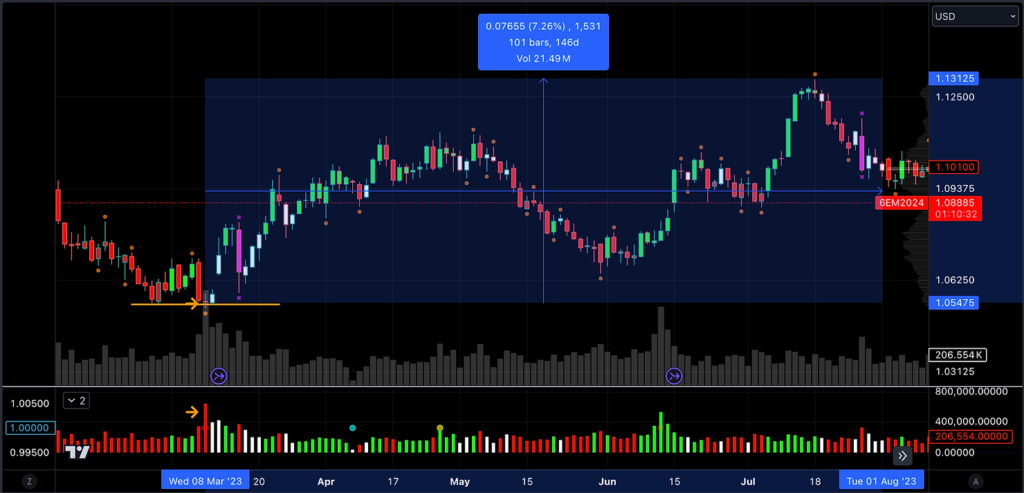
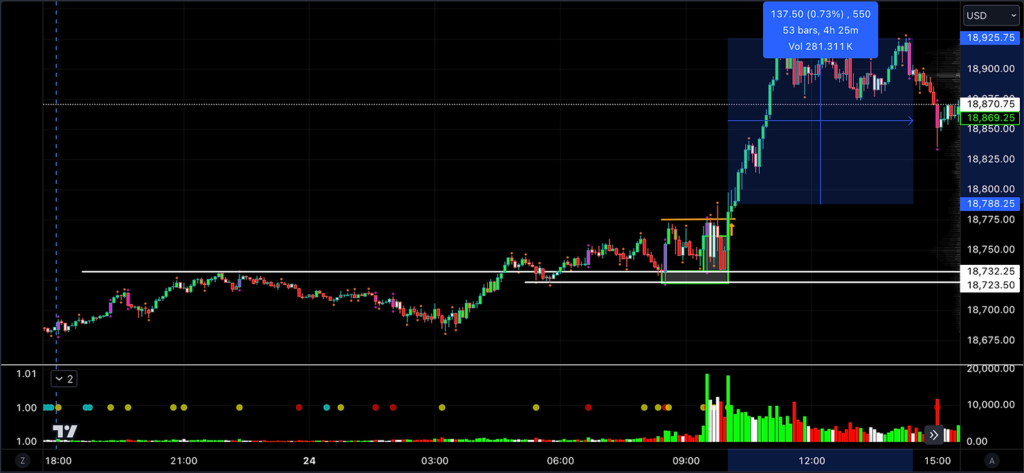
Let’s look at an example. We had a Wide Bar that formed, and the market consolidated above it before rallying over 720 ticks.

This confirms the continuation of the trend. Similarly, another Wide Bar later in the day marked the high of the session, providing resistance.

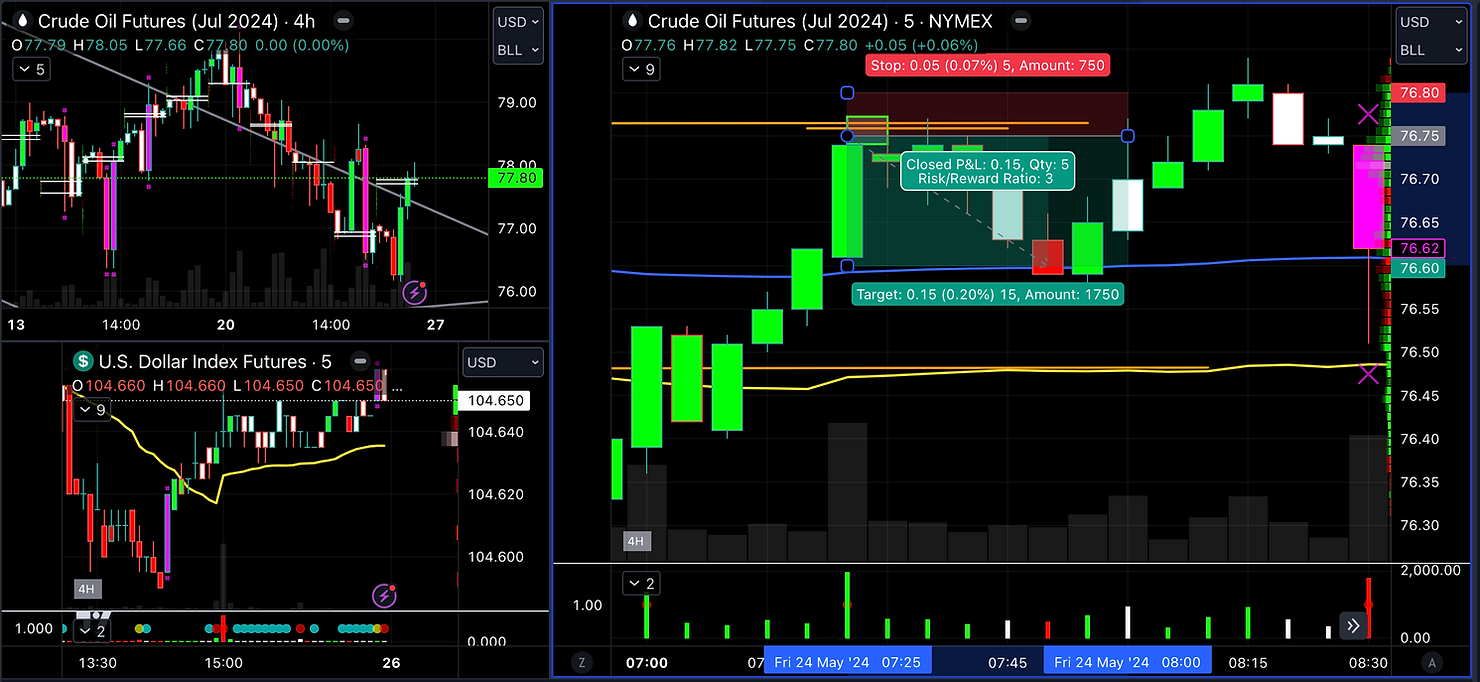
Using these tools, you can make informed decisions about when to enter and exit trades. It’s crucial to wait for confirmation and not rush into trades.

The Wide Bars, along with volume analysis, give us the insights needed to navigate the market effectively.

If you’re not using Hawkeye Tools, I encourage you to consider them. They provide a clear and concise way to analyze the market, helping you make better trading decisions.

Additionally, our Hawkeye Volume and Price Action Mastery Library offers comprehensive education on how to use these tools effectively.

I invite you to access our resources, and reach out to our team with any questions.

We’re here to help you fine-tune your trading approach and achieve trading success!

Happy Trading,

Anthony Speciale

Hawkeye Traders

Big Energy Profits

Volume Spikes: Using WideBars for Support and Resistance

volume spikes

WideBar Defining BOTH Support and Resistance with Volume Spikes

Anthony here from Hawkeye Traders, and today I want to share a powerful strategy with you—one that’s often overlooked but can significantly enhance your trading game: leveraging volume spikes to pinpoint key market areas

In this video, we’re diving into a real-life example with Nvidia on a daily chart. We’ve all seen those wide bars on our charts, but do you know how to interpret them? These wide bars signify significant volume spikes, often indicating pivotal moments in price action.

Let’s break it down. When Nvidia attempted to break above certain highs but encountered strong selling with a wide bar, it created what we call a volume climax. This typically establishes a zone of resistance where buyers struggle to push prices higher. 

Conversely, when Nvidia experienced strong selling followed by zero follow-through and a wide bar to the downside, it signaled potential support—a level where buyers stepped in to drive prices back up.

Here’s the key insight: integrating volume spikes alongside price action gives you a holistic view of market dynamics. It’s like unlocking the missing piece of the puzzle. By paying attention to these volume radar dots and wide bars, you gain a deeper understanding of market sentiment and potential future movements.

Personally, I use the Hawkeye indicators to spot these critical signals. Whether you’re day trading, swing trading, or investing across various assets, these indicators provide clarity and confidence in your trading decisions. They’re compatible with platforms like TradingView, TradeStation, NinjaTrader, and MetaTrader—ensuring you can apply these principles across different markets seamlessly.

I encourage you to take action today. Click the links below to watch the full video and explore our Hawkeye Mastery volume library. Dive into the content, ask questions, and equip yourself with the tools that have transformed my trading—and can transform yours too.

Remember, understanding volume isn’t just about reacting to current trends—it’s about anticipating future opportunities. Don’t miss out on harnessing the power of volume to elevate your trading strategy.

Click below to watch the video now and start mastering volume spikes analysis:

ACCESS HAWKEYE TRAINING WEBINAR HERE

Take that next step towards becoming a more informed and successful trader. I look forward to seeing you in the video, ready to capitalize on every market opportunity.

Happy Trading,

Anthony Speciale

Hawkeye Traders

Big Energy Profits

Volume Confirmation: Trading Topping Patterns Effectively

volume confirmation

Trading A Topping Pattern Using Volume Confirmation

Anthony Speciale here from Hawkeye Traders, and I’m excited to dive into today’s strategy with you.

Today, we’re focusing on identifying topping patterns, bottoming patterns, and potential reversals in the market, using volume confirmation as a key trigger for entering low-risk setups.

Let’s start by looking at the US Dollar Index Futures. Recently, we’ve seen a clear topping pattern emerge as prices pushed into highs accompanied by significant buying volume.

However, despite these attempts, the market has failed to sustain these highs, forming what I identify as a meaningful resistance area.

When I pinpoint a potential high or low like this, my next step is crucial: I identify the nearest support or resistance level.

This step helps me gauge the significance of price movements and plan my trades accordingly.

In this case, the former resistance has now become a potential support level, which we’ve seen tested and retested in recent price action.

In trading, especially when dealing with tops and bottoms, it’s common for a neckline or support line to be breached and then retested.

This sets up a classic trading opportunity where we wait for the break, observe increased selling volume, and then look for a pullback above that level.

This approach minimizes our risk exposure while maximizing potential returns.

For instance, let’s take a recent setup where we identified a top formation.

After a break below support with notable selling volume, we waited for a pullback on neutral volume.

As soon as sellers re-entered above the support line, we entered a short position.

This setup allowed us to risk a small amount for the potential of capturing a substantial move to the downside—a strategy that delivered over a 5% gain.

The key here is understanding price action and combining it with volume confirmation to build a comprehensive trading thesis.

Whether you’re trading intraday, swing trading, or positioning yourself in the market, these principles remain universal and effective across various asset classes.

I’ve crafted this video to share these insights with you, showcasing how to integrate volume into your trading decisions.

By mastering these techniques, you gain a sharper edge in anticipating market moves and executing trades with confidence.

If you found value in this strategy, I encourage you to explore further by joining our upcoming training webinar.

This webinar dives deeper into volume analysis and price action strategies, equipping you with the tools to navigate complex market dynamics effectively.

Remember, successful trading is about minimizing risk and maximizing opportunities.

Click Here to access our webinar and deepen your understanding of these critical concepts.

I look forward to seeing you there and continuing this journey towards trading mastery.

Until then, may the markets be in your favor!

Happy Trading,

Anthony Speciale

Hawkeye Traders

Big Energy Profits

Ultra-High Volume: Triggers YTD Sell-Off in PLAY

ultra-high volume

Ultra-High Volume Surge, Triggers YTD Sell-Off

Welcome to another insightful session, Anthony Speciale here from Hawkeye Traders. 

Today, we’re diving into the world of intraday price patterns through the lens of a popular ticker, Dave & Buster’s (PLAY). 

This analysis will provide valuable insights into how to interpret price movements and volume to enhance your trading decisions.

Dave & Buster’s, a well-known entertainment venue offering a combination of dining, video games, and craft beers, presents a fascinating case for analyzing intraday price patterns. 

While the venue itself provides a unique blend of fun for adults, our focus here is on its stock chart and the implications of recent price actions.

Chart Analysis and Key Patterns

On April 3rd, 2024, Dave & Buster’s stock reached a new YTD high, marking a significant point on its year-to-date chart. 

This peak was a critical area of resistance, a concept that retail traders must grasp to make informed decisions. 

Resistance levels are price points where selling pressure tends to overcome buying pressure, often leading to price reversals.

As we scrutinize the chart, we notice that the stock hit this resistance multiple times before ultimately breaking through. 

This breakthrough was accompanied by an ultra-high volume, the highest recorded for the year, signifying a point of major indecision between buyers and sellers. 

Such ultra-high volume candles are pivotal as they often precede significant price movements.

Deciphering the Ultra-High Volume Candle

The ultra-high volume candle observed on the chart was neutral, indicating that both buyers and sellers agreed on the price level but couldn’t push it decisively in either direction. 

This neutrality can be a precursor to a potential reversal if the subsequent price action doesn’t support a continued trend.

In this case, after the neutral candle, sellers took control, leading to a decline.

The stock closed below the previous support line, retracing its gains and continuing to fall. As of now, the stock is testing the low for the year. 

This scenario highlights the importance of understanding volume in conjunction with price action.

ultra-high volume
ultra-high volume

Applying the Insights

For retail traders, the key takeaway is the ability to recognize these high probability reversal points. 

By identifying ultra-high volume candles and interpreting them within the context of the overall price action, you can anticipate potential reversals and adjust strategies accordingly.

In practical terms, if you spot an ultra-high volume candle followed by a failure to maintain higher prices, it might indicate that sellers are taking control. 

This insight could prompt you to consider short positions or protective measures if you’re already long.

Enhancing Your Trading

Understanding and applying the knowledge of price patterns and volume analysis can significantly elevate your trading strategy. 

It’s not just about recognizing shapes on a chart but understanding the underlying market sentiment they represent. 

By combining these insights with a disciplined trading approach, you can improve your decision-making process and profitability.

We encourage you to continually educate yourself on these concepts and apply them in your trading routine. 

If you’re ready to seek a further understanding and employ volume based tools to assist in your analysis, our team at Hawkeye Traders is here to help you succeed.

May your days be filled with profitable opportunities!

Happy Trading,

Anthony Speciale

Hawkeye Traders

Big Energy Profits

Volume Analysis in Trading: Insights for Market Movements

volume analysis in trading

A Sustainable Move -OR- An Emotional Reaction? Let’s find out with Volume Analysis in Trading

Anthony Speciale here from Hawkeye Traders, and today, I want to share some crucial insights about incorporating volume analysis in trading strategy, especially when dealing with significant economic news releases. 

This is a vital aspect of trading that can elevate your understanding of market movements and enhance your trading decisions.

volume analysis in trading

The Importance of Volume Analysis

Volume is a critical indicator that provides insights into the market’s strength and potential direction. 

Unlike price action alone or traditional lagging indicators, volume reveals the underlying sentiment and participation level of traders in the market

Recognizing this can help you make more informed trading decisions and avoid potential pitfalls.

Real-Time Analysis: The S&P 500 Case Study

Let’s dive into an example using the S&P 500. 

On a typical trading day, economic news releases, often scheduled at 8:30 AM EST, can significantly impact market movements. 

As a pre-market trader, I usually start around 7 or 8 in the morning and sometimes trade until noon. 

Some days, I’m done even before finishing my first cup of coffee, while other days require more patience.

On a recent trading day, the S&P 500 chart, set to three-minute candles, showed an aggressive push higher at the 8:30 AM candle. 

This surge was accompanied by ultra-high buying volume but failed to sustain beyond the initial spike. 

This failure indicated a high level of emotion-driven trading, often seen during economic data releases.

I marked the high and low of this candle and observed the market’s behavior. 

Despite the strong initial buying, the market eventually fell below the candle’s low, signaling a shift in control from buyers to sellers. 

This downward move continued, creating new lows for the session.

Recognizing Key Indicators

At Hawkeye Traders, we use specific indicators to highlight significant volume events.

Our wide bars, marked in magenta, represent candles with volume exceeding a certain threshold, indicating heightened trader activity and emotional responses. 

Identifying these wide bars can provide valuable clues about potential market directions.

For example, after the initial spike and subsequent decline, neutral volume followed, suggesting the absence of continued buying interest. 

The market then broke the low of the initial candle, retested, and continued downward, offering substantial trading opportunities.

Practical Application

Understanding where and when emotion occurs in the market can be incredibly powerful. 

By recognizing high volume areas and the subsequent control shift between buyers and sellers, you can make more calculated trading decisions. 

This approach is not limited to intraday trading; it applies to day trading, swing trading, and position trading across various markets, including stocks, futures, forex, and cryptocurrencies.

Our indicators are compatible with platforms like TradingView, TradeStation, NinjaTrader, and MetaTrader, making it accessible for all retail traders.

Access Hawkeye Indicators and Volume Mastery Training Today

Incorporating volume analysis in trading strategy can significantly enhance your market understanding and trading success. 

By focusing on the interaction between volume and price action, you can gain a clearer picture of market dynamics and improve your trading outcomes.

Thank you for joining me in this deep dive into volume analysis in trading. Stay disciplined, patient, and always keep learning. 

I look forward to sharing more insights with you in the next video. All the best!

Happy Trading,

Volume Analysis: Trading Gold Futures

volume analysis

Volume Analysis: Buying Continuation Above A Hawkeye WideBar – Identified LIVE

Anthony Speciale here with Hawkeye Traders.

Today, I’m diving deep into the crucial strategy of incorporating volume into our trading analysis, especially during significant economic data releases.

Let’s focus on the gold futures market, a prime example of how volume analysis can guide trading decisions in real-time.

Understanding Market Reaction to Economic News

In the world of trading, economic data releases like the Consumer Price Index (CPI), crude oil inventory reports, and Federal Reserve announcements can significantly impact market movements.

These events often bring heightened volatility, presenting both opportunities and challenges.

This morning, we witnessed a classic example of this with the gold futures market.

At 8:30 AM, the CPI report was released, leading to a wide bar with ultra-high buying volume.

This spike indicated a favorable market reaction, but the key question was whether this movement would sustain or if it was merely a volume climax—a temporary reaction without follow-through.

Volume Climax vs. Sustained Movement

A volume climax occurs when a sudden surge in trading volume leads to a sharp price movement, which then quickly reverses.

To avoid getting caught in such traps, it’s essential to wait for confirmation.

In this case, I advised waiting for a close above the high of the initial wide bar.

This confirmation would suggest that the buying pressure was not just reactionary but indicative of a sustained movement.

Real-Time Analysis and Decision Making

At 8:45 AM, we got the confirmation we were waiting for: a close above the high of the wide bar with continued buying support.

This indicated that the market was likely to continue its upward trajectory.

Indeed, the market rallied for over 100 ticks before hitting resistance around the 9:30 AM opening bell.

This real-time analysis was crucial.

By patiently waiting for confirmation, we avoided the potential pitfall of a volume climax and capitalized on a significant price movement.

This approach demonstrates the power of volume analysis in making informed, calculated trading decisions.

volume analysis
volume analysis

Patience: The Trader’s Virtue

Patience is often the hardest lesson for traders to learn.

It’s tempting to act on the initial surge of activity, but waiting for confirmation can significantly increase your chances of success.

In this instance, waiting just 15 minutes for a close above the high of the wide bar allowed us to confidently enter a trade with a clear direction.

Managing Expectations and Market Conditions

Later in the day, we anticipated further market turbulence with the Federal Reserve’s FOMC meeting minutes and rate announcements.

Knowing that these events could cause significant market shifts, it was prudent to avoid taking new positions until the market had digested this information.

Key Takeaways for Retail Traders

  • Volume Analysis: Always pay close attention to volume. High volume on a wide bar can indicate significant buying or selling pressure.
  • Wait for Confirmation: Avoid getting caught in volume climaxes by waiting for a close above (or below) the high (or low) of the wide bar.
  • Patience and Discipline: Be willing to wait for the right setup. This discipline can prevent costly mistakes and enhance your trading outcomes.
  • Risk Management: Always be aware of major economic events that could impact your trades and adjust your strategy accordingly.

Incorporating volume into your trading analysis, especially during significant economic data releases, can provide valuable insights and improve your trading decisions.

By focusing on volume, waiting for confirmation, and maintaining patience and discipline, you can navigate market volatility more effectively.

Thank you for joining me today!

If you’re interested in learning more about volume analysis and other trading strategies, explore the resources and tools available at Hawkeye Traders by CLICKING HERE NOW.

Until next time, stay disciplined, and stay informed!

Happy Trading,

Trading Breakouts and Volume Analysis

Trading Breakouts

Trading Breakouts: Using Volume To Identify BOTH A Failed Breakout And A Successful Breakout

Welcome to the video, everyone! Anthony Speciale here with Hawkeye Traders. I hope you’re having a fantastic day. 

Today, I want to delve into a couple of crucial strategies for retail traders: breaking out of trend lines or channel structures and employing volume to your advantage.

These techniques can be incredibly beneficial when applied correctly, regardless of the market or timeframe you are trading. 

Real-Time Analysis: The Key to Credibility

One of the reasons I emphasize real-time analysis is the credibility it brings.

When you can identify what’s happening in the market as it unfolds, it adds a layer of trust and reliability to your trading strategy. 

Hindsight trading, where you look back and say you would have done something differently, lacks this immediacy and practical relevance.

Scenario 1: The Failed Breakout

Let’s start with the first scenario. At 9:00 AM Eastern Standard Time, we observed a breakout from a channel structure. 

This breakout occurred on a wide bar with ultra-high buying volume, the highest volume traded up to that point in the session. 

Despite the initial push, the price did not close in the top 10% of the bar, leading to an immediate failure.

This situation, known as a volume climax, is a common pitfall.

When trading breakouts with ultra-high volume, be cautious if there is no immediate follow-through. More often than not, this leads to a failed breakout. 

In this case, the price fell back below the channel structure, turning what was once support into resistance. 

This shift provided a beautiful shorting opportunity across the channel structure, yielding over 50 ticks.

Scenario 2: The Successful Breakout

Later in the morning, at 11:21 AM, we saw another breakout from the same channel structure. 

This time, the breakout occurred on a reasonable uptick in volume—nothing extreme, but enough to be significant. 

Without any alarming volume spikes or radar dots, this breakout was more promising.

Here’s the critical part: after breaking out, the price retested the previous resistance, now turned support. 

During this retest, the volume increased, indicating a strong buyer presence.

By 11:30 AM, the price exploded higher on a wide bar that closed at its peak, moving another 50 plus ticks.

The Importance of Context

The success of these strategies hinges on understanding market context. Randomly picking volume and price action without context won’t yield good results. 

Identifying meaningful areas, like trend lines and channel structures, allows you to interpret volume and price action around those areas effectively.

Trading Breakouts
Trading Breakouts

In the first scenario, the ultra-high volume and subsequent failure highlighted a perfect shorting opportunity. In the second scenario, the reasonable volume increase and successful retest confirmed a strong buying opportunity. 

Both scenarios provided 100 plus tick moves in opposite directions, demonstrating the power of this approach.

Employing Volume and Price Action in Your Trading

To master these techniques, you need to integrate volume and price action into your trading foundation. 

Relying solely on magical indicators won’t get you far. Instead, you must become the indicator by interpreting volume and price action in real time. 

This method significantly improved my trading consistency and discipline, and it can do the same for you.

At Hawkeye Traders, we provide the tools and training to help you achieve this.

Our volume paint bars, wide bars, pivots, and radar dots, combined with the Hawkeye Mastery Library, offer a comprehensive methodology to enhance your trading strategy.

Understanding and applying these tools will allow you to identify and act on market opportunities effectively.

Mastering market breakouts through volume and price action is a game-changer.

By focusing on these techniques and incorporating them into your trading plan, you can significantly improve your trading outcomes. 

Thank you for joining me today. If you have any questions or need further assistance, feel free to reach out. And have a wonderful day!


Happy Trading,

What’s on deck for Ethereum?

Ethereum

What’s on deck for Ethereum? 

Anthony Speciale here with Hawkeye Traders. 

Today, I’m excited to take you through an in-depth analysis of Ethereum, focusing on the intricate relationship between volume and price action. 

By the end of this post, you’ll understand how to identify potential market turns and make more informed trading decisions.

Revisiting Ethereum’s Highs

Let’s dive right in… 

Recently, Ethereum revisited its previous highs, pushing up and spending significant time there. 

However, we noticed that the buying interest waned at the top, leading to a notable pullback. 

Despite some strong buying activity and a recovery attempt, the momentum wasn’t sustained. 

Using Hawkeye’s tools, we could see a wide bar push with notable buying volume, but the price failed to secure the channel structure.

Understanding Volume Climax

One of the critical elements we focus on at Hawkeye is identifying volume climaxes. 

For instance, we observed a specific candle with ultra-high volume radar dots. 

Despite the high volume, the presence of sellers created a significant upper wick, indicating resistance. 

After multiple attempts (11 to be precise), the price was unable to close above this crucial level, signaling potential downside.

Potential Downside Support Areas

Given the high volume and inability to sustain higher prices, we’re cautious about Ethereum’s potential to break higher. 

Instead, the lack of continued buying suggests we might see a pullback. 

We look at previous supply areas and note that Ethereum has retested and failed to push through these levels. 

This sideways movement, coupled with strong buying volume that failed to lead to a breakout, is concerning.

The Importance of Volume and Price Action

For every trade, whether it’s a day trade, swing trade, or position trade, the relationship between volume and price action is paramount. 

This approach isn’t limited to Ethereum or cryptocurrencies; it applies to stocks, futures, and forex as well. 

The Hawkeye methodology emphasizes that without confirming volume and price action, trading plans lack a critical edge.

Why You Should Focus on Volume and Price Action

Understanding volume and price action allows you to qualify your trades better and anticipate market moves more accurately. 

This focus has been game-changing for many traders, myself included. 

It provides a clearer picture of the market, helping you to make informed decisions and improve your trading outcomes.

How Hawkeye Tools Can Help

Hawkeye offers a suite of indicators designed to help you analyze volume and price action effectively. These include:

  • Wide Bars
  • Ultra High Volume Radar Dots
  • Paint Bars
  • Pivots

These tools are compatible with platforms like TradingView, TradeStation, NinjaTrader, and MetaTrader, and can be applied to various markets and timeframes.

Your Next Steps

If you want to enhance your trading strategy with volume and price action analysis, I invite you to:

  • Watch Our Training Webinar: Gain detailed insights into using Hawkeye tools.
  • Access the Hawkeye Mastery Library: Learn to spot key market signals.
  • Reach Out to Us: Contact our team for a personalized demonstration and answers to your questions.

By focusing on what truly matters – volume and price action – you can significantly improve your trading performance. 

Click here now to get started, and let’s take your trading to the next level.

Final Thoughts

Trading is about stacking the odds in your favor, and understanding the relationship between volume and price action is a crucial component. 

Apply these insights to your trading plan, and you’ll see the difference it makes.

Thank you for reading, and I hope this post has provided valuable insights. 

Happy Trading,

Volume Climax: The Key to Trading Success

Volume Climax

Are You Equipped To Call The Next AAPL High? Learn how with these Volume Climax Insights.

Anthony Speciale here from Hawkeye Traders.

Today, I’m excited to walk you through a fascinating case study on how to precisely identify significant price levels using the power of volume and price action.

Specifically, we’ll explore how I pinpointed one of Apple’s prior highs with near-perfect accuracy and how you can apply the same techniques to your own trading.

Understanding All-Time Highs and Market Resistance

As we approach all-time highs, it’s crucial to understand what these levels indicate and how they can influence market behavior. Let’s dive into one of Apple’s recent highs and break down the process using Hawkeye Indicators.

The Hawkeye Wide Bar: Spotting Market Resistance

During a recent attempt to push past an all-time high, Apple formed a wide bar on the chart. This wide bar, which closed higher than it opened, was accompanied by Hawkeye volume indicating a dominance of sellers. What does this tell us?

  • Significance of the Wide Bar: The wide bar signals an area of resistance. Sellers stepped in aggressively, preventing the price from moving higher.
  • Wick Resistance: The presence of a wick at the top of the wide bar suggests that sellers were strong enough to push back against the buyers, creating a potential resistance level.

Ultra High Volume Radar Dot: Identifying Volume Climax

One of the most powerful signals in volume analysis is the Ultra High Volume Radar Dot. Let’s focus on a specific candle that highlights this perfectly:

  • Tiny Candle, Huge Volume: On March 15, 2023, a very small candle formed, with a total movement of about 87 cents. Despite its size, the volume was extraordinarily high, one of the highest in the past 12 months.
  • Volume Climax: This occurrence is known as a volume climax, where there is a surge in volume but minimal price movement. This typically indicates a potential turning point as buyers or sellers exhaust their momentum.

Analyzing the Impact

Following the volume climax, we observed a massive sell-off.

This tiny candle at a significant resistance level was a clear indicator that buyers had lost interest, leading to a substantial drop in price.

  • Market Reaction: The market’s reaction to these signals can provide lucrative trading opportunities. Recognizing these patterns allows traders to anticipate market moves and position themselves accordingly.

Applying Hawkeye Indicators to Your Trading

The examples above demonstrate the critical role of volume and price action in identifying market turns. By incorporating Hawkeye Indicators into your trading strategy, you can enhance your ability to spot these pivotal moments.

  • Hawkeye Wide Bar: Use this tool to identify areas of potential resistance or support where significant market moves are likely to occur.
  • Ultra High Volume Radar Dot: This indicator helps you detect volume climaxes, signaling possible market reversals.

Why Volume and Price Action Matter

After over a decade of trading, I can confidently say that understanding the relationship between volume and price action is fundamental to trading success.

Unlike lagging indicators, volume and price action provide real-time insights into market sentiment and potential future movements.

  • Universal Application: Whether you trade stocks, futures, forex, or cryptocurrencies, and whether you’re a day trader, swing trader, or position trader, volume and price action analysis is universally applicable and incredibly valuable.

Get Started with Hawkeye Traders

Are you ready to elevate your trading by mastering volume and price action?

I encourage you to explore the Hawkeye Indicators and access our Mastery Library.

These tools are designed to help you identify major trade setups and make informed trading decisions.

Take the Next Step

  • Watch the Training Webinar: Click the link below to access our comprehensive training webinar, where we dive deeper into these concepts.
  • Contact Our Team: Reach out to us for a personalized demonstration or any questions you may have.

Watch the Training Webinar

Understanding how to read the market through volume and price action is a game-changer. Don’t miss out on the opportunity to enhance your trading skills with Hawkeye Indicators.

Happy Trading,

Anthony Speciale

Hawkeye Traders

Big Energy Profits

Real-Time Trading Using Wide Bar and Volume Radar

real-time trading

Identified LIVE: Real-Time Trading with Hawkeye WideBar Triggers Sell-Off, Ultra-High Volume Radar Triggers Rally

Anthony Speciale here from Hawkeye Traders.

I’m thrilled to share insights from a recent real-time trading session where we leveraged the Hawkeye Wide Bar and Ultra High Volume Radar Dot to make informed trading decisions.

This post is tailored specifically for retail traders eager to enhance their market strategies using volume and price action analysis.

The Power of Volume and Price Action

Volume and price action are foundational to successful trading.

They provide real-time trading insights into market dynamics, helping traders make informed decisions. In this session, we focused on WTI Light Sweet Crude Oil, using a three-minute chart to pinpoint entry and exit points.

Key Indicators and Their Interpretation

  • Hawkeye Wide Bar: This magenta-colored bar signifies significant market movement. When it appears, it indicates a potential shift in market direction.
  • Ultra High Volume Radar Dot: This marker signals intense buying or selling pressure. Understanding its implications can help predict market reversals.

Real-Time Analysis and Trades

During our real-time trading session, we identified a resistance level around 76.12.

Despite strong buying volume, the market struggled to break through this level. This was our first clue that a reversal might be imminent.

At 8:06 AM EST, the Hawkeye Wide Bar confirmed our suspicion.

I initiated a short trade at the close of this candle, with a stop loss slightly above the high. My targets were set based on prior price action, aiming for 75.90, 75.80, 75.70, 75.60, and ultimately 75.45.

The market hit our final target of 75.45, yielding a high reward-to-risk ratio of 12.8:1.

This trade exemplifies the precision and effectiveness of using volume and price action for real-time trading analysis.

The Reversal Signal

At 9:00 AM EST, a significant Ultra High Volume Radar Dot appeared, marking the highest volume of the session.

This high selling volume, coupled with the inability to push prices lower, indicated a selling climax.

Recognizing this, we anticipated a reversal, setting up a long trade that also yielded substantial gains.

Why Volume and Price Action Matter

Volume and price action are the only leading indicators in the market.

They reveal the balance between buyers and sellers, offering a clear picture of market sentiment.

By understanding this relationship, traders can validate or invalidate their theories, making more confident and precise trades.

Consistency Across Markets

The principles of volume and price action are universal, applicable across various markets, including stocks, futures, forex, and cryptocurrencies.

While my focus is often on the futures market, these techniques are beneficial for all trading styles and asset classes.

Join Us and Enhance Your Trading Skills

If your current trading strategy does not prioritize volume and price action, it might be time for a change.

Understanding these elements can significantly improve your trading outcomes.

I encourage you to explore the Hawkeye Mastery Library, where you can learn to apply these principles effectively.

As a dedicated user and advocate of Hawkeye Traders, I’ve seen firsthand how these tools can transform trading success.

We offer comprehensive resources and support to help you master volume and price!

Trading is not just about following signals; it’s about understanding market dynamics.

By integrating volume and price action into your strategy, you can make more informed decisions and achieve consistent success.

For more detailed insights and personalized guidance, connect with our team.

We’re here to help you every step of the way!

Happy Trading,

Anthony Speciale

Hawkeye Traders

Big Energy Profits

Intraday NASDAQ Trading: Enhancing Market Analysis

Intraday NASDAQ Trading

Intraday NASDAQ Trading: “Red Top” Precedes Failed Ultra-High Buying Volume Candle

Welcome to another insightful, market analysis training session.

Today, we’re diving into the intricate world of intraday NASDAQ trading, focusing on a vital yet often overlooked aspect: knowing how to “look left”.

In this session, I’ll illuminate the power of understanding volume and price action, and how mastering this relationship can significantly enhance your trading performance.

The Core of Successful Trading

At Hawkeye Traders, we emphasize the foundational importance of volume and price action. Regardless of what additional indicators or tools you use, if you don’t grasp these two key elements, you’re navigating the market with a blurred vision.

Intraday NASDAQ trading relies on volume and price action as the universal constants across all market conditions and time frames. They provide a clear, unadulterated view of the market’s intentions, enabling you to anticipate potential movements accurately.

Intraday NASDAQ Trading

Volume and Price Action

Our methodology is not just about providing you with indicators; it’s about teaching you to understand the relationship between volume and price action.

This knowledge is crucial for developing a robust trade plan and an effective risk management strategy. By focusing on these core elements, you can strip away the noise and distractions that often clutter trading charts.

In today’s session, we analyzed the NASDAQ 100 Futures using a three-minute chart. This means each candle represents three minutes of market activity.

Our unique indicators, such as the paint bar and wide bar, play a critical role in interpreting market conditions.

The paint bar reflects the volume traded within each candle, while the wide bars signal significant volatility compared to prior bars, alerting traders to potential market shifts.

LIVE Intraday NASDAQ Analysis

Let’s delve into a practical example from our LIVE trading session.

At the opening bell of the US market (9:30 a.m. EST), we observed the highest volume traded so far during the Globex session. This moment was marked by a red volume radar dot and a wide bar, indicating significant market activity and potential volatility.

To make sense of this, we looked left—examining past price actions to gain insights into future movements. This approach is akin to reading a roadmap: the more you understand past movements, the better you can predict future directions.

We identified key resistance levels by marking prior session highs and analyzing the market’s response at these points.

For instance, at 8:15 a.m. EST, we noted a “red top”—a newly appointed high on high selling volume. This indicator often signals a strong turning point.

By marking this candle and observing subsequent market behavior, we could anticipate potential resistance levels.

The Importance of High and Low Points

As the market progressed, we observed that despite strong buying volume at the opening bell, the market failed to surpass the prior high.

This inability to break through a resistance level, despite high buying volume, indicated that the buyers’ momentum was weakening.

Consequently, this led to a lower high formation—a strong signal that the market might reverse direction.

Our analysis showed that this red top, combined with the lower high and significant selling volume, created a strong resistance area.

This informed our trading strategy, allowing us to anticipate a market downturn and prepare accordingly.

The Power of Disciplined Trading

This session underscored the importance of disciplined trading and the ability to recognize when not to trade.

By focusing on the relationship between volume and price action, you can develop a clear, confident approach to intraday NASDAQ trading.

This foundation will help you avoid unnecessary trades and preserve your capital for more opportune moments.

Trading is not just about seizing every opportunity; it’s about making informed, strategic decisions based on a solid understanding of market dynamics.

By mastering the art of knowing when not to trade, you can enhance your overall trading performance and achieve sustainable success in the market.

Remember, trading is a journey of continuous learning and improvement.

Stay focused, stay disciplined, and always prioritize understanding the fundamental relationships in the market.

Thank you for joining us today. We hope this analysis has provided you with valuable insights to refine your trading strategy. See you in the next training video!

Join the Hawkeye Family of Traders and take your trading to new heights!

Real-Time Analysis Strategies: Understanding Market Movements

Real-Time Analysis Strategies: Understanding Market Movements

Calling The Morning Session High Using Volume in Real-Time Analysis

Welcome, traders! Today, we’re diving into a crucial aspect of trading that often separates the successful from the struggling: understanding volume and price action.

I’m Anthony Speciale, and I’m thrilled to share this insightful presentation with you.

Let’s cut to the chase: volume precedes price action.

But does it guarantee success every time? No.

However, grasping the relationship between volume and price action can give you a significant edge in the market—something beyond your wildest dreams.

Before we delve into the specifics, it’s essential to establish credibility.

Real-Time Analysis Strategies: Understanding Market Movements
Real-Time Analysis

Everything I’m about to discuss was identified live, in real-time, with traders actively trading live money.

Why does this matter? Because it’s easy to analyze historical charts and claim insights. But live, real-time analysis requires a deep understanding of volume-price dynamics.

Let’s zoom in on a specific example: the 8:54 a.m. Eastern Standard Time candle on Light Sweet Crude Oil, depicted on a 3-minute chart.

Notice the small body with a significant wick—a classic reversal candle. At that moment, buying volume surged, indicating bullish momentum.

However, despite the spike in volume, the price failed to sustain upward movement.

This scenario illustrates a crucial point: volume provides insight into potential market direction. In this case, high buying volume preceded a sharp price decline.

Similarly, during an inventory report, ultra-high buying volume collided with a known resistance level, resulting in a swift market reversal.

Understanding volume and price action enables traders to anticipate market movements.

For instance, a high buying volume without follow-through suggests impending downward pressure, while ultra-high selling volume near a support level hints at potential price rebounds.

But how do we interpret volume and price action effectively?

It boils down to three key elements: volume, price action, and market context.

These pieces form the foundation of any successful trade plan.

Without a clear understanding of these components, adding more indicators or cluttering your charts won’t enhance your trading performance.

To illustrate, let’s consider my approach. I use two charts: a reference chart with indicators and a clean chart focusing solely on price action and volume. This dual perspective allows me to capture market nuances and make informed decisions.

Now, let’s address a common misconception: cluttered charts.

Many traders overload their screens with unnecessary indicators, obscuring the fundamental drivers of market movements.

In reality, volume and price action are the primary drivers of market behavior, applicable across all asset classes and time frames.

To help traders master these essential concepts, we offer our clients access to the Hawkeye Price Action and Volume Mastery Library.

These comprehensive resources provide in-depth insights into volume-price dynamics, equipping traders with the tools to navigate any market condition effectively.

Ultimately, success in trading hinges on your ability to interpret volume and price action.

No fancy indicator or software can compensate for a lack of understanding in these areas.

By investing in your education and mastering these core principles, you’ll unlock the key to consistent, disciplined, and profitable trading.

If you’re serious about elevating your trading game, I encourage you to explore our educational resources and reach out to our team for personalized guidance.

Together, let’s embark on a journey towards trading mastery.

Thank you for joining me in this exploration of volume and price action.

If you found value in this content, please like, comment, and subscribe to our channel for more insights.

Remember, click here to access our educational resources below—take the first step towards trading success today.

Wishing you abundance and prosperity in your trading journey!

Click here to watch the video and transform your trading journey today!

Ready To Transform Your Trading?  Contact Us Today!

Email: [email protected] – OR – Call: 888-233-8598


Happy Trading,

Anthony Speciale

Hawkeye Traders

Big Energy Profits

High Probability Reversal Strategies

Tiny Candle + Massive Volume = High Probability Reversal

Welcome, traders! Anthony here with Hawkeye Traders. I hope you’re having a fantastic day.

Welcome to the video. Today, I’m excited to dive into a topic that often gets overlooked but holds immense potential for traders—volume and price action analysis.

Specifically, I’ll be sharing insights on how these tools can help you spot massive opportunities in the market.

Let’s jump right in . . .

Have you ever experienced that feeling of missing out on a golden opportunity?

You’re not alone. But what if I told you there’s a way to identify low-risk setups that others might overlook? That’s where volume and price action analysis come into play.

Imagine this: it’s Wednesday, March 8th, 2023, and you’re analyzing the Euro FX Futures Market. You notice an extraordinarily tiny candle with ultra-high selling volume.

Now, this might seem insignificant at first glance, but it could be the key to unlocking a major reversal in the market.

High Probability Reversal

Here’s the thing: when it comes to analyzing currency volume, I strongly recommend turning to the Futures Market.

Why? Because it offers a more accurate depiction of who’s in control of the market.

With legit volume readings from the CME, you can trust the data you’re working with.

Now, back to that tiny candle.

Tiny Candle + Massive Volume = High Probability Reversal
High Probability Reversal

Despite its size, the volume behind it speaks volumes (pun intended). It indicates a lack of follow-through from sellers, suggesting that a high probability reversal may be on the horizon.

This phenomenon isn’t exclusive to Futures—it applies to stocks, Forex, cryptocurrencies, and more.

But how can you leverage this insight to your advantage?

That’s where Hawkeye Traders comes in. Our tools are designed to help you identify key market dynamics, from volume surges to price action patterns.

With indicators like the Hawkeye paint bar and volume radar, you can gain a deeper understanding of market sentiment and potential reversals.

By focusing on volume and price action, you’re tapping into the most reliable data available.

Whether you’re a day trader, swing trader, or position trader, these principles hold true across all time frames.

It’s about understanding the relationship between volume and price movement and using that knowledge to your advantage.

Ready to take your trading to the next level? Reach out to us today and gain access to the Hawkeye Mastery Library.

With our tools and resources at your fingertips, you’ll be equipped to tackle the markets with confidence and precision.

Don’t underestimate the power of volume and price action analysis.

It’s the foundation of successful trading, and with the right tools, you can uncover hidden opportunities that others might miss.

Here’s to your success in the world of trading!

Happy Trading,

Anthony Speciale

Hawkeye Traders

Big Energy Profits

Double Top Strategy: Achieving Success in Trading

Double Top Strategy: Achieving Success in Trading

Welcome, traders! Anthony here with Hawkeye Traders. I hope you’re having a fantastic day and are ready to dive into a real, live trade that I identified and executed, focusing on the double top pattern.

This wasn’t just any trade—I called it live in front of other traders who were trading with real money.

While I can’t say whether they took the trade or not, my analysis was based on volume and price action, which led to what I believe was a great trading opportunity.

The Importance of Volume and Price Action

At Hawkeye, we emphasize the significance of volume and price action in trading.

Let’s break down the trade that highlights how crucial these elements are. The key moment occurred at 3:54 a.m. Eastern Standard Time. A Hawkeye Wide Bar formed, showing the highest buying volume since the overnight open.

However, what happened next is crucial: we saw rejection immediately after this high buying volume, indicating a potential exhaustion or volume climax.

Identifying the Set-Up

I drew a box around this significant bar and monitored price action every time it retraced into this area. We noticed a push below, a high that couldn’t be overcome at 77.15, and a double top pattern—a clear sign of buyer exhaustion.

This double top, coupled with a downward trend line from the overnight highs, suggested a strong shorting opportunity.

Trading the Double Top

A double top is formed when the price fails to surpass a particular high on two occasions, creating a resistance level. In our scenario, the double top at 77.15 indicated a high probability of a downtrend.

The neckline, or the low between the double tops, becomes the initial target.

As the price pushed below this neckline, it targeted prior lows and continued lower, hitting all projected targets and even exceeding them.

Double Top Strategy: Achieving Success in Trading
Double Top

Achieving Targets

From the double top, the market pushed down to $74.

Initially, I identified targets below the session’s prior lows at 76.30, 76.10, 75.80, 75.60, 75.30, 74.70, and 74.50.

The market eventually hit $74, well beyond the initial target, demonstrating the power of understanding volume and price action.

The Power of Live Analysis

Analyzing and predicting market movements live in front of an audience adds an extra layer of accountability.

It’s not about hindsight but about real-time interpretation of market signals.

This particular trade underscored the importance of recognizing high buying volumes without follow-through as a sign of buyer exhaustion.

Simplicity in Trading

One of the core philosophies we advocate at Hawkeye is the simplicity of focusing on volume and price action. Before adding various indicators to your charts, consider how much clarity you can gain from understanding these two fundamental aspects.

Often, less is more. A clean chart with multiple time frames focused on volume and price action can provide all the information you need for successful trading.

I invite you to watch the training webinar and reach out to the Hawkeye team.

Many traders rely on strategies that don’t prioritize volume and price action, and this often leads to inconsistent results. Our volume-driven tools and mastery library can transform your approach, making your trading clearer and more effective.

Trading with a focus on volume and price action, complemented by Hawkeye indicators, simplifies the process and enhances clarity.

It’s about mastering your emotional state, trading psychology, and analytical skills. This focus can be the pivotal change in your trading career.

Thank you for taking the time to read this post. I look forward to seeing you in our next video.

Don’t hesitate to reach out with any questions—we’re here to help you on your trading journey. Volume and price action are the keys to success, and with Hawkeye, you can unlock your full trading potential. Your journey to volume and price action mastery awaits you!

Happy Trading,

Anthony Speciale

Speciale Analysis 

$30K BTC Rally Zones Entry

BTC

FREE Hawkeye Zones – This Week Only ! ! ! $30K BTC Rally Zones Entry

[WATCH NOW]

How Understanding Volume, Price Action, and Multi-Timeframe Confluence Can Transform Your Trading

Anthony Speciale here from Hawkeye Traders, welcome to another insightful session!

Today, I’m diving deep into a swing trade setup for Bitcoin, exploring how you can leverage multiple confluences of support to enhance your trading accuracy and profitability.

Whether you’re a seasoned trader or just starting, this post will guide you through essential techniques that can make a monumental difference in your trading career.

The Power of Multi-Timeframe Analysis

In the video, I’m meticulously breaking down the Bitcoin futures market using a multi-timeframe analysis.

By examining daily, weekly, and monthly charts simultaneously, you can identify stronger and more reliable support and resistance levels.

For example, on January 23, 2024, Bitcoin was visiting support on both the daily and weekly timeframes, while also creating new support levels on the monthly chart.

This comprehensive view allows traders to pinpoint optimal entry and exit points, minimizing risk and maximizing potential returns.

The video showcases how, by recognizing these critical support areas, you could have captured a massive move from $41,455 to $75,000—a $30,000 swing!

Key Trading Insights:

  • Identifying Weak Highs and Strong Lows: By understanding volume and price action, you can determine whether a price level is likely to hold or break. For instance, when Bitcoin formed a weak high due to decreasing buying volume, it signaled a potential reversal.
  • Confluence Across Timeframes: Combining support and resistance levels from daily, weekly, and monthly charts significantly increases the probability of a successful trade. Multiple confirmations provide the confidence needed to take low-risk, high-reward trades.
  • Volume as a Leading Indicator: Volume provides insight into market intent, allowing traders to anticipate potential price movements. High volume at key support or resistance levels can indicate strong buying or selling interest, guiding your trading decisions.

The Hawkeye Advantage

The importance of understanding the relationship between volume, price action, and multi-timeframe confluence is invaluable.

I attributes my success to Hawkeye’s volume-driven software and the comprehensive training available through the Hawkeye Mastery Library. These tools enable traders to decode market signals accurately and make informed decisions.

As a special offer, Hawkeye is providing their Zones software for FREE with the purchase of the volume-based software this week only—a VALUE of $800!

The Zones software helps you identify critical support and resistance levels, enhancing your ability to trade with confidence.

Why You Shouldn’t Miss This Opportunity

Regardless of your trading style or the markets you trade—be it stocks, futures, forex, or cryptocurrencies—understanding these foundational concepts is crucial.

The ability to interpret volume and price action across multiple timeframes can drastically improve your trading performance.

My journey from a customer to an advocate for Hawkeye underscores the value of these tools. I’ve spent over 13 years refining my skills and teaching others, consistently proving the efficacy of volume and price action analysis.

Take Action Now

Don’t miss this limited-time offer to elevate your trading with the Hawkeye software bundle. Gain access to the volume and price action Mastery Library and receive the Zones software for FREE. This $800 GIFT is available this week only!

What to Do Next:

  • Watch the Video: Gain insights directly from my detailed analysis.
  • Explore the Content: Links and resources provided below the video will give you further understanding.
  • Contact Hawkeye: Call the Hawkeye support team with any questions. If needed, Anthony himself will take your call to ensure you get the most out of this opportunity.

Email: [email protected] – OR – Call: 888-233-8598

Invest in your trading future today and discover how volume, price action, and multi-timeframe confluence can transform your approach.

Ready to Transform Your Trading? Watch the Video Now!

By integrating these strategies and tools into your trading routine, you’ll be better equipped to navigate the markets and achieve consistent success.

Happy Trading,

Anthony Speciale

Hawkeye Traders

Big Energy Profits

P.S. Remember, this offer is available for this week only. Act NOW to claim your FREE Hawkeye Zones and take the first step towards a more profitable trading career!

Email: [email protected] – OR – Call: 888-233-8598

VLO – Swing Trading Equities With Multiple Timeframe Confluence

VLO

Mastering Swing Trades with Hawkeye Zones: A Deep Dive into Valero Energy Corporation (VLO)

FREE Hawkeye Zones – This Week Only ! ! !

VLO Lower High Short Entry [WATCH NOW]

Anthony Speciale here from Hawkeye Traders, hoping you’re having a fantastic day!

Today, we’re diving into a powerful swing trade setup using price action analysis, volume analysis, and supply and demand dynamics.

This approach can significantly enhance your trading accuracy, and I’m excited to show you how . . .

The Setup: Valero Energy Corporation (Ticker: VLO)

In this analysis, we’re focusing on Valero Energy Corporation (VLO).

We’ll be looking at three different time frames: the daily chart, the weekly chart, and the monthly chart.

This multi-timeframe approach allows us to spot high-probability trade setups with greater precision.

The Weak High Indicator

Back in early April, Valero hit an all-time high. However, this high was made on decreasing buying volume, signaling a potential weak high.

As traders, we don’t want to guess tops or bottoms unless there’s clear evidence. In this case, the weak high was an early indicator that prices might not go higher.

Identifying Lower Highs and Lower Lows

As the market began to push lower, we looked for a lower high where we could confidently enter a short position. The market consolidated, created supply areas, and consistently made lower highs and lower lows.

This pattern strengthened our thesis that the price might continue to decline.

The Key Candle on May 17

A critical point came with the candle printed on May 17th, which showed very strong increasing buying volume. However, if the next candle didn’t follow through, it indicated that buyers might have climaxed, providing a low-risk shorting opportunity.

Entering at $166 with a stop at $169, we risked a small amount to potentially gain a lot if the market confirmed our analysis.

Multi-Timeframe Confluence

What made this setup particularly compelling was the confluence across multiple timeframes.

Not only did the daily chart show resistance, but the weekly chart also aligned with a supply area.

Additionally, the monthly chart displayed a red top, indicating a potential for a strong reversal.

Protecting Your Profits

As we pushed lower and reached new lows, it was crucial to take profits and protect our position.

Moving stops to break even as we approached prior lows ensured that we maximized our gains while minimizing risk.

Remember, two emotions drive traders: greed and fear. Always pay yourself and protect your capital.

The Hawkeye Advantage

Understanding the relationship between volume, price action, and multiple timeframes is crucial.

At Hawkeye, we offer tools that can help you gain this understanding and transform your trading career.

Special Offer: Get the Hawkeye Zones for Free!

For this week only, we have an incredible offer.

Purchase the Hawkeye software and get access to the Hawkeye Mastery Library, plus a FREE gift: the Hawkeye Zones.

We sell the Hawkeye Zones daily for $800, but this week, they’re yours at no additional cost.

Why You Shouldn’t Miss This

This $800 gift is a rare opportunity to enhance your trading toolkit.

Whether you trade stocks, futures, Forex, or cryptocurrencies, this investment will help you understand the market dynamics better and trade with more confidence.

Email: [email protected] – OR – Call: 888-233-8598

Don’t miss out on this exclusive offer. Our Hawkeye team is ready to answer any questions you might have. Thank you for your time and happy trading!

Happy Trading,

Anthony Speciale

Hawkeye Traders

Big Energy Profits

P.S. Remember, this offer is available for this week only. Act NOW to claim your FREE Hawkeye Zones and take the first step towards a more profitable trading career!

Email: [email protected] – OR – Call: 888-233-8598

Trading AUD/USD Short-Term Using Multiple Timeframe Confluence

AUD/USD

AUD/USD Scalping Setup

FREE Hawkeye Zones – This Week Only ! ! ! [WATCH NOW]

Mastering Short-Term Forex Trading with Hawkeye Zones

Hello, traders! Anthony Speciale here with Hawkeye Traders.

In today’s video, we dive into the exciting world of short-term Forex trading, specifically for those of you who are intraday traders.

We’re focusing on how you can achieve great precision in your trades by leveraging Hawkeye Zones and multiple time frame confluence.

Why Short-Term Forex Trading?

Short-term Forex trading, or scalping, offers the potential for quick profits by capitalizing on small price movements within a short period.

For those of you who enjoy the fast pace of intraday trading, this strategy is particularly beneficial. Scalping requires precise entry and exit points, and that’s where Hawkeye Zones come into play.

Analyzing the Australian Dollar/US Dollar Pair

In this video, we analyze the Australian Dollar/US Dollar (AUD/USD) currency pair using three time frames:

  • 3-minute chart (main window on the left)
  • 6-minute chart (top right)
  • 12-minute chart (bottom right)

By doubling the time frame with each chart, we gain a comprehensive view of the market, which is crucial for identifying short-term trading opportunities.

The Power of Multiple Time Frame Confluence

The key to successful short-term trading lies in aligning multiple time frames.

When all time frames show support or resistance at the same level, the probability of a successful trade increases significantly.

Let’s look at a specific example:

  • 3-Minute Chart: The price pulls back into a support zone, offering a low-risk entry point.
  • 6-Minute Chart: The same support zone is tested, confirming the potential for a bounce.
  • 12-Minute Chart: Again, the support zone is validated, reinforcing our trade setup.

This confluence across multiple time frames gives us confidence in the trade.

We see a strong bounce off the support levels, leading to a profitable move from 0.66421 to 0.66538.

The Hawkeye Advantage

Using Hawkeye Zones, we can:

  • Identify key support and resistance levels.
  • Align multiple time frames to find high-probability trade setups.
  • Reduce risk by placing stops just below the support zones.

This approach is not only effective for short-term traders but also for swing and position traders.

Whether you’re trading stocks, futures, Forex, or cryptocurrencies, understanding volume and price action through Hawkeye’s tools can dramatically improve your trading performance.

An Exclusive Offer Just for You

To help you master these techniques, we have an exclusive offer – this week only.

When you invest in the Hawkeye software this week, we’ll give you the Hawkeye Zones for FREE—an $800 VALUE!

This combination of tools will transform your trading by providing deeper insights into volume and price action across multiple time frames.

Why Choose Hawkeye?

  • Proven Success: As a paying customer and experienced trader, I can attest to the life-changing impact of Hawkeye’s tools on my trading career.
  • Comprehensive Support: Our team is ready to assist you. Contact the Hawkeye Coner team for any questions or to get started.
  • Unmatched Value: This week only, receive the Hawkeye Zones for free with your investment in our software.

Don’t miss this opportunity to elevate your trading. Click the link below to watch the video, learn more, and take advantage of this limited-time offer.

Watch the Video Now

Claim Your FREE Hawkeye Zones Today – We’re Standing By . . . 

Email: [email protected] – OR – Call: 888-233-8598

Happy Trading,

Anthony Speciale

Hawkeye Traders

Big Energy Profits

FREE Hawkeye Zones – S&P 500 400+ Tick

S&P 500

S&P 500 Multiple Timeframe Confluence Drives 400+ Tick Inside 2 Hours [WATCH NOW]

Welcome to another insightful session, with Anthony Speciale from Hawkeye Traders.

Today, I’m diving into a powerful strategy that utilizes supply and demand zones, or support and resistance levels, to enhance your trading precision and profitability.

Understanding the S&P 500 Futures Market

In this video, I analyze the S&P 500 futures market (ES), one of the most heavily traded and liquid markets. This analysis isn’t based on hindsight; I witnessed these movements in real-time and want to share this live market reversal strategy with you.

Join Hawkeye Team today and get the Hawkeye Zones for free!

Multi-Time Frame Confluence: The Key to Strategic Trading

When trading using supply and demand zones, the critical factor is the confluence between multiple time frames. We’ll be looking at a 60-minute chart, a 240-minute chart, and a daily chart to identify high-probability trade setups.

Here’s why multi-time frame analysis is crucial:

  • Big Picture Insight: The 240-minute and daily charts give us a broader market perspective, identifying significant support and resistance levels.
  • Precision Execution: The 60-minute chart allows us to execute trades with pinpoint accuracy, aligning our entries with the larger trends identified on the higher time frames.

Real-Time Example: Spotting a $100 Move

In our example, we identify support at 5210 on the 240-minute chart and at 5267.75 on the daily chart.

These levels indicate strong potential for a market reversal.

By combining these insights, we can confidently enter trades with minimal risk and maximum reward.

For instance, spotting the confluence of support levels and observing price action at these points can yield substantial moves.

In this case, recognizing the support at 5210 led to a significant move up to nearly 5310, a remarkable $100 gain in the S&P 500 futures within a short period.

The Power of Hawkeye Zones

To help you implement this strategy effectively, we’re offering an incredible deal. When you invest in Hawkeye software this week, you’ll receive the Hawkeye Zones for FREE.

These zones are essential for:

  • Identifying Key Levels: Hawkeye Zones highlight crucial support and resistance areas across multiple time frames, enhancing your market analysis.
  • Boosting Confidence: With these zones, you can enter trades with greater confidence, knowing that you have solid backing from higher time frame analysis.

Why Volume and Price Action Matter

Volume and price action are the foundational elements of successful trading.

Understanding these components allows you to build a consistent, disciplined trade plan. The Hawkeye software focuses on these principles, providing you with the tools needed to analyze the market effectively and make informed trading decisions.

Limited-Time Offer: Act Now!

This week only, when you invest in Hawkeye software, you’ll receive the Hawkeye Zones, valued at $800, absolutely FREE. This offer is designed to help you build a robust trading strategy that combines volume and price action with multi-time frame analysis.

Reach out to our Hawkeye Concierge Team to claim your FREE Hawkeye Zones:

Email: [email protected] – OR – Call: 888-233-8598

How to Get Started

  • Watch the Video: Gain insights and practical tips from the detailed analysis of the S&P 500 futures market.
  • Claim Your Free Zones: Click the link below the video or contact our Hawkeye concierge team to take advantage of this exclusive offer.
  • Transform Your Trading: Use the tools and knowledge from Hawkeye to enhance your trading strategy and achieve your financial goals.

Don’t miss this opportunity to revolutionize your trading approach. Click the link, watch the video, and elevate your trading game with Hawkeye Traders.

Happy Trading,

Anthony Speciale

Hawkeye Traders

Big Energy Profits

P.S. Remember, this offer is available for this week only. Act NOW to claim your FREE Hawkeye Zones and take the first step towards a more profitable trading career!

Multi-Timeframe Analysis on AAPL + FREE Hawkeye Zones

Multi-Timeframe Analysis on AAPL + FREE Hawkeye Zones

Unlocking the Power of Multi-Timeframe Analysis on AAPL + FREE Hawkeye Zones – This Week Only ! ! !

Anthony Speciale here with Hawkeye Traders. I’m thrilled to share an exciting strategy with you today, specifically designed to enhance your trading efficiency and success.

Plus, I have an incredible offer at the end of this post that you won’t want to miss.

Why Apple?

In this video, we’ll analyze Apple Inc. (AAPL), a stock that’s well-known for its volatility and liquidity, making it a favorite among day traders, swing traders, and position traders alike.

We’ll focus on a swing trading setup, although the principles discussed can be applied to shorter-term position trades as well. By leveraging supply and demand and multi-timeframe confluence, you can significantly enhance your trading strategy.

The Power of Multi-Timeframe Confluence

Multi-timeframe confluence is one of the most powerful techniques for developing a repeatable and reliable trading plan.

By aligning the bigger picture with smaller timeframes, you can execute trades with precision and minimize your risk.

In this analysis, we’ll use:

  • Daily Chart (left side)
  • Weekly Chart (top right)
  • Monthly Chart (bottom right)

Although these timeframes may seem extensive, they provide a comprehensive view of the market, crucial for swing trading and position trading.

Identifying Key Levels

Let’s examine a specific example from 2023, focusing on a significant low followed by a strong rally.

This setup illustrates how higher timeframe confluence can guide your trades.

  • Draw Key Levels: Begin by marking significant support levels on the weekly and monthly charts. For instance, a key support level at $126.41 on the weekly chart aligns with a larger support zone around $137.98 on the monthly chart.
  • Look for Confirmation: Once these support levels are identified, shift your focus to the daily chart. You’re looking for buying volume to confirm the support. In our example, a robust buying surge at around $130 signals a strong entry point.
  • Plan Your Trade: Enter the trade at the confirmed support level. In this case, buying Apple at $130.

Executing the Trade

With the entry point identified, it’s essential to manage your trade effectively:

  • Monitor Weekly Chart: Use the weekly chart to track the trade and identify potential profit-taking points.
  • Profit Targets: Set profit targets at previous highs, such as $156.20, $164.20, and $175.20.
  • Risk Management: Keep your stop-loss just below the support zone. If the price breaks below this zone, exit the trade to protect your capital.

Practical Insights

This strategy’s beauty lies in its predictability and precision.

By using higher timeframes to confirm support and resistance levels, you can enter trades with confidence and maximize your potential for profit.

For instance, in our example, buying Apple at $130 and riding the trend up to $200 provides a substantial return, all thanks to multi-timeframe analysis.

Special Offer: Hawkeye Zones FREE With Indicator Purchase

As promised, I have an exclusive offer for you. This week only, when you invest in the Hawkeye Indicator Package, we’ll include the Hawkeye Zones for FREE.

These zones, visible on both the weekly and monthly charts, are invaluable for identifying higher timeframe confluence.

Why Hawkeye Zones?

  • Enhanced Analysis: See the big picture clearly and make informed trading decisions.
  • Versatility: Applicable to stocks, futures, forex, and cryptocurrencies.
  • Trading Styles: Suitable for day trading, swing trading, and position trading.

This $800 VALUE is yours for FREE, but only for this week. Don’t miss out on this opportunity to elevate your trading.

How to Claim Your Offer

To take advantage of this offer, follow these steps:

  • Check the Content Below: Review the video and other resources provided.
  • Contact Our Team: Use the provided links and phone number to reach out to our Hawkeye Concierge Team. [email protected] – OR – 888-233-8598
  • Commit to Excellence: Tell our team you’re ready to own the Hawkeye software and receive the Hawkeye Zones for free.

By mastering multi-timeframe analysis, you can transform your trading strategy and achieve consistent success. The Hawkeye Zones offer an incredible advantage, providing clarity and confidence in your trades.

Thank you for joining me today. Don’t hesitate—take advantage of this limited-time offer and empower your trading with Hawkeye’s powerful tools.

If you have any questions, reach out to our Hawkeye Concierge Team.

The Power of Multi-Timeframe Analysis for Intraday Gains

HK Zones: Master Multi-Timeframe Analysis

Unlock the Power of Multi-Timeframe Analysis:

Anthony Speciale here with Hawkeye Traders. 

I’m thrilled to bring you today’s video because what I’m about to share will absolutely transform your trading approach. 

With over 13 years of experience in trading and mastering both technical analysis and trading psychology, I understand the challenges traders face. 

Today, I’ll show you how to look at multiple timeframes simultaneously, helping you place trades with confidence.

Understanding Market Dynamics

Knowing what’s happening in the market can significantly reduce emotional and psychological challenges. 

Imagine being able to see if prices are in an area of supply or demand, support or resistance, all at the same time. 

This knowledge can empower you to make confident trading decisions.

Multi-Timeframe Analysis

Let’s dive into my preferred market—the Light Sweet Crude Oil Futures. 

This analysis applies to stocks, futures, forex, and cryptocurrencies, but I’ll focus on crude oil for this demonstration.

On my screen, you’ll see three charts:

  • 5-Minute Chart (left)
  • 60-Minute Chart (top right)
  • 4-Hour Chart (bottom right)

These timeframes are crucial for both day trading and swing trading. 

For swing trading, I focus on the 4-hr chart; for day trading, I zero in on the 5-min chart. 

By combining these timeframes, I can better align my trades with market momentum.

Identifying Key Levels

Using my cursor, I identify areas of supply or resistance. 

For example, if I spot a high point on the 60-minute chart, I check if the 4-hour chart also shows resistance. This confluence of timeframes strengthens the likelihood of the market behaving as anticipated.

Trading Strategy

When higher timeframes align, the market is more likely to move in your favor. Here’s a breakdown:

  • Identify Supply/Resistance Zones: Look for these zones on both the 60-minute and 4-hour charts.
  • Check Short-Term Trends: On the 5-minute chart, ensure a downtrend is developing in these zones.
  • Execute Trades: If all charts confirm a bearish trend, it’s a strong signal to go short.

Practical Example

Let’s consider a scenario:

  • Supply/Resistance Zone: The 60-minute and 4-hour charts both show a resistance zone.
  • Short-Term Downtrend: The 5-minute chart confirms a downtrend starting at around 80.40.
  • Trade Execution: Enter a short position targeting a move down to around 79.40.

Confluence—where multiple timeframes agree—is key to successful trading. When higher timeframes show momentum in the same direction as your shorter timeframe, it increases the chances of a successful trade.

Avoiding Choppiness

Focus on trading when the market is moving, not during consolidation. On the 5-minute chart, avoid trades when the market is choppy and wait for clear directional movement.

Using Trends and Stops

Add trend indicators to your charts. For example, trend dots on the 60-minute chart can indicate uptrends and downtrends. When price bars lead the trend dots, it signifies momentum; when they enter the trend dots, it indicates consolidation.

Tailoring to Your Style

Whether you’re a day trader, swing trader, or position trader, understanding the bigger picture is vital. Over the next few videos, I’ll cover different trading styles to help you see how these principles apply across various approaches.

Special Offer

To celebrate this unique insight, we’re offering the Hawkeye Zones for FREE when you purchase the Hawkeye Indicator Package this week. 

This $800 VALUE will be invaluable in understanding multi-timeframe confluence!

Mastering multi-timeframe analysis can transform your trading. 

By aligning higher and lower timeframes, you can trade with confidence and increase your success rate.

Stay tuned for more videos where I’ll cover swing trading and position trading. 

If you have any questions, reach out to our Hawkeye Concierge Team. 

Email: [email protected] – OR – Call: 888-233-8598

We’re here to support you on your trading journey!

Happy Trading,

Anthony Speciale

Hawkeye Traders

Big Energy Profits

Live Analysis: Real-Time Crude Oil Trade

Real-Time Crude Oil Trade: Insights from Live Analysis

Greetings, fellow traders! Anthony Speciale here, and I hope you’re having a wonderful day. Today, I’m excited to walk you through an actual trade, complete with live analysis. This isn’t hindsight analysis or cherry-picking; this is genuine, real-time market analysis, conducted live in front of traders using real money.

The goal is to showcase the credibility and effectiveness of live hawkeye volume and price action analysis, which sets successful traders apart.

Analyzing the Crude Oil Trade

Let’s dive into a specific trade on light sweet crude oil. This is the exact screen I trade on, and I’ll guide you through my thought process and the tools I used to pinpoint high-probability, low-risk entry points.

Real-Time Crude Oil Trade: Insights from Live Analysis
Live analysis

The Setup: Identifying Market Conditions

On the top left of the screen, you’ll see a 4-hour chart, which is my primary tool for analysis. Crude oil had been on a significant uptrend, breaking recent highs from May 20th and continuing to push higher.

However, by early morning, between 4:00 AM and 7:00 AM, the price action entered a consolidative state. This period of stagnation was a key indicator that a correction might be imminent.

The Prediction: Anticipating a Correction

Given the aggressive uptrend, I anticipated a potential correction. Markets that rise rapidly often experience sharp corrections. I advised my audience that we were likely to see a breather or pullback soon. This prediction proved accurate as the price action eventually broke out of the consolidation zone.

The Trade: Entering Based on Volume Analysis

Using Hawkeye volume indicators, I pinpointed the ideal entry points.

Once we broke below the consolidation area, the market confirmed a correction. Specifically, I noted that if we could stay below the 80.20 level, the price had a strong chance of retesting and breaking past prior lows.

Execution: Capturing the Move

Here’s how the trade unfolded:

  • Initial Short Entry: At the 80.20 level, capturing a move that provided over 100 ticks of profit.
  • Secondary Entry: For those who missed the initial entry, a second opportunity arose when the price retraced to the prior low on high buying volume, which then turned into resistance. This provided another chance to enter short, yielding around 75 ticks.

The Key: Understanding Volume and Price Action

Identifying these trading opportunities relies heavily on understanding the relationship between volume and price action. The Hawkeye tools are designed to help traders recognize areas where reversals or continuations are likely to occur.

The Hawkeye Advantage

Hawkeye tools provide the advantage of real-time volume analysis, enabling traders to:

  • Spot Reversals and Continuations: By analyzing volume, traders can make informed decisions about market trends.
  • Access the Hawkeye Mastery Library: This resource offers extensive educational materials to help traders interpret volume and price action effectively.

Trading successfully requires a deep understanding of market dynamics. Whether you’re day trading, swing trading, or position trading, mastering volume and price action is essential. The Hawkeye tools and Mastery classes are invaluable resources that can elevate your trading game.

If you’re ready to take your trading to the next level, I encourage you to explore the Hawkeye indicators and educational resources. Understanding volume and price action will help you navigate the markets with confidence and precision.

Thank you for being here with me today. Keep learning, and stay focused!

Happy Trading,

Anthony Speciale

Hawkeye Traders

Big Energy Profits

High Volume Candles: Insights from the S&P 500 Session Sell-Off

Today, let’s dive into the opening bell of the S&P 500 and uncover the critical insights from the market’s initial movements.

As a live trader of the futures market, I want to walk you through what I observed, how it unfolded, and what it means for your trading strategy.

Key Observations at the Opening Bell

Time of Focus: 9:30 AM EST The U.S. session kicks off at 9:30 AM EST.

At this precise moment, we witnessed a notable candle with ultra-high buying volume. Let’s break down why this is important and how it set the tone for the day . . .

Ultra-High Buying Volume:

  • At 9:30 AM, the market printed the highest buying volume candle of the session, surpassing even the overnight activity. This candle opened and closed at the same price, indicating significant buying pressure without any price advancement. This is a red flag signaling potential resistance.

Market Reaction:

  • Post 9:30 AM, the market failed to push higher despite the buying volume, indicating resistance. The area around this candle’s wick became a strong supply zone, tested multiple times throughout the day, but never breached.

ADD Hawkeye Volume, Volume Radar, Volume Paintbar and Wide Bar to your charts NOW!

Interpreting the Data

Understanding such market behavior can help you make informed trading decisions. Here’s a step-by-step breakdown:

Resistance Identification:

  • The 9:30 AM candle created a clear resistance level. The market’s inability to move above this point despite high buying volume suggested downward pressure.

Trend Line Analysis:

  • Drawing a trend line from the session’s 10am low through subsequent lows provided additional confirmation. The market tested this trend line multiple times before breaking it and retesting it as resistance, further confirming the bearish trend.

Volume and Price Action:

  • Combining volume indicators with price action helps in identifying significant market movements. The failure to break above the 9:30 AM high volume candle, followed by a break and retest of the trend line, set the stage for a bearish continuation.
Opening Bell Volume Sets Stage For S&P 500 Session Sell-Off
high volume candles

Practical Application

As a retail trader, here’s how you can apply these insights:

Watch Key Candles:

  • Pay attention to high volume candles at market opens. These high volume candles often set the tone for the day and indicate critical support or resistance levels.

Use Trend Lines:

  • Draw trend lines to track the market’s direction. A break and retest of these lines can signal entry and exit points.

Combine Volume with Price Action:

  • High volume candles without price movement often indicate resistance or support. Use volume analysis alongside price action to confirm market sentiment.

    By understanding and analyzing how high volume candles and price action interact with one another, you can develop a more robust trading strategy.

The key is to recognize significant volume spikes and how the market reacts to them.

Ready to dive deeper into these concepts, our Hawkeye Volume and Price Action Mastery Library is a resource I couldn’t imagine trading without!

Happy Trading,

Anthony Speciale

Hawkeye Traders

Big Energy Profits

Nasdaq Tee’s Up! 500+ Tick Rally

Welcome to today’s blog post, where we delve into a critical aspect of successful trading: effective market analysis through the lens of volume and price action. In this case, I explain through a live NASDAQ trade as shown in my most recent video.

I’m Anthony Speciale with Hawkeye Traders, and I’m excited to share insights that can transform your trading strategy.

Today, we’ll explore how to identify key market signals, interpret volume and price action, and use these tools to enhance your trading performance.

The Power of Volume and Price Action

Understanding volume and price action is fundamental to successful trading.

These two elements provide a window into market dynamics, allowing traders to make informed decisions based on market behavior.

At Hawkeye, we emphasize the importance of these tools and provide comprehensive resources to help traders master them.

Nasdaq Tee's Up ‍♂️ 500+ Tick Rally
nasdaq

Identifying Market Signals

One of the first steps in market analysis is identifying significant price levels and volume surges. Let’s break down a recent NASDAQ trade to illustrate this.

Step 1: Recognizing Key Levels

Early in the morning, the NASDAQ built a base that was ripe for a breakout.

The first crucial step was identifying the low point, which serves as a support level.

Observing high volume surges and wide bars—key indicators provided by Hawkeye—can highlight these critical areas.

These wide bars and volume indicators draw attention to significant market movements, whether they signal a reversal, continuation, or another meaningful event.

Step 2: Understanding Volume and Price Interaction

Volume and price action are interconnected, providing context for market moves.

At Hawkeye, we teach traders not just to use indicators but to understand the story they tell.

For example, at 8:30 AM, an ultra-high volume radar dot and a wide bar signaled significant activity.

These indicators suggest that something important is happening, prompting traders to pay close attention.

Patience Pays Off

One of the hardest lessons for traders is learning to wait for the right opportunity.

It requires discipline and experience to let the market come to you rather than rushing into trades.

By putting in the time and observing market conditions, traders can develop a deeper understanding of when to act.

Step 3: Contextual Analysis

Looking at prior price action can provide valuable context.

For instance, identifying the overnight high and how the market reacts around these levels can offer clues about future movements.

Drawing lines on the chart to mark these levels can help visualize where support and resistance are likely to occur.

Trading the Breakout

When the market breaks out of a consolidation phase, it often presents a lucrative trading opportunity.

Here’s how to approach it:

Step 4: Waiting for Confirmation

Rather than jumping in as soon as the market moves, wait for confirmation.

A close above a significant level—such as the wick of a high-volume candle—can confirm the breakout.

In our example, waiting for the market to retest this level after breaking out provides confirmation and a potential entry point with less risk.

Step 5: Managing Risk

Risk management is paramount.

Placing your stop loss just below the retest level minimizes risk while maximizing potential profit.

By waiting for the retest, you can enter the trade with a tighter stop, reducing the amount you stand to lose if the trade doesn’t go as planned.

The Results

In our NASDAQ example, the market confirmed the breakout with a strong close above the significant level and retested it, providing a low-risk entry point.

This setup allowed for a substantial profit as the market moved significantly in a short period.

The Hawkeye Advantage

At Hawkeye, we equip traders with the tools and knowledge needed to make informed decisions.

Our software highlights key market signals, and our Mastery course teaches you how to interpret these signals within the broader market context.

By focusing on volume and price action, you can develop a robust trading strategy that prioritizes risk management and increases your chances of success.

Volume and price action should be at the forefront of your trading plan.

They provide critical insights that can help you understand market movements and make better trading decisions.

If your current results aren’t meeting your expectations, I encourage you to revisit your trade plan and consider incorporating volume and price action analysis.

At Hawkeye, we are dedicated to helping traders grow and succeed.

Trading is a journey of continuous learning, and with the right tools and mindset, you can achieve consistent success.

If you found this post helpful, please like and share it. Leave a comment with your thoughts or questions, and I’ll respond personally. Don’t forget to subscribe to our channel for more valuable insights. Stay disciplined and focused on risk management.

Happy Trading,

Anthony Speciale

Hawkeye Traders

Big Energy Profits

Enhancing Trading Success with a Solid Trade Plan

Enhancing Trading Success with a Solid Trade Plan

Welcome to today’s analysis, where we delve into the intricacies of a quick, but successful LIVE crude oil trade. I’m Anthony Speciale from Hawkeye Traders, and I’m here to guide you through a setup I executed this morning.

We’ll explore the price action, volume analysis, and the thought process behind the trade, emphasizing risk-reward and adherence to a trade plan.

This detailed walkthrough aims to enhance your understanding and help you make informed trading decisions based on the Mastery teachings of Hawkeye Traders.

The Setup

This morning, I approached the market with no initial intention of trading. However, when the setup aligned perfectly with my trade plan criteria, I couldn’t resist. Trading is about probabilities and making informed decisions based on the relationship between volume and price action.

Here’s a step-by-step breakdown of the trade:

Observing the Market

During the overnight session, an awkward bottom formed between 8:10 and 9:20 PM. This period of over an hour saw price action repeatedly hitting a support level without breaking through. This consolidation was significant, indicating a potential trading opportunity.

When I sat down at my trading desk, I noticed this consolidation zone. Price had previously reacted strongly at this level, bouncing off and creating a bottoming pattern. This repetitive price action highlighted a critical support zone worth monitoring.

Analyzing Key Levels

I marked this support level on my chart and kept an eye on the price action as it unfolded. Despite my early departure plan, the market conditions met my criteria for a trade. The initial consolidation, followed by a strong volume surge, was crucial.

Price action showed signs of struggling to break above a significant resistance level marked by a previous high. This failure, coupled with high buying volume and a lack of follow-through, signaled a short trade opportunity.

Enhancing Trading Success with a Solid Trade Plan
trade plan

Technical Analysis and Decision-Making

As price approached the session VWAP (Volume Weighted Average Price), I anticipated a test of this level. My trade plan involved shorting the market with a tight stop and targeting the VWAP for a quick profit. This strategy was based on the high probability of a pullback after a strong volume surge identified by Hawkeye Volume Radar with no follow-through.

I entered the trade at 76.75, with a stop at 76.80, risking five ticks. My target was the VWAP, around 15 ticks away, offering a 3:1 risk-reward ratio. This alignment with my trade plan gave me confidence in the setup.

Managing the Trade

The market behaved as expected, moving swiftly towards the VWAP. Upon hitting the VWAP, I covered the majority of my position, locking in profits. I left a small portion of the trade open to see if the market would push further down to retest the lows. However, it didn’t, and I was stopped out at break-even for the remaining position.

This trade exemplified the importance of following a well-defined trade plan. Even with minimal screen time, understanding key levels and volume dynamics enabled me to execute a successful trade with limited risk.

Key Takeaways for Retail Traders

  • Volume and Price Action Relationship: Understanding how volume influences price action is crucial. High volume with no follow-through often indicates a reversal or strong support/resistance.
  • Risk-Reward Ratio: Always ensure your trades have a favorable risk-reward ratio. In this case, a 3:1 ratio provided a clear edge.
  • Trade Plan Adherence: Stick to your trade plan. Enter trades only when your criteria are met, and manage your risk diligently.
  • Market Context: Recognize significant levels and market context. Previous highs and lows often act as strong support or resistance.

Today’s trade demonstrates the power of strategic trading based on Hawkeye Volume and Price Action analysis. By following a disciplined approach and focusing on high-probability setups, you can achieve consistent results in the market.

If you found this analysis helpful and want to deepen your trading knowledge, I invite you to join our upcoming Training Webinar. Learn advanced strategies, risk management techniques, and how to leverage Hawkeye indicators for optimal trading performance.

Register for the Training Webinar Now and take the first step towards mastering volume and price action analysis. Don’t miss this opportunity to enhance your trading skills and achieve greater profitability.

Stay focused, trade smart, and remember: quality over quantity yields the best long-term results.


Happy Trading,

Anthony Speciale

Hawkeye Traders

Big Energy Profits

[LIVE] Calling Session High: Identifying 2024’s YTD Largest Broad Market Sell-Off

[LIVE] Calling Session High: Identifying 2024's YTD Largest Broad Market Sell-Off

Anthony Speciale here from Hawkeye Traders, and I’m thrilled to share some insights with you today.

As many of you experienced, today was an eventful day in the markets, and there’s a lot we can learn from it.

The Power of the 8:30 AM Candle

Let’s dive right into the action. At 8:30 AM, we received some significant economic data, which had a profound impact on the market.

The 8:30 AM candle printed the highest buying volume of the session, accompanied by what we at Hawkeye refer to as a “wide bar.”

A wide bar, especially when combined with ultra-high volume, is a critical signal. It indicates substantial market activity and demands our close attention.

[LIVE] Calling Session High: Identifying 2024's YTD Largest Broad Market Sell-Off
market sell-off

Real-Time Trading and Credibility

I want to emphasize that my analysis was not done in hindsight.

This call was made live, in front of traders who were actively trading with live money.

It’s important to understand that hindsight analysis is easy; the real credibility comes from making these calls in real-time.

I trade daily, applying the skills and knowledge I’ve developed over years of market experience.

My journey has included mastering both the technical and psychological aspects of trading, and I’ve helped many others overcome their trading hurdles.

Discipline and Consistency: The Trader’s Edge

Trading successfully requires discipline and consistency.

It’s all about understanding probabilities and having a solid trade plan, which includes effective risk management.

When your trade plan and market analysis align, you must be ready to place your trades confidently and without hesitation.

The Technical Breakdown

Now, let’s break down today’s market action.

After the initial 8:30 AM spike, we started to consolidate.

I highlighted that if we couldn’t close above the high of the 8:30 AM candle, we were likely to see a rollover, potentially leading to a market sell-off.

This level was crucial, and failing to close above it indicated weakness.

I identified another critical support level at 5366.25. If the market closed below this level, it would confirm the rollover, leading to a further decline and a more pronounced market sell-off.

[LIVE] Calling Session High: Identifying 2024's YTD Largest Broad Market Sell-Off
market sell-off

The Importance of Risk Management

I always advocate for paying yourself and protecting yourself.

As the market moves in your favor, take profits and adjust your stops to break even.

This ensures that you mitigate risk while maximizing potential gains.

In today’s scenario, the initial risk was 12 ticks from entry to high.

However, the market presented an opportunity to achieve a 30:1 risk-reward ratio, amounting to 366 ticks on the S&P 500.

This demonstrates the potential of understanding the relationship between volume and price action using Hawkeye tools.

The Hawkeye Advantage

Hawkeye tools provide the clues necessary to interpret market conditions.

They help you identify high-probability setups by analyzing volume and price action.

However, it’s essential to apply your own analysis and judgment to make informed trading decisions.

Live Proof of Concept

Again, I want to reiterate, this analysis was offered LIVE, with traders using real money.

This isn’t just theoretical; it’s practical and actionable.

I have traders who can attest to the accuracy and timeliness of these calls.

Expanding the Analysis to Other Indices

We also observed similar patterns in other major indices like the NASDAQ.

At 8:54 AM, the market dynamics were consistent across these indices, providing further validation of the analysis.

Today’s session highlights the importance of understanding volume and price action.

By utilizing Hawkeye Volume Tools, traders can gain a significant edge in the market.

Remember, trading is a business of probabilities, and having a disciplined approach with a solid trade plan and risk management strategy is key to long-term success.

Thank you for joining me today. I hope you found this analysis insightful and beneficial. Stay disciplined, trade wisely, and continue to refine your skills. I’ll see you next time, hopefully with a new market sell-off with outstanding profits!

Happy Trading,
Anthony Speciale
Hawkeye Trader
Big Energy Profits

Capitalizing On A Flip-Flop Of Ultra-High Volume

Capitalizing On A Flip-Flop Of Ultra-High Volume

Anthony Speciale here with Hawkeye Traders, bringing you another live volume interaction analysis. 

Today, I want to walk you through the thought process behind these two trade setups, emphasizing the critical role of context in the market. 

My goal is to help you harness volume and price action as the foundation of your trading strategy. 

Whether you’re building on existing skills or just starting out, this is where it all begins.

The Importance of Live Market Experience

I watch the market live every single day. Why? 

Because true experience and learning come from observing live market conditions. 

It’s easy to look back in hindsight and see patterns, but trading in real time involves emotions and discipline that can’t be replicated any other way.

When I analyze the market live, I do it in front of other traders. 

This adds a layer of accountability and credibility to my work. 

These traders are using their own money, and my real-time analysis helps them make informed decisions based on the evidence the market provides.

Today’s Market Setup

Let’s dive into today’s session. At 7:42 AM Eastern Standard Time, we saw a massive candle with ultra-high buying volume. This was a critical moment. 

We had two possible scenarios: a reversal or follow-through. 

At Hawkeye, we call this a “green bottom” when dealing with buying volume. 

The wide bar was highlighted in magenta, indicating it was significantly larger than previous bars over a calculated period.

Analyzing Key Market Movements

I focus on whether the price closes above or below such significant volume bars. 

We saw the price push back up to the high, fail, and then retest the low, creating a short-term double bottom. 

The middle high of this formation is known as the neckline.

By 8:00 AM, we saw a candle closing above the neckline, suggesting a potential push towards the previous high before the aggressive selling. 

This movement offered about 47-48 ticks, a respectable trade opportunity.

Capitalizing On A Flip-Flop Of Ultra-High Volume
market live

Managing the Trade

As the price continued to move, I was closely watching for a close below the double bottom, which occurred with strong selling volume. 

This was a critical signal. It indicated a potential for the market to fall further, aligning with our expectations based on the volume and price action observed.

My analysis predicted specific profit targets to the downside:

  • 56 ticks into 2400
  • 110 ticks into 2394.5
  • 135 ticks into 2392
  • 177 ticks into 2388

The Power of Volume and Price Action

This trade setup illustrates how volume and price action create a story that traders need to read, interpret, and act upon. 

Understanding the relationship between high buying and selling volumes is crucial. 

When ultra-high buying volume meets resistance, it takes equally high selling volume to break through those levels.

Hawkeye’s software simplifies this analysis.

It color-codes the bars and volume spikes, highlighting areas of significant activity. 

This visual representation helps traders quickly understand who is in control – buyers or sellers – and make informed decisions.

Consistent, Predictable Trading

The key to successful trading is consistency and discipline. 

By employing a well-defined trade plan and risk management approach, traders can take advantage of predictable market movements. 

The goal is not to play in uncertain, “junk” areas of the market but to focus on clear, high-probability setups.

Learn and Master Your Trading

To help you master these techniques, we offer Hawkeye’s volume and price action tools along with comprehensive training resources. 

This combination will enable you to understand and apply these principles in real-time market conditions.

Ready to learn more about how to leverage these VOLUME tools?  CLICK HERE NOW.

Reach out to me or the Hawkeye team with any questions, and we’ll get you started on the path to more informed and confident trading. I’ll see you in the next video!

Happy Trading,

Anthony Speciale

Hawkeye Traders

Big Energy Profits

Selling Volume Sets The Stage – Buying Volume Confirms

Market reversal

Hello, traders! Anthony Speciale here with Hawkeye Traders. I hope you’re having a fantastic day. Today, I want to take you through my recent analysis of the S&P 500, focusing on a significant market reversal. While I didn’t pinpoint the exact low, I accurately identified a crucial level that the market respected, leading to a robust reversal. Let’s dive into the price action and volume dynamics to understand this better.

Analyzing Market Reversals

The Predictable and Unpredictable Nature of Markets

Markets can be both predictable and unpredictable. However, by focusing on specific indicators such as volume and price action, we can often identify potential reversal points. This morning, I highlighted an area of interest in the S&P 500 live, sharing my insights with other traders.

The Core of Market Analysis

Volume and price action are the foundation of any effective trading strategy. If your trade plan doesn’t prioritize these elements, you might be experiencing inconsistent results. Let’s break down how I use these indicators in real-time analysis.

Dissecting the S&P 500

Market reversal
market reversal

Identifying Key Levels Using Hawkeye Volume Analysis

This morning, I focused on the 9:00 AM candle, which showed very high selling volume, the highest since the Globex open. Despite the heavy selling, the market did not follow through but instead reversed. This suggested a potential low point.

Here’s a step-by-step breakdown:

  • Ultra-High Selling Volume: The 9:00 AM candle printed with substantial volume, indicating significant selling pressure.
  • Rejection at Yesterday’s Low: This selling pressure brought us to the previous day’s low, a critical level where strong rejection occurred.
  • No Follow-Through: Despite the high volume, there was no immediate continuation of the downtrend, hinting at a potential reversal.

Real-Time Reversal And Market Response

During the live session, I pointed out this critical area to fellow traders. As expected, the market reversed from this low.

Here’s the detailed action:

  • Initial Reversal: After hitting the previous day’s low on high volume, the market reversed.
  • Confirmation with Buying Volume: The 9:30 AM US open saw a surge in buying volume, confirming the reversal.
  • Targeting Immediate Highs: I identified immediate highs as potential targets, using basic price action analysis to set these levels.

Practical Application – How To Use Hawkeye Volume Analysis

By understanding the relationship between volume and price action, you can make more informed trading decisions.

Here’s how you can apply this:

  • Identify High-Volume Areas: Look for candles with significant volume, especially at key support or resistance levels.
  • Analyze Follow-Through: Determine if the market continues in the direction suggested by the volume spike or if it reverses.
  • Set Targets and Manage Risk: Use price action to set realistic targets and manage your risk effectively.

Building a Consistent Trading Strategy

Understanding and utilizing volume and price action is crucial for consistent trading success. This approach works across various market conditions and helps in identifying both opportunities and potential risks.

If you found this analysis helpful, please like and subscribe to our channel so you don’t miss our future videos. If you have any questions, leave a comment below, and I’ll personally respond. For more detailed guidance, reach out to us via email or phone – all the contact details are provided below the video.

Trading is a business of probability. By focusing on volume and price action, you can build a replicable trade plan that enhances your edge in the market. The tools and strategies offered by Hawkeye Traders are designed to make this process easier and more effective. Thank you for reading. God bless, and I’ll see you in the next video!

Access Hawkeye Volume Tools and Trading Mastery Strategies NOW

Happy Trading,

Anthony Speciale

Mastering Market Highs and Lows LIVE with Hawkeye Volume

Mastering Market Highs and Lows LIVE with Hawkeye Volume

Hey Trader! Today, I want to share an insightful analysis on how to effectively nail the highs and lows in the market, focusing specifically on crude oil and gold.

Understanding these key points can significantly improve your trading performance.

The Hawkeye Approach

Trading is not just about looking back and saying, “I would have bought there or sold here.” It’s about making real-time decisions based on thorough analysis.

At Hawkeye Traders, we provide you with the tools to analyze, interpret, and set expectations based on the market’s evidence.

The Power of Volume and Price Action

By leveraging the Hawkeye approach, particularly the Hawkeye Volume Tools and Price Action Mastery Methods, you can gain a substantial edge.

These tools help you identify critical points in the market, allowing you to capitalize on high-probability trading opportunities.

Today, we’ll delve into two such opportunities: a high on crude oil that led to a significant sell-off, and a low on gold that triggered a notable rally.

Crude Oil: Identifying the High

Chart Setup

  • Instrument: Light Sweet Crude Oil
  • Timeframe: 3-minute chart

Key Observations

  • Aggressive Sell-off: We identified a significant low at the 78.80 level where the market failed to push lower despite high volume.
  • Reversal Indicator: The market then formed a base and climbed up to around 80.00, where we saw a volume climax.
  • Volume Analysis: At 10:06 a.m. EST, a high buying volume candle appeared with a red volume radar dot, indicating a potential reversal.
  • Wide Bar: The wide bar at this high signaled a likely reversal, confirmed by no follow-through buying volume.

Trade Execution

  • Entry: After the wide bar and high volume, we looked for the market to fail to push through the wick of the high.
  • Risk: The risk was minimal, around 10 ticks.
  • Reward: The target was a retest of the earlier low, offering a 13:1 risk-reward ratio with a potential gain of 130 ticks.

Gold: Spotting the Low

Chart Setup

  • Instrument: Gold Futures
  • Timeframe: 3-minute chart

Key Observations

  • Downtrend Reversal: During a pronounced downtrend, we identified a high selling volume candle at the low.
  • Volume Analysis: The excessive selling volume at the low suggested a potential end to the sell-off.
  • Price Action: We monitored the market’s ability to hold the wick of the low candle.

Trade Execution

  • Entry: Upon seeing the market hold above the low wick, we entered a long position.
  • Risk: The risk was around 25-30 ticks.
  • Reward: The potential gain was up to 278 ticks, providing a significant profit opportunity.
Mastering Market Highs and Lows LIVE with Hawkeye Volume
Market

Simplifying Your Trading

By focusing on volume and price action, and utilizing the Hawkeye Volume Tools, you can identify key market turning points with precision.

The examples above highlight how understanding volume dynamics can lead to profitable trades with excellent risk-reward ratios.

Join Us

If you’re ready to enhance your trading skills, explore our Hawkeye Volume Tools and Price Action Mastery Mastery for yourself . . .

Click Here to access the content and reach out to our team for assistance. Remember, simplifying your trading approach can lead to consistent and substantial gains.

Trading is about discipline, risk management, and leveraging the right tools. At Hawkeye Traders, we are dedicated to helping you succeed!

Happy Trading,

Anthony Speciale

Hawkeye Traders

Big Energy Profits

A Detailed Analysis of Quest Diagnostics, Inc. (DGX)

A Detailed Analysis of Quest Diagnostics, Inc. (DGX)

Anthony Speciale here with Hawkeye TradersToday, we’re diving into Quest Diagnostics Inc. (DGX), examining its current breakout, the preceding price action, and volume.

By dissecting these elements, we’ll explore why there’s potential for this stock to move higher. As always, a thorough analysis considers both opportunities and risks to make well-informed trading decisions.

The Importance of Price Action and Volume

In any trading strategy—whether intraday, swing, or position trading—understanding the interplay between volume and price action is crucial.

By combining these elements with market context and risk assessment, traders can make more educated decisions and improve their trading outcomes.

Let’s break down how these components come together using DGX as our case study.

Daily Chart Analysis

The chart we’re analyzing is a daily chart, where each candle represents one full day’s trading from 9:30 a.m. to 4:00 p.m. EST on the New York Stock Exchange (NYSE).

Each candle shows the high, low, open, and close prices within this period.

A Detailed Analysis of Quest Diagnostics, Inc. (DGX)
DGX

Key Observations on DGX

Ultra High Volume Candle:

  • We identified a specific candle with ultra high volume. This candle followed a period of aggressive selling, indicating a significant buying interest that pushed prices up.
  • The price pushed into prior resistance levels but was initially rejected, a critical point to consider for potential future movements.

Support and Resistance Levels:

  • After the aggressive buying, the price pulled back into a support level, which was previously a resistance level.
  • Despite testing this support, the price did not close below the high-volume candle, indicating that buyers were still active.

Volume and Price Relationship:

  • The initial rejection at resistance and subsequent support hold suggest strong buying interest.
  • A critical observation is that the price closed above the high-volume candle after a brief consolidation, indicating a potential breakout.

Market Context and Risk Assessment

When analyzing a potential trade, always consider the broader market context and assess the risks. Here’s how we do it for DGX:

Price Action and Market Context:

  • The price action shows higher lows and higher highs, indicating a strong uptrend.
  • Each pullback into support levels held firm, and subsequent moves higher were on increased volume.

Potential Upside and Profit Targets:

  • Identify key resistance levels where the price might face challenges. For DGX, these levels are around $148.50, $150.20, $154.40, $156.20, and $158.30.
  • If the price can push through these levels, we could see it test the highs around $175.

Risk Management:

  • Always define your risk levels. For DGX, consider the possibility of price snagging at previous highs. If the price fails to push past these levels, be prepared to take profits or manage your position accordingly.

Practical Trading Insights

Volume Confirmation:

  • A breakout or breakdown should be accompanied by increased volume to confirm the move’s validity.
  • Weak volume during these moves may signal a lack of conviction, increasing the risk of a false breakout.

Using Hawkeye Tools:

  • Our proprietary Hawkeye Volume Indicators helps interpret volume and price action, identifying who’s in control of the market.
  • The tools display volume in a way that’s easy to understand, highlighting buying and selling pressures.

Strategy Implementation:

  • Align your trade plan with volume, price action, and market context for consistent results.
  • Assess each trade based on its alignment with your criteria and risk management rules.

Quest Diagnostics (DGX) demonstrates a textbook example of how to analyze price action and volume to make informed trading decisions.

By understanding the relationship between these elements and considering market context, you can identify high-probability trading opportunities.

If you’re looking to enhance your trading strategy with volume and price action analysis, consider using tools like the ones offered by Hawkeye Traders. Our mastery class and indicators provide a comprehensive approach to interpreting market movements.

Remember, trading is about putting the odds in your favor through disciplined analysis and risk management.  Access Hawkeye Volume and Mastery NOW

Happy Trading,

Anthony Speciale

Hawkeye Traders

Big Energy Profits

[PLUG] Plug Power Inc.: LIVE Trade Case Study

[PLUG] Plug Power Inc.: LIVE Trade Case Study

Welcome, traders! Anthony Speciale here with Hawkeye Traders and Big Energy Profits.

Today, I’m excited to take you through a live trade case study on Plug Power Incorporated (PLUG), demonstrating the powerful impact of using Hawkeye Volume and Price Action Methodology. This case study highlights the strategic analysis and disciplined execution that led to significant profits. Let’s dive in!

Analyzing the Setup

Our focus is on Plug Power (PLUG), traded on the NASDAQ. We’re examining a daily chart, meaning each candle represents a full day’s worth of price movement. The chart revealed a crucial period of indecision, with a mix of buying and selling volumes over several days. This indecision indicated that buyers and sellers were battling for control.

Spotting the Breakout

After seven days of consolidation, we observed a strong selling volume accompanied by an aggressive downside candle. This significant move indicated that sellers had gained control, creating an area of supply or resistance.

When the price returned to this supply zone, it was met with mixed volume over five days, reinforcing the supply level. Anticipating that sellers would step in again, we issued a trade alert on October 13, 2023.

Executing the Trade

The short trade was placed on October 16, 2023. Here’s a breakdown of the trade setup:

  • Entry Point: $7.35 or higher
  • Stop Loss: $7.95 (8.2% risk)
  • First Target: $6.25 (14.95% reward)
  • Second Target: $4.50 (initially 38.83% reward, but realized 49.5% due to a gap)
  • Third Target: $2.00 (potential 73% reward)

This setup provided a favorable risk-to-reward ratio, emphasizing the importance of risk management. By keeping risk at 10% or less of the position size, traders can withstand multiple losses without depleting their accounts.

[PLUG] Plug Power Inc.: LIVE Trade Case Study
PLUG Trade

Realized Gains and Risk Management

Our strategy emphasized taking profits at predefined targets:

  • First Target: Upon reaching the first target, we took profits and moved the stop loss to the entry point, ensuring a risk-free trade on the remaining position.
  • Second Target: The market gapped below the second target, allowing us to lock in a 49.5% gain instead of the initial 38.83%.

By systematically taking profits and adjusting the stop loss, we protected our gains and positioned ourselves for further profits without additional risk. The trade remains active, with a final target at $2.00, offering a potential 73% gain.

The Power of Volume and Price Action

This case study underscores the effectiveness of Hawkeye Volume and Price Action Methodology. Understanding the relationship between volume and price action is crucial for identifying high-probability trades. Here are key takeaways:

  • Volume Analysis: Mixed volumes during consolidation indicate indecision, while strong selling or buying volumes signal control.
  • Risk Management: Keeping risk below 10% of the position size and using a stop loss ensures protection against significant losses.
  • Profit Taking: Systematically taking profits at predefined targets and adjusting stop losses locks in gains and reduces risk.

Trading is a business of probabilities. By combining volume and price action analysis with disciplined risk management, you can enhance your trading edge.

This approach doesn’t guarantee winning every trade, but it significantly increases the likelihood of success over time.  Access Hawkeye Volume Mastery Today!

Thank you for joining me today. Stay disciplined, stay focused, and happy trading!

Happy Trading,

Anthony Speciale

Hawkeye Traders

Big Energy Profits

[XOM] Exxon Mobil Corporation: LIVE Trade Case Study

[XOM] Exxon Mobil Corporation: LIVE Trade Case Study

Welcome, fellow traders, to an insightful exploration of a real trade executed within my Big Energy Profits service, utilizing the powerful Hawkeye Volume Driven Tools.

Today, I’ll break down the specifics of this trade, share the techniques and analysis methods I use, and demonstrate how volume has been crucial in sustaining and potentially amplifying our returns.

The Trade Breakdown

Let’s dive into the specifics of this trade on XOM. We identified a promising entry point at $103.75 with a stop-loss set at $100.00, risking less than 4%. This cautious approach aligns with my trading philosophy: small risks with substantial upside potential.

[XOM] Exxon Mobil Corporation: LIVE Trade Case Study
XOM
From this entry, we saw a strong upward movement, hitting our initial targets at $109, $112, and $118. The key to staying in this trade, even as it pulled back, has been understanding the interplay of volume and price action.

Hawkeye’s Volume Driven Tools have been instrumental in this analysis.

Volume and Price Action: The Keys to Trading Success

Volume is the heartbeat of the market. It provides insights into the strength and validity of price movements. In our trade, even as prices pulled back, the selling volume failed to break through significant support levels.

This consistent inability to close below support, despite increased selling volume, indicated that sellers were being absorbed and buyers were stepping in.

This understanding kept us in the trade, allowing us to ride the upward momentum.

By focusing on these volume cues, we identified that the market was likely to test higher levels, potentially revisiting $121 and $123, with potential to continue upward.

The Simplicity of Effective Trading

The charts I use are straightforward. Aside from my annotations, the core elements are volume and price action.

These two factors alone provide a comprehensive view of market dynamics.

While many traders clutter their screens with numerous indicators, it’s essential to recognize that these indicators are lagging, and reflect what has already happened.

Volume and Price Action, however, are LEADING INDICATORS.

They offer predictive power by showing the underlying market sentiment and potential future movements. Understanding this relationship is crucial for any trader aiming to achieve consistent profitability.

Lessons Learned and Moving Forward

In trading, not every expectation will play out perfectly. However, having a robust trade plan and a solid understanding of volume and price action allows for profitable adjustments even when the market deviates from initial predictions.

In our case, the stars aligned for this trade and BIG PROFITS were achieved, by simply adhering to our strategy and managing risks effectively.

Why Volume-Based Trading?

Volume-based trading provides a significant edge in the market. It’s about recognizing the flow of orders and understanding market context. By focusing on these elements, traders can make informed decisions, minimize risks, and maximize returns.

If you’re serious about advancing your trading skills, I invite you to explore more about Hawkeye’s Volume Driven Tools and my Big Energy Profits service.

Whether you’re new to trading or have years of experience, enhancing your understanding of volume and price action will be a game-changer.

Take the Next Step

I encourage you to dive deeper into the resources available below this post. Reach out to me or my team at Hawkeye Traders with any questions. We’re here to support your trading journey and help you become a more proficient and successful trader.

Thank you for reading, and I hope you find this analysis insightful. Stay tuned for more valuable content, and as always, trade smart and manage your risks!

Happy Trading,

Anthony Speciale

Hawkeye Traders

Big Energy Profits

Learn from a 300+ Tick Gold Rush Identified LIVE

Learn from a 300+ Tick Gold Rush Identified LIVE

Hey Trader,

When it comes to trading, hindsight is always 20/20. However, the real credibility lies in identifying opportunities as the market ticks. 

Analyzing market movements live and leveraging this analysis to make informed decisions is what sets successful traders apart. 

It’s easy to look back and say, “I could have made this trade,” but the challenge is to recognize and act on these opportunities in real time.

Successful trading is not about looking back at what could have been done. 

It’s about recognizing opportunities as they unfold and making strategic decisions in real time. This is where live market analysis becomes invaluable. 

Experienced traders navigate the market live, interpreting price action and volume,which  can provide insights that are difficult to grasp through static, post-mortem analysis.

In a recent live session, we analyzed gold futures using a three-minute chart. 

This timeframe, though brief, can reveal significant trading opportunities if interpreted correctly. During this session, I pinpointed an area of interest in real-time, explaining the analysis process that led to a high-probability trade setup. 

The key was understanding the relationship between volume and price action, which allowed us to anticipate a potential move higher.

Initially, the market was in a period of congestion or consolidation, a phase where indecision prevails, and price moves within a narrow range. These periods are crucial because they often precede significant market moves. 

Here’s what we observed:

  1. Exit from Congestion: The market broke out of the congestion zone, signaling a potential trend.
  2. Consolidation: Post-breakout, we noticed a series of candles moving sideways, indicating a pause before the next move.

One candle, in particular, caught our attention:

  • High Buying Volume: Despite the high buying volume, the price didn’t move significantly, suggesting absorption by sellers.
  • Ultra-High Selling Volume: The next candle had ultra-high selling volume, but the price closed higher than it opened. This divergence indicated that sellers were being absorbed, and buyers were stepping in.

Divergences between volume and price often signal an impending move. 

In this case, the high selling volume without a corresponding price drop suggested that the sellers were exhausted, and buyers were ready to push the price higher. 

With this divergence in mind, we identified a high-probability, low-risk entry point:

  • Entry Point: We entered a long position above the consolidation zone.
  • Risk Management: Placed a stop loss a few ticks below the consolidation low, risking approximately 15 ticks.
  • Profit Target: The market moved significantly in our favor, offering a profit potential of up to 306 ticks.

Even if you didn’t catch the absolute top, holding the position until the closing bell could have easily yielded 240 ticks. The key takeaway is to avoid greed and take profits as the market moves in your favor.

This case study underscores the importance of understanding volume and price action. 

These tools are crucial for identifying high-probability trade setups. Whether you’re trading intraday on a three-minute chart or longer-term, the principles remain the same.

Are you willing to invest the time and effort to master volume and price action analysis? 

The rewards are substantial, but it requires dedication and practice. These opportunities exist across all timeframes and market conditions. By honing your skills, you can unlock significant profit potential and enhance your trading success.

You’re invited to embrace Volume and Price Action:  Click Here to Experience it NOW

Happy Trading,

Anthony Speciale

Hawkeye Traders

A Deep Dive into the Euro FX Futures Market

A Deep Dive into the Euro FX Futures Market

Anthony Speciale here with Hawkeye Traders, ready to dissect the Euro FX Futures market. Today, we’re focusing on understanding the significance of ultra-high volume and how it impacts market movements.

This insight can dramatically enhance your trading strategies, so let’s dive in!

The Power of Ultra-High Volume

In today’s analysis, we’re looking at a 3-minute chart of the Euro FX Futures market, starting with the 7:30 a.m. candle.

This specific candle, marked with ultra-high selling volume, closed around the 50% mark of its overall move.

What does this tell us? It indicates strong seller activity being absorbed by buyers, signaling potential market resistance.

Identifying Key Levels

I drew a line at the bottom of this wick to observe if sellers could push below.

Consistently, the market tested this level but failed to break it, confirming the presence of strong buyers.

This pattern suggests a higher probability of the market moving back to previous highs.

Understanding Reversals

Ultra-high volume can indicate a reversal, especially when combined with specific candle formations.

For example, a candle with a large wick on top and a close lower than the open signals strong seller control.

This forms a resistance level, guiding our future trading decisions.

Volume and Price Action Integration

Recognizing how volume and price action interact is crucial.

High volume with significant wicks, especially at key levels, provides valuable insights.

For instance, when sellers fail to push the market lower, it often results in a price reversal back to its previous levels.

Using Hawkeye Volume Indicators

Hawkeye makes analyzing volume and price action straightforward with our proprietary indicators.

Our Hawkeye Volume Tools, available on platforms like TradeStation, TradingView, NinjaTrader, and MetaTrader, include:

  • Volume Radar: Identifies high, ultra-high, and ultra-low volume periods.
  • Volume Paint Bars: Colors bars according to volume control, aiding quick visual analysis.
  • Wide Bars: Highlights significant bars with high volume and large wicks, crucial for identifying key market movements.

Applying Knowledge in Real Trading

To effectively employ these insights, it’s essential to invest time in understanding how high-volume price action pairs work.

Our Hawkeye Mastery Library provides comprehensive explanations, ensuring you can easily integrate these techniques into your trading.

By recognizing patterns such as ultra-high selling volume with failure to close below key levels, you can anticipate short-term reversals and adjust your strategies accordingly.

Conversely, identifying resistance levels formed by significant wicks and high volume can help you avoid potential pitfalls.

Join the Hawkeye Community

Trading successfully requires a deep understanding of volume and price action.

Hawkeye indicators provide the tools you need to navigate the market accurately.

I encourage you to explore our products and consider how they can enhance your trading toolkit.

As a passionate trader and a paying customer of Hawkeye, I can attest to the value these tools bring.

They have been instrumental in my trading success, and I’m dedicated to helping others achieve the same.

The don’t call VOLUME the ONLY “leading indicator” for nothing . . .

Don’t miss out on the benefits of integrating volume analysis into your trading strategies. Click Here to learn more about Hawkeye Traders Volume Indicators, and feel free to reach out to myself or my team with any questions.

Together, we can help you become a more consistent and accurate trader!

Happy Trading,

Anthony Speciale

Hawkeye Traders

Let Volume Lead the Way in Your Trading Journey

Let Volume Lead the Way in Your Trading Journey

Today, I want to dive deep into a concept that can revolutionize your trading approach: letting volume lead the way.

This isn’t just a theory—it’s a practice that I apply live and in real-time, resulting in profitable trades.

If you’re ready to enhance your trading career, understanding the relationship between volume and price action is crucial.

WHY Volume Precedes Price Action

Before we get into the specifics, let’s establish one key principle: volume precedes price action.

This means that significant changes in trading volume often foreshadow price movements.

When you can interpret volume correctly, you gain a significant edge in predicting market behavior.

The Live Scenario Breakdown

Let’s examine a live trading scenario to illustrate this principle in action.

The 7 AM Candle Analysis

At 7:06 AM EST, I noticed an ultra-high buying volume candle. The candle opened at .83 and closed at .87, a narrow four-tick range despite the heavy buying volume.

This discrepancy signaled that buyers were trying to push the price higher, but sellers were absorbing their efforts.

Recognizing Absorption and Market Direction

As the market attempted to move up, it became clear that sellers were absorbing the buying pressure. This absorption suggested that the market, which had been trending downward with lower highs and lower lows, was likely to continue in that direction.

Let Volume Lead the Way in Your Trading Journey

The 8:30 AM Confirmation

By 8:30 AM, the market confirmed this hypothesis.

A new buying candle appeared, but it was only half the size of the previous high-volume candle and managed to close higher.

This indicated that buyers were still being absorbed. The market failed to break above the prior wick, reinforcing my belief that it would push lower.

Executing the Trade

Based on this analysis, I placed a short trade. Here’s the detailed breakdown:

  • Entry Point: After identifying the absorption, I entered short.
  • Risk Management: My total risk was 20 ticks.
  • Profit Targets: The first target was at the prior lows (60 ticks), giving a 3:1 risk-reward ratio. The trade ultimately moved 135 ticks in my favor.

The Power of Hawkeye Volume and Price Action

This trade, which I identified and executed live, was a prime example of how understanding volume and price action can lead to significant profits.

By analyzing these two factors together, you can develop a more accurate thesis about market movements.

How Hawkeye Traders Can Help

At Hawkeye Traders, we specialize in helping traders like you revolutionize their approach.


Our proprietary volume indicators paired with price action analysis enable you to interpret market signals accurately and profitably.

Ready to Transform Your Trading?

I encourage you to explore the resources we offer at Hawkeye Traders.

Click the links below to consume more content, and don’t hesitate to reach out to me or my team with any questions.

Our goal is to equip you with the tools and knowledge to capitalize on trading opportunities effectively.  Click here to embark on your Volume Mastery Journey

Happy Trading,

Anthony Speciale

Hawkeye Traders

Mastering Corn Futures Trading: Using Volume and Price Action for Success

Mastering Corn Futures Trading: Using Volume and Price Action for Success

Hey there, fellow traders! Anthony here, and today I’m excited to dive into the world of corn futures trading. In this video, we’ll explore how we can leverage volume and price action to gain insights into market movements and make informed trading decisions.

At Hawkeye Traders, we’ve developed a unique approach to reversals in the market employing key concepts such as: the “red top” and the “green bottom.”

Let’s delve into how these strategies can empower your trading journey.

In the fast-paced world of futures trading, volume and price action are our guiding lights. Picture this: it’s 9:30 AM EST, the US open, and we witness a massive volatile candle in the corn futures market.

This candle comes with an ultra-high selling volume, indicating significant selling pressure. As the candle closes in the bottom 10-15%, we’re alerted to the potential for a downturn in prices.

Here’s where the “red top” strategy comes into play. We observe the massive wick formed by the candle, signaling a crucial resistance level.

Mastering Corn Futures Trading: Using Volume and Price Action for Success
Corn Futures

This area becomes our focal point, indicating a potential area of supply or resistance. After a subsequent close below this level, we witness a retest, confirming our suspicions. This confirmation provides an optimal entry point for short positions.

Now, let’s talk execution. As traders, we have different styles and risk appetites. Some may choose to enter short positions within the wick, aiming to ride the price down swiftly. Others prefer to wait for a breakout confirmation before entering the market.

Regardless of your approach, effective risk management is key. Set your stop-loss orders conservatively, ensuring minimal risk exposure while maximizing profit potential.

At Hawkeye Traders, our mission is to empower traders like you to navigate the markets with confidence. 

Our innovative volume analysis tools, coupled with time-tested strategies, provide a competitive edge in today’s dynamic market environment.

Whether you’re a seasoned trader or just starting, our goal is to equip you with the knowledge and tools needed to succeed.

Mastering corn futures trading requires a keen understanding of volume, price action, and strategic execution.

By incorporating the “red top” and “green bottom” strategies into your trading arsenal, you can gain valuable insights and capitalize on market opportunities.

Join us at Hawkeye Traders and revolutionize your approach to futures trading. Together, let’s navigate the markets and achieve trading excellence.

Ready to take your trading to the next level? CLICK HERE to access our cutting-edge volume tools and trading mastery resources. Have questions or need assistance?

Feel free to reach out to our team at Hawkeye Traders—we’re here to help.

Don’t forget to like, comment, and subscribe to our channel for more valuable insights. Let’s embark on this trading journey together. Thank you for joining me today!

Happy Trading,

Anthony Speciale

Hawkeye Traders

Platinum Futures: Multiple Timeframe Volume & Price Analysis

Platinum Futures: Multiple Timeframe Volume & Price Analysis

Hey Trader, Anthony Speciale here from Hawkeye Traders, and today I want to delve into a crucial aspect of intraday trading: multiple timeframe volume and price analysis.

This powerful technique, combined with the insights provided by Hawkeye Volume Tools, can give you a significant edge in the markets.

When I’m trading intraday, I don’t just stick to one timeframe. Instead, I analyze multiple timeframes, including the five-minute, three-minute, and even the one-minute chart.

But here’s the kicker: I use higher timeframes like the one-hour and four-hour charts to provide me with valuable insights into potential market movements.

Let’s take a closer look at how this works using an example from Platinum Futures. In this one-hour chart, I’m paying close attention to specific candles and volume patterns to anticipate potential reversals.

One key indicator I look for is Hawkeye’s Ultra-High Volume Radar Dot to appear, especially when it coincides with specific price levels.

For example, if we see a candle with a large wick and ultra-high buying volume, coupled with the failure to settle below a crucial support level, it could signal a potential reversal.

Platinum Futures: Multiple Timeframe Volume & Price Analysis
Multiple timeframe

By zooming out to higher timeframes, such as the one-hour chart, I gain clarity on the broader market sentiment and can better assess potential trade setups.

This allows me to generate a solid thesis and plan my trades with confidence.

But it’s not just about looking at higher timeframes; it’s about understanding the relationship between volume and price action.

By combining these insights, I can identify key support and resistance levels, gauge market sentiment, and anticipate price movements more accurately.

Understanding volume and price action together is invaluable for intraday traders. It provides a clear roadmap for identifying potential trade setups and managing risk.

So, if you’re serious about improving your intraday trading, consider incorporating multiple timeframe analysis into your strategy. Take the time to analyze higher timeframes alongside shorter ones, and watch how it transforms your trading approach.

It’s your time to shine, learning more about Hawkeye Volume and how it can enhance your trading, CLICK HERE NOW. Feel free to reach out to me or my team at Hawkeye Traders if you have any questions or want to explore our software further.

Remember, trading is all about continuous learning and adaptation. By leveraging the power of multiple timeframe analysis, you can stay one step ahead of the markets and trade with confidence. 

Thanks for tuning in, Click Here to access Volume Mastery NOW

To Your Trading Success,

Anthony Speciale

Hawkeye Traders

P.S. If you’re ready to take your trading to the next level, don’t hesitate to reach out to our team at Hawkeye. We’re here to provide guidance, support, and proven strategies to help you succeed in the market. [email protected]  – OR –  888-233-8598   

Predictable Reversal At Key Support Confirmed By Volume

Predictable Reversal At Key Support Confirmed By Volume

Anthony here at Hawkeye Traders, and today I will focus my intake in a reversal case, delving into a topic that’s absolutely crucial for any trader looking to gain an edge in the market: VOLUME. In this case, identifying volume-driven reversal patterns.

In this in-depth special video, we’re going to explore how you can identify key areas in the market that were previously resistance but have now become newly appointed support. 

Not only that, but we’ll also talk about how you can confirm these areas using volume, providing you with foresight into potential market movements.

Now, you might be wondering, “How exactly do we do this?” Well, fear not, because I’m going to break it all down for you step by step.

First things first, let’s strip away any complexity. When it comes to my trading approach, I keep it simple. I focus solely on volume and price action. 

With these two powerful trading tools at my disposal, I’m able to perform my own analysis and craft a thesis around what I believe is happening in the market.

Here’s the thing: while many indicators out there are lagging, meaning they only provide information after the fact, volume and price action offer a glimpse into future market movements before they even happen. 

That’s the kind of foresight every trader dreams of!

Now, if there’s one specific aspect within volume and price action that I urge you to master, it’s identifying reversals. 

Why? Because nailing reversal patterns with accuracy can lead to incredibly profitable trades.

Let’s dive into a real-world example to illustrate this concept. Take a look at Bank of America (ticker: BAC) on a daily chart spanning approximately six months. What do we see? We see a trend line with multiple touches, indicating significant support.

Predictable Reversal At Key Support Confirmed By Volume
Reversals

But here’s where it gets interesting. Pay close attention to a specific candle marked by ultra-high selling volume. Despite the heavy selling pressure, price pulled back into two critical areas: the lower channel line and previously resistance-now-support levels.

What happened next? Price didn’t plummet as many expected. Instead, it showed resilience, closing well above the lows of the candle. This lack of follow-through on the downside, coupled with absorption of selling volume, signaled a near-perfect reversal.

The result? A rapid ascent back into the upward channel structure, yielding significant gains for savvy traders who recognized the opportunity.

So, why is mastering volume and price action so vital? Because it empowers you to enter trades with the lowest risk and the highest probability of success. 

Whether you’re day trading, swing trading, or position trading, this strategy and our Hawkeye Volume Tools applicable across various timeframes.

Ready to take your trading to the next level? Dive deeper into this theory and explore our Hawkeye trading tools by clicking here now.

Don’t hesitate to reach out to myself or my team with any questions you may have. Together, let’s approach the market with mastery in volume and price action!

To Your Trading Success,

Anthony Speciale

Hawkeye Traders

888-233-8598

Mastering Hawkeye Wide Bar Trading Strategies

Mastering Hawkeye Wide Bar Trading Strategies

Anthony here from Hawkeye Traders, ready to dive deep into the world of wide bar trading strategies. If you’re looking to elevate your trading game and maximize your profits, you’re in the right place.

In this comprehensive guide, I’ll walk you through the power of wide bars and how pairing them with high volume surges can unlock lucrative opportunities in the market. So, grab your favorite trading beverage, sit back, and let’s get started.

Understanding Wide Bars and Volume Surges

Wide bars, those eye-catching purple giants on your chart, often signal significant shifts in market sentiment. Paired with high volume surges, they become even more potent indicators of potential reversals or continuation patterns.

In our proprietary volume software at Hawkeye, we’ve fine-tuned our analysis to pinpoint these wide bars and identify the volume behind them. This allows us to gauge who’s in control of the market and anticipate the next move with precision.

Navigating Economic News Events

Economic news releases can send shockwaves through the market, creating opportunities for savvy traders. However, it’s crucial to approach these events with caution and patience.

I always advise my traders to step back before major news hits, allowing the initial frenzy to settle. Then, we analyze the volume and price action to uncover hidden gems amidst the chaos.

Volume is your Compass to Navigating the Markets

Spotting Reversal Opportunities

When faced with a wide bar and ultra-high volume, it’s essential to assess the context and look for clues of absorption or exhaustion. Neutral volume following a wide bar often signals a potential reversal, as buyers or sellers reach their limits.

By patiently waiting for price action to confirm our suspicions, we position ourselves for optimal entry points with minimal risk. Remember, preservation of capital is paramount, and disciplined risk management is key to long-term success.

Mastering Hawkeye Wide Bar Trading Strategies
Wide Bar

Executing with Precision

Executing a trade requires a delicate balance of analysis and restraint. It’s tempting to chase after every opportunity, but true mastery lies in patience and precision.

Whether you’re longing for a breakout or shorting a reversal, wait for the perfect setup to present itself. Trust your analysis, stick to your trade plan, and never let emotions cloud your judgment.

Add the Hawkeye Wide Bar to your Trading Arsenal

The Power of Patience and Discipline

In the fast-paced world of retail trading, it’s easy to get caught up in the excitement and rush of the market. However, true success comes from a calm and calculated approach.

By mastering wide bar trading strategies and harnessing the insights provided by volume analysis, you can navigate the markets with confidence and clarity. 

Remember, it’s not about hitting home runs every time—it’s about stacking those base hits and growing your account steadily over time.

So, the next time you spot a wide bar on your chart, take a moment to pause, analyze, and execute with precision. With the right mindset and strategy, you can achieve your trading goals and build a sustainable path to success. 

Hawkeye Volume Tools and Trading Mastery Awaits You – Click Here to Learn More

Here’s to profitable trading and disciplined decision-making!


To Your Trading Success,

Anthony Speciale

Hawkeye Traders

P.S. If you’re ready to take your trading to the next level, don’t hesitate to reach out to our team at Hawkeye. We’re here to provide guidance, support, and proven strategies to help you succeed in the market. [email protected]  – OR –  888-233-8598

Hawkeye Volume and Price Action Confirms Break of Range

Hawkeye Volume and Price Action Confirms Break of Range

Anthony here with another insightful discussion on mastering the art of trading by understanding volume and price action.

Whether you’re a seasoned trader or just starting out, grasping this crucial relationship can elevate your trading game to new heights.

Let’s delve into an actual trade setup I had executed and how Hawkeye Volume played a pivotal role in my decision-making process.

First and foremost, it’s essential to recognize that volume can provide valuable insights into market dynamics, regardless of your trading style—be it pullback, breakout, correction, double top, or double bottom trading.

When eyeing a potential trade setup, but before you .dive in, take a step back and assess the volume-price relationship. By pairing volume with price action, you gain a deeper understanding of current market conditions and potential future movements.

Now, I know it’s tempting to clutter your charts with numerous indicators in search of the perfect setup. However, I’ve found that simplicity reigns supreme in trading.

Clean, clutter-free charts with a focus on price and volume are the way to go. Trust me; less is more when it comes to effective analysis.

Let’s walk through a real-life example—a trade I took in the light sweet crude oil market.

Hawkeye Volume and Price Action Confirms Break of Range
Volume and Price Action

As I identified a double top formation and observed price struggling to break above previous highs, followed by a retest of the session low which confirmed ranging.

A surge in selling volume followed by a lack of immediate follow-through caught my eye on the first attempt to break through the session lows.

Interpreting volume alongside price action allowed me to anticipate a potential pullback. 

Instead of chasing after the initial breakdown, I patiently waited for confirmation, ensuring a low-risk, high-probability trade entry.

By understanding the nuances of volume and price action, I pinpointed key levels of support and resistance, guiding my entry and exit points with precision. And guess what? The trade played out exactly as anticipated, delivering profitable results.

Now, you might be wondering, “How can I apply this methodology to my own trading?

Well, it’s simpler than you think!

With the Hawkeye method, you gain access to powerful tools that visualize volume and price action dynamics, making it easier to identify optimal trade setups.

Whether you’re day trading, swing trading, or investing in stocks, futures, forex, or cryptocurrencies, the principles of volume and price action remain consistent.

It’s all about reading the market’s roadmap and making informed decisions based on data-driven insights.

So, if you’re ready to take your trading to the next level, I invite you to explore the Hawkeye method. Click on the link below to access valuable resources and start your journey towards trading mastery.  

ACCESS Hawkeye Tools and Mastery Library NOW

Remember, success in trading isn’t about chasing after the next big thing—it’s about mastering the fundamentals and applying them consistently.

With volume and price action as your guiding lights, the possibilities are endless.

Feel free to reach out to me or my team with any questions or inquiries. We’re here to support you on your trading journey. Until next time, happy trading!

To Your Trading Success,

Anthony Speciale

Hawkeye Traders

888-233-8598

High Volume Price Rotation Offered 120+ Ticks of Profit LIVE

High Volume Price Rotation Offered 120+ Ticks of Profit LIVE

Anthony here, and today I’m excited to walk you through a live analysis breakdown of gold futures trading. Buckle up as we dive into the intricacies of analyzing, interpreting, and executing trades in real-time, focusing on high volume price rotation.

Let’s kick things off by addressing the importance of live trading analysis. 

Unlike hindsight analysis, which is often clouded by 20/20 vision, live trading allows us to witness market movements as they unfold, providing invaluable insights into price action, volume, and market context.

As the trading session begins, I focus my attention on gold futures, my primary market of choice. Armed with nothing but volume and price action data, I delve into the charts, ready to identify opportunities.

In trading, simplicity is key. 

My approach revolves around raw volume and price action analysis, stripped of any unnecessary clutter. By closely monitoring volume spikes and price movements, I gain a deeper understanding of market dynamics and potential trading setups.

Now, let’s get down to brass tacks:

In today’s session, I pinpointed a compelling buying opportunity in gold futures. 

Utilizing a combination of high volume analysis and trendline breakouts, I identified key entry and exit points to capitalize on the market’s movements.

With a clear game plan in mind, I entered the market at a strategic price point, setting my stop-loss and profit targets accordingly. 

As the trade unfolded, I remained disciplined, taking profits strategically and protecting my capital every step of the way.

Trading isn’t just about making money; it’s about discipline, patience, and risk management. 

By adhering to a strict trade plan and focusing on high-probability setups, I maximize my chances of success while minimizing potential losses.

At Hawkeye Traders, we believe in empowering fellow traders with the knowledge and tools they need to succeed.

Whether you’re a seasoned pro or just starting your trading journey, our live analysis sessions offer a wealth of insights to help you navigate the markets with confidence.

As the trading day comes to a close, I reflect on the highs and lows, the wins and losses. 

But above all, I remain committed to my craft, continuously honing my skills and refining my strategies.

So, if you’re ready to take your trading to the next level, I invite you to join us at Hawkeye Traders

With our proven methods and dedicated support, you’ll gain the confidence and expertise needed to thrive in today’s dynamic markets!

Happy Trading,

Anthony Speciale

Hawkeye Traders

Identifying Support and Resistance Incorporating Volume Analysis

Identifying Support and Resistance Incorporating Volume Analysis

Welcome, fellow traders! Today, we’re delving deep into the crucial aspects of identifying support and resistance through the lens of price action and volume analysis. 

Understanding these dynamics is paramount for any trader looking to navigate the markets with confidence and precision. So, let’s embark on this journey together and uncover the hidden secrets that can elevate your trading game to new heights.

In the world of trading, having a keen sense of market context is akin to possessing a treasure map. It guides us through the labyrinth of price movements and helps us anticipate potential shifts in supply and demand. 

As I demonstrated live this morning, our journey began with a careful examination of candlestick patterns and volume dynamics. 

By identifying key areas of high volume and discerning the lack of follow-through, we laid the groundwork for our analysis.

The cornerstone of our strategy lies in pinpointing areas of support and resistance, also known as supply and demand zones by incorporating Hawkeye Volume Analysis. 

These zones act as battlegrounds where buyers and sellers wage their wars, leaving behind valuable clues for astute traders. 

Through meticulous observation of price action and volume, we identified significant turning points in the market. 

Whether it was the rejection of higher prices or the emergence of strong buying pressure, each candle told a story of market sentiment and potential reversals.

One of the most rewarding aspects of trading is capturing trend reversals before they unfold. By honing our ability to read the signs of impending shifts in momentum, we position ourselves for lucrative opportunities. 

As I illustrated with real-time examples, our analysis allowed us to anticipate reversals with remarkable accuracy. 

From identifying lower highs to recognizing signs of exhaustion in selling pressure, every observation paved the way for strategic decision-making.

Trading isn’t just about identifying entry points; it’s also about managing risk and maximizing profit potential. 

Through disciplined risk management techniques, we ensure that our trades offer attractive risk-to-reward ratios. 

As I showcased in today’s session, our approach allowed us to capture significant profit opportunities while minimizing downside risk. 

By adhering to strict risk parameters and capitalizing on high-probability setups, we create a recipe for consistent success in the markets.

At the heart of our trading philosophy lies a deep appreciation for Hawkeye Volume and Price Action Tools. These pillars provide us with invaluable insights into market dynamics, allowing us to stay one step ahead of the crowd. 

As I emphasized throughout the session, cluttering our charts with unnecessary indicators only obscures the true story unfolding before us. By keeping our analysis simple and focused, we gain clarity and confidence in our trading decisions.

Mastering the art of identifying support and resistance requires a keen understanding of volume and price action. By learning to decipher market context and spot key turning points, we empower ourselves to trade with precision and foresight. 

As demonstrated in today’s session, the ability to read the language of the market can lead to lucrative opportunities and consistent profits. 

So, fellow traders, embrace the power of volume and price action, and let’s chart a course towards trading excellence together.  Access the Hawkeye Community of Traders NOW

Happy Trading,

Anthony Speciale

Hawkeye Traders

Market Context, Price Action and Volume – That’s ALL You Need

Market Context, Price Action and Volume - That's ALL You Need

Welcome back, traders! In this insightful discussion, we’re diving deep into the world of price action and volume surges and unraveling the mysteries of how they impact the market. 

Whether you’re a seasoned trader or just starting out, understanding volume surges can provide you with invaluable insights to make informed trading decisions. 

So, let’s embark on this journey together and discover how you can harness the power of volume to enhance your trading strategies.

Volume surges are like whispers from the market, revealing hidden truths about price movements and market sentiment. 

As Anthony from Hawkeye Traders eloquently explains, these surges can occur at various points in the market – highs, lows, or even amidst a trend. 

But what do they signify, and how can you interpret them effectively?

Context is Key: Anthony emphasizes the importance of understanding market context. It’s not just about the volume bars or candlestick patterns; it’s about comprehending the story that the market is telling you. By analyzing the broader picture, including price action and prevailing trends, you can gain valuable insights into the underlying dynamics driving the market.

Intraday Analysis: Anthony provides a real-time analysis of overnight trading sessions, shedding light on how traders can capitalize on volume surges during non-standard market hours. Whether you’re trading before or after your day job, understanding volume dynamics can help you navigate these sessions with confidence and precision.

Identifying Market Reversals: One of the most compelling aspects of volume surges is their ability to signal potential market reversals. Anthony illustrates this concept with examples of price action at key resistance and support levels. By observing how volume interacts with these levels, traders can anticipate trend reversals and adjust their strategies accordingly.

The Psychology of Buyers and Sellers: At its core, trading is a battle between buyers and sellers. Volume surges offer valuable insights into the psychology of market participants. Anthony delves into the nuances of interpreting buying and selling pressure, highlighting how shifts in volume can reveal the underlying intentions of traders. 

Simplicity in Complexity: In a cluttered world of trading indicators and tools, Anthony advocates for simplicity. By focusing on the essentials – price action and volume – traders can cut through the noise and develop a clearer understanding of market dynamics. Less is indeed more when it comes to effective trading analysis.

As Anthony eloquently demonstrates, mastering volume surges is not just about crunching numbers or following complex algorithms. It’s about deciphering the language of the market and understanding the subtle cues that drive price movements. 

Whether you’re a novice trader or a seasoned veteran, integrating volume analysis into your trading toolkit can elevate your performance to new heights.

So, if you’re ready to unlock the secrets of volume surges and revolutionize your trading approach, dive into the wealth of knowledge offered by Hawkeye Traders. 

With access to powerful tools and expert guidance, you’ll be equipped to navigate the markets with confidence and precision. 

CLICK HERE to embark on your journey to volume trading mastery.

Remember, the path to success begins with knowledge and ends with action.

Take the first step today and embark on your journey to trading excellence with Hawkeye Traders. Godspeed, traders, and may the markets be ever in your favor!

Happy Trading,

Anthony Speciale

Hawkeye Traders

Nailing (2) GOLD Volume Climax Reversals LIVE

Nailing (2) GOLD Volume Climax Reversals LIVE

Anthony here from Hawkeye Traders, and I’ve got something special to share with you today. In this video, I’m going to walk you through how you could have absolutely dominated the gold market, based on volume.

Guess what? It’s NOT hindsight—it’s real-time analysis, right before your eyes.

So, what’s the secret sauce? It all comes down to one simple yet powerful principle: pairing volume and price action using the Hawkeye tools. That’s right—no clutter, no unnecessary indicators, just pure, unadulterated data that actually matters.

Let’s break it down step by step. Picture this: a double top forms early in the morning, setting the stage for a potential sell-off. But here’s where it gets interesting.

Nailing (2) GOLD Volume Climax Reversals LIVE
Volume

By analyzing the volume alongside price action, I identified a critical volume climax that signaled an imminent pullback. And guess what? That’s exactly what happened.

Price respected prior resistance, now turned support, delivering a tidy profit of 60 ticks.

But wait, there’s more. Just when you thought it couldn’t get any better, gold makes another grand gesture attempt to go higher.

And once again, we spot an ultra-high buying volume, hinting at a potential reversal.

With surgical precision, we enter the trade, targeting the same support level as before. And wouldn’t you know it? Another 90 ticks in the bag, bringing our total profit potential to a whopping 150 ticks.

Now, here’s the kicker. We only risked 20 ticks on each trade. That’s right—150 ticks of profit with just a total of 40 ticks of risk. Talk about a stellar risk-reward ratio!

But here’s the real takeaway: trading isn’t about chasing every little nuance in the market. It’s about waiting for the highest quality setups and executing them with confidence. And that’s exactly what the Hawkeye Volume Tools empower you to do.

By focusing on volume and price action, you cut through the noise and zero in on the most lucrative opportunities. No guesswork, no second-guessing—just pure, raw, data-driven precision analysis.

So, if you’re ready to take your trading to the next level, I invite you to explore the Hawkeye tools and educational resources. Whether you’re a seasoned pro or just starting out, we’re here to help you navigate the markets with confidence and clarity.

Thanks for watching, and until next time, may the markets trend in your favor!

Happy Trading,

Anthony Speciale

Hawkeye Traders

Deciphering Apple’s Massive Gap

Deciphering Apple's Massive Gap

In today’s market analysis, we’re diving deep into the whirlwind of events surrounding Apple’s recent earnings report. Anthony Speo here, your guide through the twists and turns of market volatility.

So, what’s the buzz all about?

Well, Apple made headlines with a colossal gap up following its earnings report, sending shockwaves through the trading community. 

But what does this mean for retail traders like us? Let’s break it down:

First off, let’s talk numbers. Apple’s gap up was undeniably impressive, but what caught our attention was where it gapped to—a prior daily gap that had yet to be filled.

Now, that’s not your run-of-the-mill move. We’re talking about a gap that barely saw 35 cents of follow-through from its opening price to its daily high. That’s a red flag waving in the wind, signaling potential weakness in Apple’s upward momentum.

But wait, there’s more. Amidst the flurry of activity, we witnessed something truly remarkable—the largest peak in volume year-to-date.

Now, you might be thinking, “Volume? What’s the big deal?”

Well, my friend, volume is the heartbeat of the market. It tells us the story of buyers and sellers battling it out for supremacy.

And here’s the kicker: despite the surge in volume, Apple’s price action left much to be desired. The closing price fell significantly lower than its initial spike, hinting at underlying weakness beneath the surface.

Deciphering Apple's Massive Gap

So, where does this leave us as traders?

Well, Anthony’s keen insights shed light on the path ahead. While Apple’s gap up may have grabbed headlines, it also presents a unique opportunity for astute traders.

By understanding the nuances of volume and price action, you can decipher the market’s hidden clues and make informed decisions.

Now, let’s talk about strategy. Whether Apple continues its ascent or faces a pullback, one thing remains clear: volume and price action should be our guiding stars.

Forget fancy indicators and complex algorithms—success in trading boils down to mastering these fundamental principles.

As Anthony rightly emphasizes, a strong foundation in volume and price action is the bedrock of any successful trading plan and the very thing we can help you master! 

So, whether you’re a seasoned pro or just starting out, remember this: the key to trading success lies in understanding the language of the market.

Apple’s massive gap may have turned heads, but it’s our interpretation of VOLUME and PRICE ACTION that sets us apart at Hawkeye Traders.

Happy Trading,

Anthony Speciale

Hawkeye Traders

Mastering Multiple Timeframe Volume Analysis

Mastering Multiple Timeframe Volume Analysis

Hey Trader, in this video we delve into the depths of multiple timeframe volume analysis. We’ll further explore the significance of volume confluence across different timeframes and how it can revolutionize your trading strategy.

Understanding Volume Confluence

At Hawkeye Traders, we emphasize the importance of looking at the bigger picture when analyzing volume. 

It’s not just about a single day of ultra-high buying or selling volume; it’s about zooming out and examining the broader trends over weeks and months. 

By doing so, we gain invaluable insights into market dynamics, identifying key areas of support and resistance that can shape our trading decisions.

The Power of Weekly Analysis

Let’s start our journey by examining a weekly chart of Nvidia (ticker: NVDA). 

Each candle represents a week’s worth of trading activity, providing a panoramic view of market movements. 

As we analyze high-volume areas, such as significant selling points, we uncover valuable insights into price behavior. 

For example, identifying a candle with ultra-high selling volume that acts as resistance for several months can signal a potential reversal or continuation pattern.

Mastering Multiple Timeframe Volume Analysis

Zooming into Daily Charts

Transitioning to daily charts, we narrow our focus to individual trading sessions, seeking confirmation of our weekly analysis. 

By pinpointing days with significant volume spikes, we can gauge market sentiment and anticipate price movements. For instance, observing decreased buying volume amidst multiple attempts to overcome a resistance level hints at impending bearish pressure. 

Such insights empower traders to execute high-probability trades with confidence, leveraging options or other instruments for lucrative returns.

Applying Low-Risk Trade Strategies

One of the key benefits of multiple timeframe volume analysis is its ability to identify low-risk trade setups. 

By aligning entry and exit points with volume signals, traders can minimize risk while maximizing potential profits. 

For example, entering a short position based on a failed breakout candle with decreased buying volume offers a favorable risk-reward ratio. 

Targeting recent lows as potential profit-taking levels further enhances the trade’s viability, ensuring a disciplined approach to risk management.

Leveraging Hawkeye Tools

Central to our trading methodology are the Hawkeye tools, meticulously designed to streamline volume and price action analysis for you. 

These tools provide traders with a clear, clutter-free charting experience, enabling them to focus on what truly matters: understanding market dynamics. 

Whether you’re a day trader, swing trader, or position trader, Hawkeye Volume equips you with the essential tools to navigate diverse market conditions with precision.

Empowering Your Trading Journey

Mastering multiple timeframe volume analysis is a game-changer for retail traders. 

By harnessing the power of volume confluence across different timeframes, traders can gain a comprehensive understanding of market trends and dynamics. 

With Hawkeye Volume as your ally, you’ll embark on a journey of clarity and confidence in your trading decisions, paving the way for consistent profitability and success.

Ready to elevate your trading to new heights? 

Explore the Hawkeye Volume Package today and unlock the secrets of volume analysis that can transform your trading journey. Remember, the path to success begins with a deeper understanding of volume and price action—let Hawkeye be your guide.

For more insights and personalized guidance on mastering volume analysis, don’t hesitate to reach out to our dedicated team. Your success is our priority, and we’re here to support you every step of the way.  [email protected]  or 888-233-8598

Happy trading, and may the charts be ever in your favor!


To Your Success,

Anthony Speciale

Hawkeye Traders

Revealed: The Only Path To Trading Success

Revealed: The Only Path To Trading Success

In the dynamic world of trading, success often hinges on the ability to decipher the intricate dance between volume and price action. 

Seasoned traders understand that mastering this relationship is not just advantageous – it’s essential for consistent profitability. 

In this blog post, we’ll delve deeper into the insights shared by Anthony from Hawkeye Traders in his enlightening video on the US Dollar Index Futures, exploring how retail traders can leverage these principles to their advantage using Hawkeye Trading tools.

The Foundation of Trading

At the heart of every successful trade lies a deep understanding of volume and price action. As Anthony emphasizes in his video, these two components are intertwined in a complex yet predictable manner. 

By studying the interaction between volume and price action, traders can gain valuable insights into market dynamics, identify trend reversals, and anticipate potential price movements with remarkable accuracy.

A Game-Changing Skill

One of the key takeaways from Anthony’s analysis is the importance of identifying highs and lows in the market. 

By carefully analyzing volume and price action, traders can pinpoint climax points, topping patterns, and trend exhaustion, providing valuable opportunities for profitable trades. 

Anthony’s demonstration of how to recognize these critical points in the US Dollar Index Futures serves as a powerful example of how mastering this skill can lead you to trading success.

Empowering Retail Traders For Decades With Hawkeye Volume Tools

While understanding the relationship between volume and price action is paramount, having the right tools can make all the difference. 

Hawkeye Traders offers a range of proprietary indicators designed to help retail traders navigate the markets with confidence. 

From volume-based indicators to price action analysis tools, Hawkeye provides the resources traders need to make informed decisions and execute winning trades.

Revealed: The Only Path To Trading Success

Taking Your Trading to the Next Level

Whether you’re a novice trader looking to build a solid foundation or an experienced investor seeking to refine your skills, mastering volume and price action is essential. 

With Hawkeye Volume Trading tools at your disposal, you can gain a deeper understanding of market dynamics, identify high-probability trading opportunities, and ultimately, achieve greater success in your trading endeavors.

Don’t Trade Another Day Without Watching This Crucial Training Video

Mastering volume and price action is the key to unlocking consistent trading success. 

By employing the insights shared by Anthony from Hawkeye Traders and leveraging Hawkeye Trading tools, retail traders can empower themselves to make smarter, more informed trading decisions. 

Whether you’re trading stocks, futures, forex, or crypto, the principles of volume and price action remain the same – and with Hawkeye Volume Tools by your side, you’ll be well-equipped to navigate the markets with confidence.

Ready to take your trading to the next level? Watch Anthony’s in depth training video, explore Hawkeye Trading tools, and embark on your journey to trading mastery today.


To Your Trading Success,

Anthony Speciale

Hawkeye Traders

Volume Reversal: Trading Essentials You Can’t Afford to Be Without

Volume Reversal: Trading Essentials You Can’t Afford to Be Without

In the world of trading, success often hinges on the ability to interpret market movements accurately. 

While many factors influence price action, one fundamental element stands out: volume. The most essential tool for traders looking to navigate the markets.

At Hawkeye, we believe in empowering traders with both the knowledge and tools they need to succeed. 

Volume reversal and price action serve as the cornerstone of all successful trading strategies. 

Volume represents the number of shares or contracts traded within a specific time frame, providing valuable insights into market dynamics. 

By analyzing volume alongside price movements, traders can gain a deeper understanding of market sentiment and potential trends. 

Price action, on the other hand, refers to the movement of security prices over time. 

By studying price action patterns, including those that indicate volume reversals, traders can identify key support and resistance levels, trend reversals, and potential breakout opportunities.

When combined with volume analysis, price action becomes even more powerful, offering traders a comprehensive view of market activity.

Volume Reversal: Trading Essentials You Can’t Afford to Be Without
Volume Reversal

At Hawkeye, we’ve developed a range of volume-based indicators designed to enhance your trading experience. These indicators leverage the power of volume analysis to help provide you with actionable insights into market trends and momentum. 

Whether you’re a day trader, swing trader, or long-term investor, our volume-based indicators can help you make informed trading decisions. 

Never trade without the foresight of volume again.

From identifying trend reversals to spotting entry and exit points, these tools are invaluable for traders at every level.

Benefits of Hawkeye’s Volume-Based Indicators:

  • Enhanced Market Analysis: Our volume-based indicators offer a deeper understanding of market dynamics, including volume reversals, allowing you to make more informed trading decisions.
  • Improved Timing: By analyzing volume alongside price action, our indicators help you identify optimal entry and exit points with greater precision.
  • Increased Confidence: With access to real-time market data and advanced analytics, you’ll trade with confidence, knowing you have the tools to succeed.

By harnessing the power of volume-based indicators, you can gain a competitive edge and take your trading to new heights. Whether you’re a seasoned trader or just starting out, our proprietary tools are designed to help you achieve your financial goals.

Ready to elevate your trading game? Explore our proprietary volume-based indicators today and unlock the potential of your trading journey. 

Remember, at Hawkeye, your success is our success. Start trading smarter with our volume-based indicators and experience the difference for yourself.

Happy Trading,

Anthony Speciale

Volume Climax: Essential Techniques for Spotting Market Turns

Essential Techniques for Spotting Market Turns


TO SEE A MORE DETAILED TRAINING CLICK HERE

Every trader seeks the edge that will enhance their market success, and one of the most effective ways to achieve this is by mastering volume analysis. 

Understanding volume climaxes can dramatically improve your ability to pinpoint market highs and lows, providing you with the confidence to make well-timed trades. 

In our latest training video, we dive deep into this technique using a real-time example from today’s Gold Futures market.

Why Volume Climaxes Are Key:

A volume climax can be a critical indicator in trading, often signaling a potential reversal in the market. 

These climaxes occur when there is a sudden and significant increase or decrease in volume, indicating that the current trend may be reaching its peak strength and could soon exhaust. 

Recognizing these moments allows traders to anticipate market downturns or rallies, providing a strategic advantage in entering or exiting trades.

In the video above, I analyze a specific instance in the Gold Futures market where a significant high was identified and subsequently followed by a decline. 

This scenario illustrates:

  • The Role of Decreasing Volume: Just as the market reached a session high, the volume significantly dropped compared to the previous four candles. This decrease is a classic signal that the high might fail.
  • Practical Application: You’ll see how this information could have been used to predict a drop of approximately 126 ticks in Gold, translating into a significant potential gain per contract.
Essential Techniques for Spotting Market Turns
Volume Climax

By understanding the signs of a volume climax, you not only avoid common pitfalls that many traders fall into but also enhance your potential for making profitable trades. 

This video is not just about theory; it’s a practical guide that:

  • Enhances Decision Making: Learn to make informed decisions based on the analysis of volume trends.
  • Improves Trade Timing: Better timing for entering and exiting trades can significantly increase your trading efficiency and profitability.

Watch a more detailed training here and Learn the secrets that only the most profitable traders know

Don’t miss this opportunity to refine your trading strategy with our expert insights into volume climaxes and start applying these techniques to your trading. 

Understanding the ‘when, where, why, and how’ of volume climaxes will empower you to execute more successful trades and build a more robust trading plan.

It’s time to take your trading to the next level! Watch a more detailed training video by clicking the link below and gain the confidence to identify and act on crucial market signals. 

You can’t afford to let another profitable volume-based opportunity pass you by

For any queries or further discussion, feel free to contact us through the details provided below the video. 

Don’t forget to like, subscribe, and comment to stay updated with our latest trading insights!

Happy Trading,

Anthony Speciale

Hawkeye Traders

Netflix in Elon Musk’s crosshairs means opportunity

Today I want to share with you a groundbreaking technology that would have gotten you into Netflix in December turning every $1,000 you invested into $11,160

The great thing is we’re seeing another setup that could be even bigger.

But first, let’s talk about Netflix.

Last week Netflix’s stock price crashed.

For the first time in ten years, the company lost subscribers.

The CEO blames the loss on password-sharing and the economy.

Maybe, but many think there is a bigger issue at play.

Elon Musk put it best, “The woke mind virus is making Netflix unwatchable.”

His tweet says what many are thinking.

Netflix thinks it’s more important to spread woke ideas than to make good content. People hate that the company has canceled good shows, or changed them, to push some leftist agenda.

This may work for getting praise on social media. But, it doesn’t help make better content and shareholders are responding with their wallet.

It’s not surprising that Netflix is losing subscribers. And it’s not surprising that their share price is crashing.

But, knowing why the price is dropping in hindsight doesn’t make you money.

It’s all about knowing before it happens and Hawkeye users have known the drop in Netflix’s share price was coming since December!

When our algorithm turns all red it’s time to sell.

And if you had known, you could have made a whopping 1116% trading the netflix 55.5, 6 month 30 delta put!

Hawkeye enables you to see what the big players are doing in real time.

These are the guys that make things happen. They make up most of the market. And when their money moves, the market moves. And with Hawkeye, you can follow their money and line your pockets.

In fact, there are several opportunities shaping up as I write this.

So click over to learn how you can get access to the Hawkeye Software and capitalize on the next big move.

Click here to see how you can get in before the next big move (hint, it’s happening now).

Don’t do THIS with Tesla’s stock!

I’ve got something very important to tell you about…

Everyone’s talking about Tesla right now, and most people are dead WRONG!

If you’ve been thinking about trading Tesla, or are looking into it…

Please watch today’s training before you do anything!

But that’s not all I talk about in the training..

Nooo, this one is packed!!

We’re also going to cover some trade ideas the Hawkeye Scanner has presented for the week ahead and how to have conviction of when and where to buy.

Want to use the Hawkeye Methodology to find trades like these? Click right here!

[sg_popup id=13743]