Today, let’s dive into the opening bell of the S&P 500 and uncover the critical insights from the market’s initial movements.
As a live trader of the futures market, I want to walk you through what I observed, how it unfolded, and what it means for your trading strategy.
Key Observations at the Opening Bell
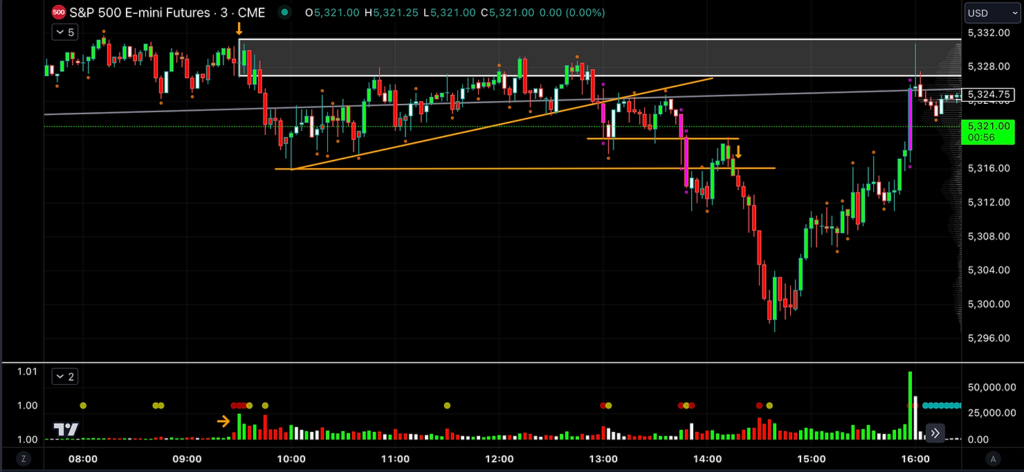
Time of Focus: 9:30 AM EST The U.S. session kicks off at 9:30 AM EST.
At this precise moment, we witnessed a notable candle with ultra-high buying volume. Let’s break down why this is important and how it set the tone for the day . . .
Ultra-High Buying Volume:
- At 9:30 AM, the market printed the highest buying volume candle of the session, surpassing even the overnight activity. This candle opened and closed at the same price, indicating significant buying pressure without any price advancement. This is a red flag signaling potential resistance.
Market Reaction:
- Post 9:30 AM, the market failed to push higher despite the buying volume, indicating resistance. The area around this candle’s wick became a strong supply zone, tested multiple times throughout the day, but never breached.
ADD Hawkeye Volume, Volume Radar, Volume Paintbar and Wide Bar to your charts NOW!
Interpreting the Data
Understanding such market behavior can help you make informed trading decisions. Here’s a step-by-step breakdown:
Resistance Identification:
- The 9:30 AM candle created a clear resistance level. The market’s inability to move above this point despite high buying volume suggested downward pressure.
Trend Line Analysis:
- Drawing a trend line from the session’s 10am low through subsequent lows provided additional confirmation. The market tested this trend line multiple times before breaking it and retesting it as resistance, further confirming the bearish trend.
Volume and Price Action:
- Combining volume indicators with price action helps in identifying significant market movements. The failure to break above the 9:30 AM high volume candle, followed by a break and retest of the trend line, set the stage for a bearish continuation.
Practical Application
As a retail trader, here’s how you can apply these insights:
Watch Key Candles:
- Pay attention to high volume candles at market opens. These high volume candles often set the tone for the day and indicate critical support or resistance levels.
Use Trend Lines:
- Draw trend lines to track the market’s direction. A break and retest of these lines can signal entry and exit points.
Combine Volume with Price Action:
- High volume candles without price movement often indicate resistance or support. Use volume analysis alongside price action to confirm market sentiment.
By understanding and analyzing how high volume candles and price action interact with one another, you can develop a more robust trading strategy.
The key is to recognize significant volume spikes and how the market reacts to them.
Ready to dive deeper into these concepts, our Hawkeye Volume and Price Action Mastery Library is a resource I couldn’t imagine trading without!
Happy Trading,
Anthony Speciale
Hawkeye Traders
Big Energy Profits
