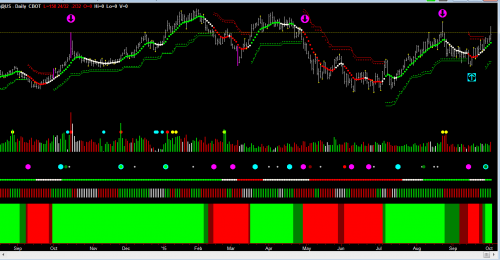
Today was the first day in almost two months that the US Bonds are trying to break out.
Lets take a look at the US Bonds daily chart.
The cyan arrow points to where the market had a false break to the downside on September 15, but has since rallied .
Today, the Bonds are rallying due to weak economic information. Ideally, you would want to see the Bonds having a strong close in order to confirm a break of the dotted line 161-17. And on Monday a continuation of the rally with no part of the bar straddling the yellow dotted line.
The market is in an uptrend. However the resistance line (the yellow dotted line) has been tested multiple times (indicated by the magenta arrows), and the market appears to struggle around this price point.
So be patient.
We teach you how to get the best out of Hawkeye at our London Seminar on October 18/19 2015. You can find out more here
So, I cannot encourage you enough to come along to the Wednesday room.
Click Here To Reserve Your FREE Seat
Good fortune,
Nigel
Please contact us at [email protected] for any questions you might have about using Hawkeye Indicators in your trading!
[The cyan and magenta arrows are included for illustration only and do not form part of the software]


