In this week’s newsletter, let’s take a look at GDX, otherwise known by its full name, the Market Vectors Gold Miners ETF.
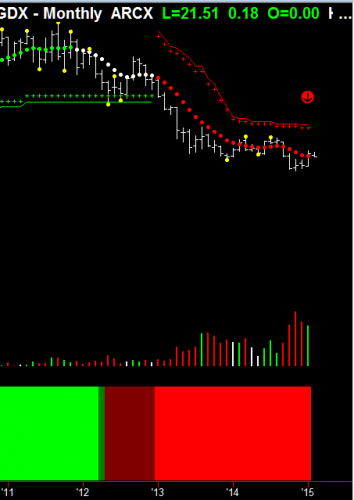
Let’s begin with the monthly chart below. As you can see, we’re in a solid downtrend. We did have some buying that came in last month, that showed in the weekly and daily charts, but it was a high risk entry, as the monthly was still down, and it’s still heading down, as I’m showing with the red arrow.
Now, let’s continue with the weekly chart below. As you can see, there was a rally on the weekly, and it went right up to the Hawkeye stops, which showed great support and resistance. Note how it went right up to where I put the red arrow above the trend stops.
It also placed an isolated high there, so we are expecting a reversal back down. Now, if you look at the volume (which I have put a red arrow over), you can see there was some green volume, but it was average volume all the way up. And, it wasn’t high enough to get through the Hawkeye stop area.
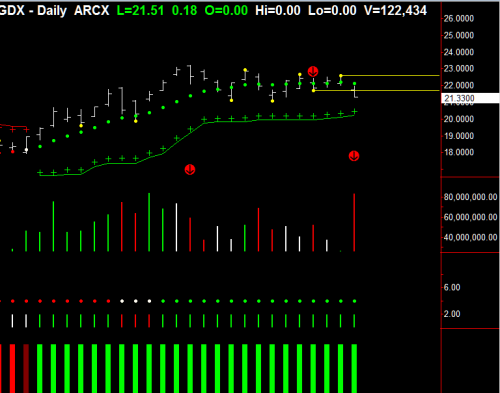
Now, if we look at the daily chart below, you can see that the two arrows that I placed above the Hawkeye volume show classic topping distribution volume: selling, selling, no demand, a little bit of buying, selling, no demand, no demand, etc.
And you can also see that the Hawkeye trend dots have gone flat, which means we have entered congestion. Now, I want you to notice how I’ve drawn the line off the last Hawkeye pivot low, and how the price on Friday broke through there and closed quite convincingly underneath it on high-volume.
So, one would expect there would be a reversal back into this downtrend of the monthly. The weekly should resort back into its downtrend, and the daily should come out of congestion to the downside.
So, this is a classic example of great topping volume and a rally within a downtrend up to the Hawkeye stops, on a weekly that showed exactly where the market should turn off an isolated high.
Finally, I would like to comment on my article from last week about Apple, where I was saying that it would really struggle to get through the isolated high. That is exactly what happened this week. Take a look at the chart below. See how it went up and tested it four times, and retreated each time on declining volume?
Without a doubt, this week is a very important week to see what happens with Apple.
Until next time . .
Good Trading!
Nigel Hawkes
We teach this and many other methods in our live training room held every Wednesday. Click this link for more information or to join us in class.
Please contact us at [email protected] for any questions you might have about using Hawkeye Indicators in your trading!
[The red arrows are for illustration only and do not form part of the software]


AAPL tested the high four times and then broke out and gaped up three days in a row making new 52 week highs. Did the indicators signal a buy sign?
Absolutely. Huge weekly buying volume came in prior to the break above 120 and the blow-out news announcement.