How a Potential Reversal Led Me to Flip My Position

Join countless traders worldwide who use
the Hawkeye algorithms day in and day out to gain a powerful edge

How a Potential Reversal Led Me to Flip My Position

Why I Reversed My LONG Position When This Happened And How to Predict A Potential Reversal

Anthony Speciale here with Hawkeye Traders. I hope you’re having a wonderful day.

In today’s fast-paced trading environment, making informed decisions is crucial.

As retail traders, our success often hinges on our ability to analyze market movements and act swiftly based on reliable data.

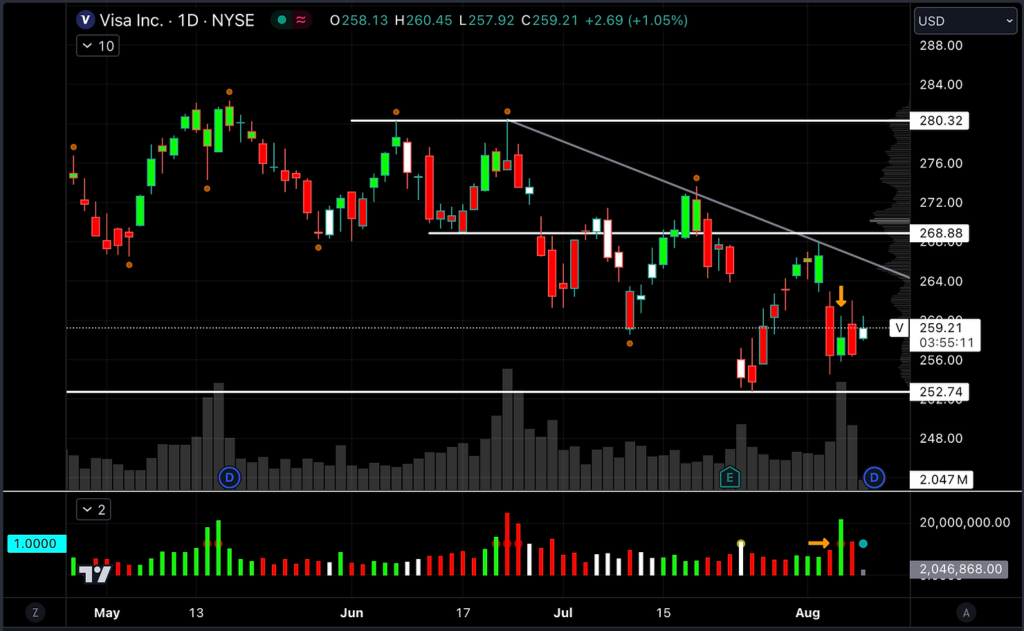
One of the most powerful tools in our arsenal is the relationship between volume and price action, a concept that can often be the difference between a profitable trade and a costly mistake.

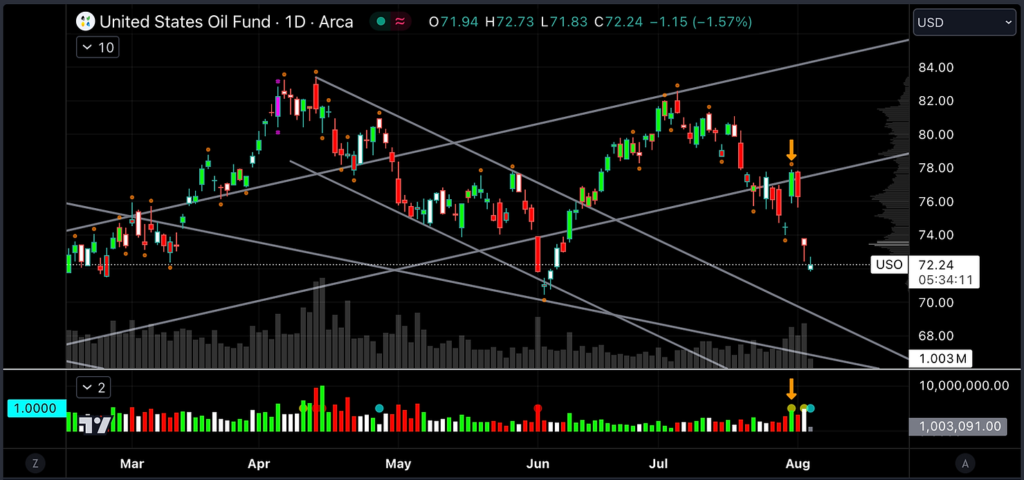
In a recent session, I found myself navigating the complex waters of crude oil trading, and I want to share a pivotal moment with you—a moment that underscored the importance of understanding volume and price action.

The Trade: A Real-Time Decision

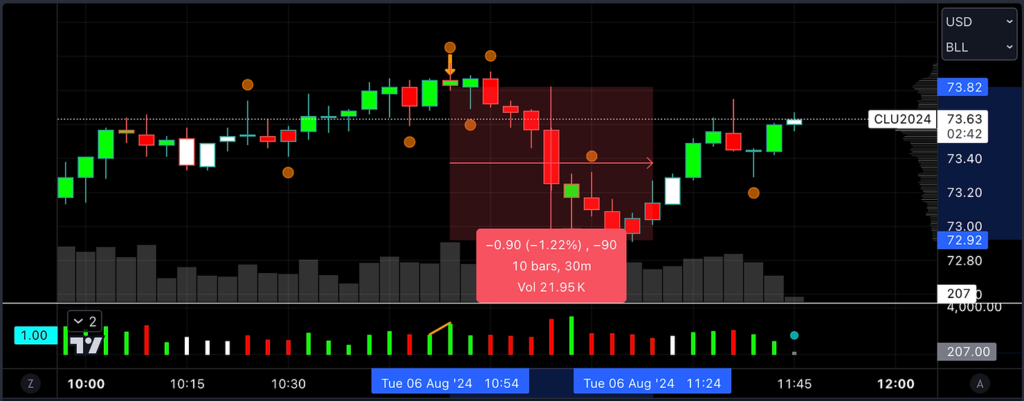
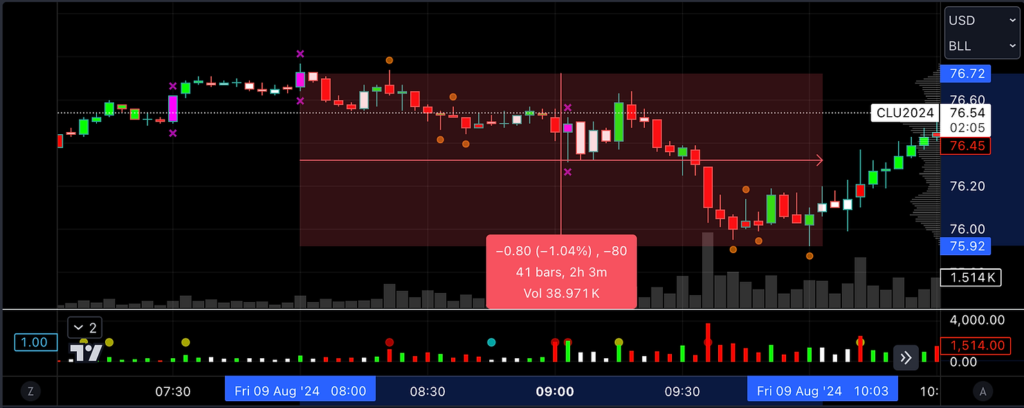
Let’s set the scene: It was a typical trading day, and I was closely watching the Light Sweet Crude Oil futures on a three-minute chart.

The market had been in a moderate uptrend, marked by higher lows and a gradual increase in price. However, something caught my eye around 8:00 AM.

After a significant push upwards around 7:30 AM with minimal follow-through, the market made another aggressive push at 8:00 AM.

Initially, I was long, anticipating continued upward momentum. But as I observed the candles, something didn’t sit right with me.

The candle that formed at 8:00 AM opened near its low and closed near its high, typically a bullish sign.

However, the subsequent candle failed to follow through despite a surge in buying volume.This discrepancy between the volume surge and the lack of price movement rang alarm bells.

It was a classic sign of potential reversal—a situation where buying volume spikes but fails to drive prices higher, often indicating that buyers are running out of steam.

The Reversal: Acting on the Signs

Recognizing the potential for a reversal, I made a swift decision to reverse my long position and go short. The reasoning was simple: if the market couldn’t sustain its upward momentum despite high buying volume, a downside move was likely.

I placed my stop just above the candle that had triggered my decision, minimizing my risk.

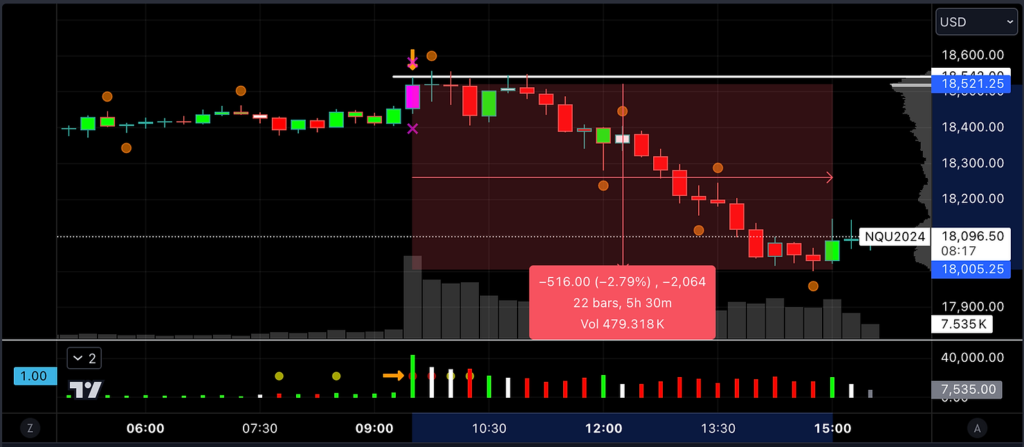
The market soon confirmed my suspicion. We saw a sharp move to the downside, a retest that failed, and then the market continued to sell off.

In a short span, crude oil futures dropped by 70 to 80 ticks—a substantial move for an intraday trade. This wasn’t just a lucky call.

It was a calculated decision based on the interaction between volume and price action—one of the most reliable indicators in trading.

potential reversal

Why Volume and Price Action Matter

You might wonder why I emphasize volume and price action so much.

The answer is straightforward: these are the only real-time indicators that reflect the market’s intentions.

While many traders rely on lagging indicators that tell you what has already happened, volume and price action offer a glimpse into what is happening right now—and what might happen next.

By mastering the relationship between these two factors, you can start to see the market’s moves before they happen.

You’ll be able to spot potential reversals, identify exhaustion points, and make more informed trading decisions.

Join Me for a Deeper Dive

If you’re serious about improving your trading skills, I invite you to join me for an in-depth training webinar.

We’ll explore the concept of volume and price action across multiple asset classes and timeframes, helping you apply these principles to your own trading.

During the webinar, I’ll show you how to set up the Hawkeye Volume Indicators on your trading platform, and my team will assist you in getting everything running smoothly.

Plus, you’ll gain access to the Hawkeye Volume Mastery Series, allowing you to continue your education at your own pace.

This is more than just a webinar—it’s a chance to transform your trading approach by focusing on what really matters.

Volume and price action are the keys to unlocking the market’s intentions, and I’m excited to help you discover them.

Click the link below to join the training webinar. I look forward to seeing you there!

Join the Webinar

Don’t miss this opportunity to deepen your understanding of the market and improve your trading skills. Join me in the training webinar by clicking the link below.

I look forward to seeing you there and helping you take your trading to the next level!

Happy Trading,

Anthony Speciale

Hawkeye Traders

Big Energy Profits

Visa’s Price Holding at Significant Prior High

significant prior high

Visa Currently Holding Significant Prior High As Support

Anthony Speciale here with Hawkeye Traders. I hope you’re having a wonderful day.

Today, we’re going to take a deep dive into Visa (V) and analyze its recent price action.

This is particularly relevant for those of you trading stocks or options, as understanding the nuances of volume and price action can significantly impact your trading decisions.

JOIN THE TRAINING WEBINAR NOW

A Close Look at Recent Price Action

We’re looking at Visa on a daily chart on the NYSE, where we’ve observed a recent surge in buying volume with a concerning lack of follow-through.

This raises the question: is Visa poised for a deeper correction, or could we be seeing the start of a new trend? Let’s explore this further.

When we zoom out to get a broader picture, we see that Visa put in a low back in October 2022 and has rallied since then, breaking above its significant prior high.

However, this is where things get interesting. Visa is now sitting on that previous high, a key area that could dictate its next move.

Understanding Volume and Price Action

On a weekly chart, we can see that Visa has had periods of significant buying volume followed by immediate failures, as well as surges in selling that led to consolidation and lower pushes.

But the daily chart provides even more clarity.

significant prior high

The candle from Tuesday, August 6th, is particularly noteworthy.

Despite the surge in buying volume, the price did not manage to do anything significantly productive.

In fact, the price closed within the lower 50% of the overall candle, which is a sign of weakness rather than strength.

This pattern suggests a potential downward trend.

We’ve seen lower lows and lower highs forming, and the price action is showing signs of a bearish continuation.

This is a concerning signal for those who are long on Visa, as it could indicate that the recent buying was merely a short-lived attempt to exit positions rather than a genuine bullish push.

Key Levels to Watch

We’re currently observing a fairly firm downward trend line on the daily chart.

Visa has touched this trend line a few times, and it seems to be holding as a significant area of resistance.

If Visa continues to struggle at these levels, it could lead to further downside.

In the event of a breakdown, we could see Visa dropping back to test significant prior highs and lows, with a triple bottom just below $228 being a key area of interest.

If the buying volume we’ve seen recently fails to push the price higher, it might simply be short-covering rather than the start of a new uptrend.

What This Means for Traders

For stock and options traders, understanding the relationship between volume and price action is crucial.

It’s not just about what the price is doing, but why it’s doing it.

The lack of follow-through on significant buying volume is a red flag that suggests potential downside risks.

This analysis isn’t just for Visa; it applies across all asset classes and time frames.

The relationship between volume and price action is a universal concept that every trader should understand.

Join Me for a Deeper Dive

If you find this analysis valuable and want to learn more about how to use volume and price action in your trading, I’d like to invite you to a special training webinar.

In this webinar, we’ll dive deeper into these concepts, explore multiple asset classes, and look at how you can apply this knowledge to your own trading strategy.

After the webinar, I’ll also help you get our Hawkeye indicators set up on your charting platform, whether you’re using TradeStation, TradingView, NinjaTrader, or MetaTrader.

Additionally, you’ll gain access to our Hawkeye Volume Mastery Series, where you can continue your education at your own pace.

Understanding the market’s intention through volume and price action is a game-changer.

Let’s get you dialed in and remove the clutter from your charts so you can focus on what really matters.

Click the link below to join the training webinar. I look forward to seeing you there!

Join the Webinar

Don’t miss this opportunity to deepen your understanding of the market and improve your trading skills. Join me in the training webinar by clicking the link below.

I look forward to seeing you there and helping you take your trading to the next level!

Happy Trading,

Anthony Speciale

Hawkeye Traders

Big Energy Profits

Over 2000 Ticks In NASDAQ Reversal

2000 ticks

More Than 2000 Ticks IntraDay Nasdaq Reversal Identified By Volume Climax

Welcome, fellow traders! Anthony Speciale here with Hawkeye Traders. As a retail trader, you know that the opening bell often sets the tone for the day.

This morning, the NASDAQ 100 provided a textbook example of how understanding the relationship between volume and price action can lead to successful trades.

In this blog post, I’ll walk you through the key moments from this morning’s session, highlighting a massive volume climax that set the stage for a significant selloff.

The Opening Bell and Volume Climax

At 9:30 AM Eastern Standard Time, the U.S. market opened, and immediately, we saw a substantial spike in volume—what we call a “volume climax.”

This type of spike is critical because it often indicates a potential shift in market direction.

Specifically, I was focused on the 9:30 AM candle on the NASDAQ 100 Futures, highlighted by our Hawkeye Wide Bar indicator.

This wide bar, colored in magenta on our charts, signaled the presence of ultra-high volume, a key indicator that something significant was about to happen.

The high of this candle was 18,540.75, a level that the market repeatedly tested—five times, in fact—before ultimately collapsing.

The Significance of the 15-Minute Chart

As an intraday trader, you might typically reference a 4-hour or 60-minute chart for overall market direction.

From there, you might zoom into a 30-minute or 15-minute chart, and then finally dial down to a 5, 3, 2, or 1-minute chart depending on how aggressively you trade.

In this case, the 15-minute chart was particularly telling.

The volume climax that occurred at the opening bell was fully respected by the market throughout the morning session.

Despite multiple attempts to break above the high of that initial wide bar, the market couldn’t do it.

This failure to follow through on the buying volume was a clear signal that a selloff was likely.

2000 ticks

Over 2000 Ticks of Opportunity

What happened next was dramatic but not entirely surprising if you understood the relationship between volume and price action.

After failing to break above the high of the opening candle, the NASDAQ 100 Futures began a steep decline, resulting in a drop of over 2000 ticks.

This kind of move represents a significant opportunity for traders who were paying attention to the signals provided by volume.

The aggressive intention of buyers at the open, followed by their inability to push the market higher, was a clear indication that the momentum had shifted to the sellers.

Why Volume and Price Action Matter

The key takeaway here is the importance of understanding the relationship between volume and price action. Volume is often the only precursor to what price is likely to do next.

By paying attention to volume climaxes, like the one we saw this morning, you can gain an edge in predicting market direction.

This concept is critical across all asset classes and timeframes.

Whether you’re trading stocks, futures, forex, or cryptocurrencies, understanding the intention behind market moves—whether driven by buyers or sellers—can dramatically improve your trading outcomes.

Take Your Trading to the Next Level

If this type of analysis interests you, I’d like to invite you to join me in a training webinar where we’ll dive deeper into this relationship between volume and price action.

During the webinar, we’ll explore how this concept applies across different markets and timeframes, whether you’re a scalper, day trader, swing trader, or position trader.

Once you’ve grasped the concept, we’ll also walk you through installing the Hawkeye volume indicators on your trading platform.

These tools are compatible with TradeStation, TradingView, NinjaTrader, and MetaTrader, making it easy for you to apply what you’ve learned to your own trading.

In addition, you’ll gain access to the Hawkeye Volume Mastery Series, a comprehensive educational resource that will help you continue learning at your own pace.

Our team will be there to support you every step of the way.

Join the Webinar

Don’t miss this opportunity to deepen your understanding of the market and improve your trading skills. Join me in the training webinar by clicking the link below.

I look forward to seeing you there and helping you take your trading to the next level!

Happy Trading,

Anthony Speciale

Hawkeye Traders

Big Energy Profits

Tiny Candle Signals Major Crude Oil Reversal

tiny candle signals

One TINY Candle Can Tell A Detailed Story Of What’s To Come

Welcome, fellow traders! Anthony Speciale here with Hawkeye Traders. I’m excited to share the details of a successful crude oil trade I executed this morning.

It’s a great example of how understanding the relationship between volume and price action can lead to profitable trading decisions.

Let’s dive into the specifics of this trade so you can see exactly how it unfolded and, more importantly, how you can apply these insights to your own trading strategy.

The Setup: Spotting a Reversal

This trade took place in light sweet crude oil on a three-minute chart. The key moment happened at 10:54 a.m. Eastern Standard Time.

Earlier in the morning, the market established a significant low, followed by a retracement through some overnight price action.

As the market started to retrace, I noticed something crucial – a series of small candles with large wicks to the upside.

This indicated a loss of momentum among buyers, which often precedes a reversal.

Volume as a Key Indicator

What really caught my attention was the buying volume that started to increase as the market approached a key resistance level.

On the 10:54 candle, buying volume surged, but the candle itself was very small, with a significant wick on top.

This is a classic sign of buyers being absorbed and overpowered by sellers.

The market’s inability to push higher, despite the increased buying volume, signaled a potential reversal.

Executing the Trade

Based on this analysis, I decided to enter a short position as the market began to drop.

I got short and quickly covered my position on the way to price approaching $73.00.

My strategy was simple: take advantage of the market’s weakness and secure profits before the market had a chance to reverse against me.

tiny candle signals

The Outcome

The trade worked out beautifully. In a very short time I quickly paid and protected myself, translating into substantial profits.

The key takeaway here is that understanding the interaction between volume and price action allowed me to confidently execute this trade.

Learn and Apply: Watch the Full Trade Breakdown

I’ve documented the entire trade in a video, detailing every step from entry to exit. ⬇

You’ll see where I moved my stop, how I managed the trade, and each decision I made.

This is not hindsight analysis – it’s real-time trading captured for your educational benefit.

If you’re serious about improving your trading skills, I encourage you to watch the video and see for yourself how this trade played out.

Understanding the dynamics of volume and price action is a game-changer, whether you’re trading stocks, futures, Forex, or cryptocurrencies.

Take the Next Step: Join Our Training Webinar

After you watch the trade video, I invite you to join me in an exclusive training webinar.

In this session, we’ll dive deep into the relationship between volume and price action and how it applies across various markets and trading styles.

Whether you’re a scalp trader, day trader, swing trader, or position trader, this knowledge is crucial for your success.

During the webinar, I’ll also guide you through setting up Hawkeye Volume on your trading platform.

This powerful tool is compatible with TradeStation, TradingView, NinjaTrader, and MetaTrader.

Plus, you’ll gain access to the Hawkeye Volume Mastery Series, allowing you to continue learning and refining your skills at your own pace.

Don’t miss out on this opportunity to elevate your trading. Watch the video, join the webinar, and start mastering the techniques that can transform your trading results.

Happy Trading,

Anthony Speciale

Hawkeye Traders

Big Energy Profits

High Buying Volume Signals Key USO ETF Reversal

high buying volume

Understanding Key Market Reversals and High Buying Volume Signals: A Deep Dive into the USO ETF

Anthony Speciale here with Hawkeye Traders, I hope you’re having a great one!

Welcome to today’s analysis, where I’ll be breaking down a significant trade we’ve been monitoring in the United States Oil Fund (USO) ETF

As retail traders, understanding the dynamics of price action and volume is critical to spotting potential market reversals. 

Today, I’m going to show you a straightforward method to identify these key turning points using channel structures and volume analysis.

The Setup: Recognizing Lower Highs

In my approach to trading, I place great emphasis on channel structures and key levels. 

It’s a technique I was trained on, and it remains a cornerstone of how I interpret market movements, whether on a large scale or a more granular level. 

Recently, we’ve been observing the USO ETF closely, noting the formation of lower highs—a clear indication that the market is trending downward.

This pattern was particularly evident as we plotted a descending trend line, marking a consistent series of lower highs. 

This trend was a strong confirmation for us that the market was likely to continue its downward trajectory. However, it wasn’t just the trend line that caught our attention.

The Role of Volume at Key Levels

As price approached the lower boundary of this channel, we saw an aggressive gap higher, which pushed the price into the upper range of the channel structure. 

This movement was accompanied by a notable spike in buying volume.

However, instead of a continuation higher, the market quickly reversed, with the price failing to break through the resistance level.

This immediate failure, right at a key resistance point, was a clear signal. 

High buying volume into resistance followed by an abrupt reversal is a classic setup for a significant move in the opposite direction. 

In this case, it led to a sharp gap down, where we’ve now seen USO decline by approximately 7.35%.

high buying volume

Why This Matters: Interpreting Volume and Price Action

The key takeaway from this analysis isn’t just the profit potential from the move itself. 

It’s about understanding the interaction between volume and price at critical levels.

This understanding allows us to anticipate potential reversals and align our trades accordingly.

Most traders, especially those newer to the market, rely heavily on lagging indicators, waiting for a crossover or a signal to buy or sell. 

But these signals often come too late. Volume is the ONLY leading indicator of intent.

Focusing on where high volume intersects with key levels of support or resistance, we can identify the market’s intentions—whether it’s poised for a continuation or a reversal.

The Game Changer: Volume Indicators

Ultimately, the market is driven by one fundamental factor: the aggressive intention of buyers or sellers. 

To succeed, you must be able to identify who the aggressor is and understand when and why they are taking action. This is where volume indicators become indispensable.

I want to help you grasp this concept in more detail, which is why I’m inviting you to join an upcoming training webinar. 

In this session, we’ll cover a range of topics including stocks, futures, forex, and cryptocurrencies. 

Whether you’re into scalping, day trading, swing trading, or position trading, this webinar will delve into the relationship between volume and price action—giving you the tools to put the odds in your favor.

Mastering Volume Analysis

During the webinar, I’ll also guide you through installing these essential indicators on your trading platform, whether it’s TradeStation, TradingView, NinjaTrader, or MetaTrader. 

Plus, you’ll gain access to the Hawkeye Volume Mastery Series, a comprehensive resource designed to deepen your understanding of this critical aspect of trading.

If you’re serious about improving your trading and want to learn how to spot these high-probability setups, click here to register for the training webinar

I look forward to seeing you there and helping you enhance your trading skills.

Happy Trading,

Anthony Speciale

Hawkeye Traders

Big Energy Profits

High Selling Volume Led to Profit in PLUG

high selling volume

Ultra High Selling Volume At Supply Triggers Sell-Off, Massive PROFITS Captured

In this post, I want to share a recent trade that we took inside the Big Energy Profits Program, focusing on how the Hawkeye Volume Indicator played a critical role in our decision-making process.

The trade was on Plug Power Inc. (PLUG), and I believe the details of this case study will provide you with valuable insights that can enhance your own trading strategy.

The Setup: Analyzing Plug Power’s Price Action

Let’s dive into the daily chart of Plug Power, traded on the NASDAQ.

What caught our attention was a period of consolidation followed by a sharp price move that presented a potential trading opportunity.

Our focus was on the price action around October 11, 2023.

On this day, we observed an unusually high selling volume that didn’t lead to a new low.

This high-volume activity at a critical area of consolidation was a red flag.

It suggested that sellers were stepping in aggressively, but buyers were unable to push the price above the consolidation zone.

This failure to break higher despite strong selling volume indicated a potential downside move.

The Trade: Executing the Short Position

Based on our analysis, we entered a short position at $7.35.

The high selling volume and failure to close above the consolidation area were key factors in making this decision.

We set initial profit target at $6.25, a level we reached fairly quickly, locking in a 15% gain.

Our strategy involved managing the trade dynamically.

After hitting the first profit target, we moved our stop-loss to the entry point to protect our position. This approach allowed us to ride the trend while minimizing risk.

Risk vs. Reward: A Strategic Approach

At the time of entry, our risk-to-reward ratio was nearly 2:1. This setup gave us confidence in the trade, knowing that we had a favorable probability of success.

As the trade progressed, we continued to manage our position, ultimately taking additional profits when the market gapped down, offering us a nearly 50% gain.

high selling volume

The Outcome: A Successful Trade with Room for More

To date, we’re still holding a portion of this position, which is currently up almost 73% as it approaches our final profit target.

The market’s behavior—particularly the price gaps that often occur in high-momentum trades like this—has worked in our favor.

Our decision to take profits incrementally and adjust stops as the trade moved in our direction has been validated by the market action.

As of now, we’re just 16 cents away from hitting our final target. If the price continues to fall, we’ll analyze further to determine if there’s potential for additional gains.

Key Takeaways: The Power of Volume Analysis

This trade was driven by one fundamental concept: understanding the relationship between volume and price action.

By recognizing the significant selling volume at a critical point of consolidation, we were able to position ourselves for a highly profitable trade.

Invitation to Learn More

If you’re interested in diving deeper into how volume and price action can transform your trading, I’d like to invite you to join me in a training webinar.

During this session, I’ll go into detail about the techniques used in this trade and how you can apply them to your own trading, regardless of the asset class or time frame.

In the webinar, we’ll explore how these concepts can be applied to day trading, swing trading, scalping, and even options trading.

Plus, you’ll gain access to the Hawkeye Volume Indicators, which work seamlessly on platforms like TradeStation, TradingView, NinjaTrader, and MetaTrader.

Additionally, I’ll grant you access to the Hawkeye Volume Mastery Series, where you can learn at your own pace and develop a deep understanding of how volume drives market movements.

Join me in this journey to better trading. Click here to sign up for the webinar, and let’s take your trading skills to the next level.

I look forward to seeing you there and helping you succeed in the markets.

Happy Trading,

Anthony Speciale

Hawkeye Traders

Big Energy Profits

Price to Volume Divergence: Apple’s Critical Turning Point

price to volume divergence

Understanding Apple’s Price to Volume Divergence: What It Means for Traders

As traders, one of the most critical skills to develop is the ability to read the market beyond just price action.

Understanding the relationship between volume and price can often provide the missing piece in predicting market movements with higher accuracy.

In this post, I want to take you through a recent observation I’ve made on Apple’s chart that may signal an important turning point.

Apple’s Price to Volume Divergence: A Closer Look

In recent trading sessions, Apple’s daily chart on the NASDAQ has shown some intriguing signals that every trader should be aware of.

Specifically, I noticed a divergence between price and volume that could suggest a significant move is on the horizon.

Let’s break this down:

  • Recent Candle Analysis: The most recent candle on Apple’s chart closed with notably high selling volume. At first glance, this might suggest bearish sentiment; however, a closer look reveals something more nuanced. Despite the surge in selling volume, Apple failed to make a new low compared to the previous session.
  • Comparison with Previous Candles: If we compare this with the candle that closed before it, we notice that the prior candle had less volume but a more significant downward move. It opened near the high and closed in the bottom 15% of the candle’s range. This is a classic bearish signal. Yet, the next session’s increase in volume didn’t result in a lower price, which raises a red flag.

price to volume divergence

What Does This Mean for Traders?

When volume increases significantly without corresponding price movement, it suggests that there’s a battle happening between buyers and sellers.

In this case, despite the sellers’ best efforts, the buyers seem to be holding the line.

This can often be a sign of a potential reversal, where the market absorbs selling pressure and prepares for a move higher.

For those trading Apple, whether you’re trading the stock directly or using options, this is a crucial moment to watch.

Over the next few sessions, pay close attention to how Apple behaves around this support level.

If the stock holds and begins to move higher, this could confirm that we’ve seen a selling climax—a point where selling pressure is exhausted, and a reversal is likely.

Potential Scenarios Moving Forward

  • Support Holds and a Reversal Occurs: If Apple holds its current support level, we could see a move back up toward the $230-$233 range. This would align with the idea of a selling climax, where the downward pressure is absorbed, and buyers begin to take control.
  • Support Breaks and Further Downside: If the support fails, we could see Apple retest lower levels, possibly around the previous wide bar’s low. This scenario would suggest that the selling pressure is too strong for the buyers to hold off, leading to further declines.

Why Understanding Volume and Price is Key

This situation with Apple is a perfect example of why traders need to understand the relationship between volume and price action.

Volume tells us the story behind the price movement—who is in control, buyers or sellers, and how strong their conviction is.

If you’re not yet comfortable with interpreting these signals, or if you’re looking to refine your skills, I invite you to join me for an upcoming training webinar.

During this session, we’ll dive deeper into these concepts and explore how you can apply them across different assets and timeframes—whether you’re day trading, swing trading, or even holding longer-term positions.

What’s Next?

In the webinar, I’ll also introduce you to the Hawkeye Volume Indicator, a tool that has been instrumental in my trading strategy.

This indicator helps to clarify the relationship between volume and price, giving you a clearer picture of what’s happening in the market.

You’ll also gain access to our Hawkeye Volume Mastery series, where you can learn at your own pace and start applying these techniques to your trading immediately.

If you’re ready to take your trading to the next level and start making more informed decisions based on what truly moves the market—volume and price action—then I encourage you to join me.

Click the link below to sign up for the webinar and start your journey toward becoming a more confident, disciplined, and profitable trader.

I look forward to seeing you there and helping you achieve greater success in your trading career.

The market is constantly sending signals, and the ability to interpret these signals can make all the difference in your trading results.

By understanding the nuances of volume and price action, you can anticipate moves before they happen and position yourself to capitalize on them.

Don’t miss out on this opportunity to deepen your understanding and improve your trading performance.

Join me in the training webinar to learn more and gain the tools you need to succeed.

Happy Trading,

Anthony Speciale

Hawkeye Traders

Big Energy Profits

WideBar Predicts NVDA Market Turning Points

market turning points

Hawkeye WideBar Nails Every Significant NVDA Price Pivot YTD 2024 Following Market Turning Points.

Anthony Speciale here with Hawkeye Traders. I hope you’re doing well and thriving in your trading journey.

Today, I want to revisit a topic I covered in a video on June 21st, where I made a rather bold prediction about Nvidia.

At that time, I pointed out a significant wide bar on the chart, suggesting that Nvidia could be setting up for a major high.

Fast forward to now, and the market has indeed followed through on that projection.

Let’s take a closer look at how this unfolded and what it can teach us about the vital relationship between volume and price action.

The Significance of Wide Bars

In trading, Hawkeye WideBars represent areas of abnormal price movement, often accompanied by significant volume.

These are critical moments that can indicate potential market turning points in the market. In Nvidia’s case, we saw a wide bar on June 21st that led to a substantial decline.

Since then, the stock has dropped over 21%, testing key support levels along the way.

This wasn’t just a random occurrence. If you look at Nvidia’s chart over the past year, every wide bar has had a meaningful impact on the stock’s subsequent price action.

Whether it’s pushing prices higher or lower, these wide bars, when paired with volume analysis, offer powerful insights into what the market is likely to do next, especially at crucial market turning points.

The Key to Consistent Trading Success

market turning points

Understanding the relationship between volume and price action isn’t just about making one good call.

It’s about consistently identifying high-probability setups across all timeframes and asset classes.

Whether you’re trading stocks, futures, forex, or cryptocurrencies, the interaction between volume and price remains a constant—one that can greatly enhance your trading results.

In my 13 years of trading, I’ve learned that the most reliable indicator isn’t some complex software or obscure metric.

It’s the simple, yet profound, relationship between volume and price.

By understanding who the dominant party is at any given time—buyers or sellers—you gain a crucial edge in predicting market movements.

Why You Need to Master This Relationship

If you haven’t yet explored this critical aspect of trading, or if you feel your understanding is incomplete, I want to help you take your skills to the next level.

The good news is, mastering this relationship doesn’t require years of experience or advanced mathematical skills.

It just requires a willingness to learn and the right tools to guide you.

To that end, I’d like to invite you to join me for an upcoming training webinar.

In this session, we’ll dive deep into the dynamics of volume and price action, exploring how you can apply these insights to your own trading.

Whether you’re a day trader, swing trader, or long-term investor, this knowledge is vital to your success.

How to Get Started

Click Here to register for the webinar.

Once you’ve joined, we’ll walk through how to populate the Hawkeye Volume Indicators on your trading platform—whether you’re using TradeStation, TradingView, NinjaTrader, or MetaTrader.

You’ll also gain access to the Hawkeye Volume Mastery Series, where you can learn at your own pace and deepen your understanding of this crucial relationship.

The goal is to equip you with the tools and knowledge you need to make informed, confident trading decisions.

Before you know it, you’ll be able to clear away the clutter of lagging indicators and focus on what really matters: the interplay between volume and price.

I’m looking forward to seeing you in the webinar and helping you unlock the full potential of your trading strategy.

Remember, the market’s intentions are there for you to see—you just need to know how to read them.

See you in the webinar.

Happy Trading,

Anthony Speciale

Hawkeye Traders

Big Energy Profits

Volume Climax: Key to Reversal Trades

volume climax

Volume Climax Triggers Reversal Into Closing Bell

I’m Anthony from Hawkeye Traders, and today I want to share with you a remarkable trade taken by a good friend of mine who is a fellow Hawkeye user. 

Although I can’t take credit for this one, I believe it provides a perfect example of how understanding the relationship between volume and price action can lead to exceptional trading results.

The Trade Breakdown

The trade in question was on a 3-minute chart of Light Sweet Crude Oil Futures. 

What caught my friend’s eye—and ultimately led to his successful trade—was the volume climax that occurred leading into the 2:30 PM close of the crude oil session. 

This volume surge, accompanied by a big engulfing bar, signaled a potential reversal, and my friend acted on it.

He entered the trade after spotting the volume climax and the subsequent engulfing bar, and exited before the closing bell. 

The trade played out beautifully, with price reversing just as the volume indicated it might.

volume climax

Why This Trade Worked

The success of this trade boils down to one key factor: understanding the relationship between volume and price action

My friend recognized the significance of the volume climax and knew that such a large influx of selling volume often precedes a market reversal. 

By understanding this, he was able to confidently enter and exit the trade with precision.

This is a prime example of how mastering the interaction between volume and price action can lead to consistent and profitable trades. 

It’s not just about spotting opportunities—it’s about understanding the underlying market dynamics that drive those opportunities.

volume climax

Learning the Relationship Between Volume and Price Action

If this concept is new to you, or if you’re still trying to get a handle on it, I want to invite you to join me for a live training webinar

In this session, we’ll dive deep into the relationship between volume and price action. 

I’ll show you how to identify key moments in the market where this relationship can tip the odds in your favor.

Whether you’re a day trader, swing trader, or position trader—whether you trade stocks, futures, Forex, cryptocurrencies, or options—understanding this relationship is crucial. It’s a universal principle that applies across all markets and timeframes.

Get the Tools You Need

The Hawkeye Volume, which played a crucial role in my friend’s trade, are available on multiple platforms, including NinjaTrader, TradeStation, TradingView, and MetaTrader. 

These indicators are designed to help you decode market activity and provide the insights you need to make informed trading decisions.

By integrating these tools into your trading routine, you’ll gain a clearer understanding of what the market is doing, where it’s likely to go next, and why. 

And that knowledge can be the difference between a winning trade and a losing one.

Join Me for a Live Training Session

If you’re ready to take your trading to the next level, click the link below to join me for the upcoming training webinar. 

We’ll explore the concepts I’ve touched on here in much greater detail, and you’ll learn how to apply them to your own trading.

This is an opportunity to see firsthand how the Hawkeye Volume can transform your trading approach and help you achieve the consistency you’ve been striving for.

I look forward to seeing you there and helping you enhance your trading skills.

Join the Webinar Now!

Looking forward to seeing you there…

Happy Trading,

Anthony Speciale

Hawkeye Traders

Big Energy Profits

Buying Pressure: Unlocking Trading Potential

buying preassure

Volume Climax Triggers Profitable Reversal When Buying Pressure Changes

In today’s volatile trading environment, understanding the intricate relationship between volume and price action is crucial. 

I want to share a recent crude oil trade I executed and the thought process behind it. 

My goal is to help you understand how Hawkeye Volume tools can make these kinds of setups clearer and more actionable.

Identifying the Opportunity

This morning, as I analyzed the crude oil market, a few key technical signals caught my attention. 

We had made a notably lower high, and on the retest of this lower high, it became apparent that the market was struggling to push higher. 

The price action was telling a story, and it was one of weakening buying pressure and potential for a downside move.

At 7:09 a.m. EST, I saw the final confirmation I needed on the 3-minute chart for Light Sweet Crude Oil Futures. 

The market pushed up into an area where price had previously fallen, creating what appeared to be a slight lower low and lower high. 

This was where the real signal came in.

A large green candle appeared, with a huge surge in buying volume. Traditional volume analysis would interpret this as a bullish signal. 

However, the Hawkeye Volume tools told a different story. Despite the large buying volume, the price failed to break through the resistance level. 

This candle was what we call a “volume climax”—an indication that buyers had exhausted themselves and were unable to push the market higher.

This is where Hawkeye Volume stands out. It identified that despite the aggressive buying, the sellers were still in control, absorbing all the buying pressure. 

This insight made it clear that the market was likely to move lower from this point.

Executing the Trade

Given the information provided by Hawkeye Volume, I decided to enter a short position.

buying preassure

Here’s how the trade played out:

  • I entered short at 78.65, right at the close of the signal candle.
  • My first target was hit at 78.45, where I took partial profits.
  • I took additional profits at 78.25 as the market continued to move in my favor.
  • Finally, my remaining position was stopped out at 78.40, still in profit.

GAIN: $5250.00 – Fees

While the market didn’t continue lower as aggressively as I had hoped, the trade was still profitable. 

The key takeaway here is that the Hawkeye tools allowed me to identify the weakness in the buying pressure and execute a trade with confidence.

The Power of Hawkeye Volume

The success of this trade boils down to understanding the interaction between volume and price action. 

Knowing who the aggressor is in any given situation—whether it’s the buyers or the sellers—can make price movements at key levels more predictable.

Hawkeye Volume doesn’t just show you how much trading is happening; it helps you understand the quality of those trades. 

Are the buyers really in control, or are they being overpowered by hidden selling pressure? This is the kind of insight that can transform your trading.

Take Your Trading to the Next Level

If you found this breakdown helpful and want to dive deeper into these concepts, I invite you to join me for a training webinar

In the webinar, I’ll walk you through the intricacies of how volume and price action interact, and how you can apply these insights using Hawkeye tools across various markets—whether you’re trading stocks, futures, forex, or cryptocurrencies.

The indicators we use are compatible with platforms like TradeStation, TradingView, NinjaTrader, and MetaTrader. Whether you’re a day trader, swing trader, or even a position trader, understanding this relationship is crucial for consistent success.

To get started, click the link below to join the upcoming webinar. Let’s work together to enhance your trading skills and achieve the success you deserve.

Join the Webinar Now!

Looking forward to seeing you there…

Happy Trading,

Anthony Speciale

Hawkeye Traders

Big Energy Profits

Volume Dynamics & 1500+ Tick Intraday Profit

Spotting Volume Dynamics That Resulted In A 1500+ Tick Intraday Nasdaq Sell-Off

Anthony Speciale here with Hawkeye Traders. I hope you’re having a phenomenal day. 

I want to share with you a bold call I recently made and the outcome that followed. 

This isn’t just about showcasing a successful trade, but rather about understanding the principles that led to this decision, which you can apply to your own trading strategies.

Setting the Scene

While trading LIVE with a group of traders, I saw a significant opportunity in the market. 

It was around 10:55 AM on 7/30/24, just before I stepped out of the office for the day. 

I shared my insights, suggesting that the NASDAQ and the S&P could continue to move lower based on the current market evidence offered.

Now, let me walk you through exactly what I saw, why I made this call, and the subsequent market movements.

The Analysis

Volume and Price Action

This isn’t about an ego stroke or boasting. It’s about leveraging 13 years of studying volume and price action with the assistance of Hawkeye Volume Based Tools

These tools help in analyzing, interpreting, and creating expectations based on volume.

As I made my statement at 10:55 AM, here’s what the market looked like:

  • Floor Formation: The price had formed a floor, failing to close below it initially, but eventually breaking through.
  • Volume Dynamics: We saw an increase in selling volume, followed by a slight decrease, possibly due to profit-taking. However, there was no new significant buying volume, indicating a lack of aggressive buyers.
  • Sellers Stepping In: With no new aggressive buyers stepping in, the sellers took control, leading to a significant price drop.

volume dynamics

Execution and Outcome

At 10:55 AM, I told the traders that if the market couldn’t get back above the key level, it was likely to continue lower. 

The evidence was clear: no new aggressive buyers meant the market would NOT go higher.

Here’s what happened next:

  • Market Movement: From the point of my call, the market fell significantly. We saw a drop of around 1,576 ticks by the closing bell.
  • Profit Calculation: This movement translated to approximately $7,880 per contract, at a $5 per tick value.

Key Takeaways

  • Understanding Aggression: The market moves based on aggressive participants. Without aggressive buyers, the market can’t go higher.
  • Volume Interpretation: Analyzing volume can provide insights into market intentions, helping you make informed decisions.
  • Hawkeye Tools: Utilizing Hawkeye volume tools can significantly enhance your market analysis, making it more achievable to predict market movements.

Invitation to Learn More

For those of you who aren’t yet using Hawkeye tools or don’t fully understand the interaction between volume and price action, I’d like to invite you to a training webinar

I’ll explain these concepts in detail and show you how to apply them in your trading.

You can join the webinar by clicking the link below. Bring a piece of paper and a pen, take notes, and feel free to reach out with any questions. Our team is here to help you!

Join the Training Webinar

Trading isn’t about being right all the time; it’s about understanding the market and making informed decisions based on evidence. 

Trading can be a rewarding career once you master the necessary skills. 

Understanding volume and price action provides clarity in a cluttered market, leading to consistent and profitable trading. 

I am passionate about helping other traders achieve success, and I look forward to seeing you in the training webinar.

Click here to join the training webinar and start your journey towards mastering volume and price action.

Thank you for your time, and I look forward to seeing you succeed as a trader.

Happy Trading,

Anthony Speciale

Hawkeye Traders

Big Energy Profits

$12,000+ With Volume Climax and Double Top Formation

double top formation

$12,000+ Intraday Trading Profit By Identifying Volume Climax and Double Top Formation

Anthony Speciale here with Hawkeye Traders. I hope you’re having a fantastic day.

Today, I’m excited to share a trade that yielded just over $12,000 in a single day.

https://vimeo.com/991832999?share=copy 

This trade exemplifies the power of understanding volume and price action, particularly in recognizing double tops.

Identifying the Double Top with Hawkeye Volume

The key to this trade was identifying a double top formation using Hawkeye Volume.

As the session progressed, we noticed a volume climax at the prior high.

This surge in volume, coupled with the failure to break the high, indicated a strong potential for a reversal.

Here’s a closer look:

  • Volume Surge at the High: We observed a significant increase in volume as the price approached the prior high of the session. Despite this, the market failed to push higher.
  • Candlestick Analysis: The candles showed a push up in volume but closed around the 50% mark, indicating indecision and a likely reversal.
  • Volume Climax Confirmation: The Hawkeye wide bar confirmed strong selling pressure. The market then experienced a sharp decline, validating our double top hypothesis.

double top

Detailed Trade Breakdown

Let’s walk through the trade:

  • Entry Point: I entered the trade after the market failed the prior high, marked by a significant volume surge without follow-through.
  • Managing the Trade: As the trade progressed, I took profits and advanced my stop to protect gains while allowing the move to reach its full potential.
  • Profit Taking: By recognizing the volume climax, I spread out my profit-taking points, ultimately securing just over $12,000.

The Importance of Volume and Price Action

The crux of successful trading lies in understanding the relationship between volume and price action. Many traders rely on indicators or algorithms, but the true power comes from observing how aggressive buyers and sellers interact at key levels.

A Live Example

I identified this setup LIVE, for myself and other traders trading real money accounts.

This isn’t hindsight analysis; it’s real-time decision-making based on proven principles.

Join Me for a Deeper Dive

I believe in the power of education and sharing knowledge. That’s why I’ve included a detailed video of this trade within the blog post.

I encourage you to watch it and understand the nuances of volume and price action.

Additionally, I invite you to join me in a training webinar where we will delve deeper into these concepts.

We’ll discuss how to get Hawkeye volume on your charts, whether you use TradeStation, TradingView, NinjaTrader, or MetaTrader.

This approach works across various instruments—stocks, futures, forex, and cryptocurrencies—and for different trading styles, from day trading to position trading.

Trading can be a rewarding career once you master the necessary skills.

Understanding volume and price action provides clarity in a cluttered market, leading to consistent and profitable trading.

I am passionate about helping other traders achieve success, and I look forward to seeing you in the training webinar.

Click here to join the training webinar and start your journey towards mastering volume and price action.

Thank you for your time, and I look forward to seeing you succeed as a trader.

Happy Trading,

Anthony Speciale

Hawkeye Traders

Big Energy Profits

Navigating BAC with Market Signals

market signals

Navigating Bank of America [BAC] Turning Points With Ease Following These Market Signals

Hello fellow traders! Anthony Speciale here with Hawkeye Traders, and today, we’re diving into a powerful strategy using Hawkeye tools with a focus on Bank of America. 

Whether you’re day trading, swing trading, or looking for long-term position acquisitions, understanding the relationship between volume and market signals is crucial.

The Power of Hawkeye Wide Bars

The Hawkeye WideBar is instrumental in identifying high volume surge areas and larger than normal price movements. 

These indicators play a significant role in market signals analysis, offering insights into potential trade opportunities.

Recent Analysis of Bank of America

Let’s revisit a recent analysis of Bank of America. Earlier, we identified a strong selling climax, marked by a significant volume surge. 

This occurred at a key upward trendline, which held as a support level. The subsequent push up to prior highs presented a beautiful entry point.

On May 30th, 2024, we observed a candle that closed lower than it opened, but the Hawkeye volume indicator revealed a strong presence of buyers at a level that had been resistance and was now support. 

This insight allowed us to hold this support level and rally into a buying climax, where a wide bar and strong volume surge indicated a significant move.

market signals

The Importance of Volume and Price Action

Understanding the interaction between volume and price action is vital. 

For instance, when a wide bar makes a new high on strong volume, but fails to close above the candle, it often leads to a price fallback. 

This pattern was evident with Bank of America, where the market fell approximately 6% in just 8 trading days after hitting a buying climax.

Applying the Strategy Across Markets

This strategy isn’t limited to a specific market. It applies to stocks, futures, forex, cryptocurrencies, and options across various trading styles. 

Whether you’re a day trader, swing trader, or position trader, recognizing these volume surges and price actions can significantly enhance your trading decisions.

Join Our Training Webinar

To help you master this strategy, I’m hosting a training webinar. In this session, we’ll delve deep into the technical aspects and the Hawkeye volume methodology. 

You’ll learn how to apply these concepts to your trading, regardless of the asset class or time frame.

Get Started with Hawkeye Tools

I invite you to join me in the training webinar by clicking the link below. 

This webinar will provide the knowledge you need to leverage Hawkeye tools effectively. 

Additionally, you’ll get access to the Hawkeye Volume Mastery Series, allowing you to study these concepts at your own pace.

Join the Training Webinar

Understanding the relationship between volume and price action is essential for successful trading. 

The Hawkeye Wide Bars and Volume Based Indicators offer invaluable insights, enabling you to make informed trading decisions. 

Don’t miss this opportunity to enhance your trading strategy!

Thank you for being here, and I look forward to seeing you in the training webinar.

Happy Trading,

Anthony Speciale

Hawkeye Traders

Big Energy Profits

Profiting from Volume-Confirmed Breaks

volume-confirmed break

Big Energy Profits Members Cashing In On Hawkeye Volume-Confirmed Break

Anthony Speciale here with Hawkeye Traders and Big Energy Profits. 

Today, I want to walk you through how I utilize the Hawkeye Volume Indicators to confirm trades, specifically focusing on a recent trade in crude oil futures. 

Our approach at Big Energy Profits spans across stocks, futures, options, and more, targeting opportunities in the energy market from all angles.

The Trade Setup

The chart in front of you is a daily chart of light sweet crude oil futures. 

Within Big Energy Profits, we don’t limit ourselves to just futures; we explore stocks, ETFs, and any energy-related market. 

Recently, we identified a prime opportunity in crude oil. A strong, volume-confirmed close below support signaled us to take a position.

volume-confirmed break

Key Indicators and Confirmation

We’ve already started taking profits from this trade. Here’s a breakdown of how we used Hawkeye technology to identify and execute this trade:

Channel Analysis:

  • The chart initially displayed a clear ascending channel, indicating upward momentum.
  • This was followed by a descending channel, signaling potential bearish sentiment.

Volume-Confirmed Break:

  • The critical signal was a strong, volume-confirmed break below the lower channel support.
  • This break was accompanied by a robust full-bodied candle closing near its low, significantly below the support level.

Executing the Trade:

  • This clear volume and price action confirmation led us to short crude oil futures.
  • Within 18 hours, this trade yielded several hundred ticks.

Due to the exclusivity for the Big Energy Profits family, I won’t disclose specific profit-taking levels here. However, the principle remains: using volume to confirm price action can be game-changing.

Applying These Techniques to Your Trading

The beauty of this strategy lies in its versatility. You can apply these Hawkeye indicators and volume analysis techniques to any asset class, whether it’s stocks, futures, forex, or cryptocurrencies. The relationship between volume and price action is consistent across different markets and time frames.

Join the Training Webinar

I invite you to dive deeper into this topic. I’m hosting a training webinar where I’ll elaborate on the technical aspects and the Hawkeye volume methodology. 

This webinar is designed to equip you with the knowledge to apply these strategies to your own trading.

Additionally, if you’re interested in a comprehensive approach to trading in the energy sector, including stocks and options, I encourage you to learn more about Big Energy Profits. I maintain a model portfolio and provide detailed swing trading strategies.

Get Started Today

For those interested in both the Hawkeye Volume Indicators and Big Energy Profits, my team is ready to assist. 

Call the number provided below the blog post, and they’ll help you get started with a package deal that includes access to both programs. 

Email: [email protected]  – OR –  Call: 888-233-8598

Our concierge team will guide you through setting up the indicators, understanding their use, and integrating you into the Hawkeye volume mastery series. If you wish to trade alongside me in the energy sector, we can facilitate that too.

This strategy has transformed my trading approach over the past decade. 

Consistent application with discipline, ensuring the presence of volume and meaningful price action, can revolutionize your trading results.

Happy Trading,

Anthony Speciale

Hawkeye Traders

Big Energy Profits

Volume Analysis for Intraday Reversal

intraday reversal

How I was able to identify a 170 Tick, intraday reversal LIVE

Anthony Speciale here with Hawkeye Traders. I hope you’re having a great day!

Today, I want to share an in-depth analysis of the trade I executed this morning, as well as how other live traders in our group had the same opportunity.

Understanding how to read market signals and using the right tools can make all the difference in your trading strategy.

The Setup

I started my day early, as usual, by analyzing the market for any actionable clues.

The focus was on crude oil futures, where I observed some crucial signals that guided my trading decisions.

One of the key indicators that played a significant role in today’s trading success was the Hawkeye Wide Bars.

At 6:15 AM, I noticed a strong buying surge followed by a period of consolidation.

This consolidation was a key point of interest. Even though there was additional buying, the price struggled to close above the consolidation level.

This pattern indicated the potential creation of an area of supply. In trading, such clues are critical as they often signal potential intraday reversal.

Key Trading Signal

The crucial moment came at 8:00 AM. By then, I had already noted that if the market failed to close above the level of 78.08, a sell-off was highly probable.

This was based on the volume radar dots and the volume surges failing to push the price higher, despite the strong buying pressure.

This divergence gave me confidence to predict that the market would continue to sell off.

intraday reversal

Indeed, after my statement, the market began to decline, moving approximately 170 ticks lower from that point.

This wasn’t a fluke; it was a result of understanding and interpreting the volume correctly.

Trade Execution and Results

As the market continued to respect the level of 78.08 as resistance, we saw repeated failures to push above it.

This pattern of strong buying that couldn’t sustain higher levels confirmed the bearish push.

Consequently, the market continued to trend lower, offering traders the opportunity to profit from the decline.

By recognizing these patterns, LIVE traders in our group could take advantage of a move that yielded as much as 170 ticks in profit.

This highlights the power of using the Hawkeye Volume Indicators to identify and capitalize on market opportunities effectively.

Learn More

If you found this analysis insightful and want to learn how to apply these strategies in your trading, I invite you to join me in an upcoming training webinar.

We will dive deeper into the relationship between volume and price action, and how you can leverage this knowledge across various markets and timeframes.

Whether you’re trading stocks, futures, forex, or cryptocurrencies, understanding these concepts is crucial for improving your trading outcomes.

Click the link below to secure your spot in the training webinar and take your trading to the next level. Join the Training Webinar

I look forward to seeing you there and helping you enhance your trading skills.

Happy Trading,

Anthony Speciale

Hawkeye Traders

Big Energy Profits

Intraday Reversal in Crude Oil Futures

intraday reversal

How I was able to identify a 170 Tick, intraday reversal LIVE

Anthony Speciale here with Hawkeye Traders. I hope you’re having a great day!

Today, I want to share an in-depth analysis of the trade I executed this morning, as well as how other live traders in our group had the same opportunity.

Understanding how to read market signals and using the right tools can make all the difference in your trading strategy.

The Setup

I started my day early, as usual, by analyzing the market for any actionable clues.

The focus was on crude oil futures, where I observed some crucial signals that guided my trading decisions.

One of the key indicators that played a significant role in today’s trading success was the Hawkeye Wide Bars.

At 6:15 AM, I noticed a strong buying surge followed by a period of consolidation.

This consolidation was a key point of interest. Even though there was additional buying, the price struggled to close above the consolidation level.

This pattern indicated the potential creation of an area of supply. In trading, such clues are critical as they often signal potential reversals.

Key Trading Signal

The crucial moment came at 8:00 AM. By then, I had already noted that if the market failed to close above the level of 78.08, a sell-off was highly probable.

This was based on the volume radar dots and the volume surges failing to push the price higher, despite the strong buying pressure.

This divergence gave me confidence to predict that the market would continue to sell off.

intraday reversal

Indeed, after my statement, the market began to decline, moving approximately 170 ticks lower from that point.

This wasn’t a fluke; it was a result of understanding and interpreting the volume correctly.

Trade Execution and Results

As the market continued to respect the level of 78.08 as resistance, we saw repeated failures to push above it.

This pattern of strong buying that couldn’t sustain higher levels confirmed the bearish push.

Consequently, the market continued to trend lower, offering traders the opportunity to profit from the decline.

By recognizing these patterns, LIVE traders in our group could take advantage of a move that yielded as much as 170 ticks in profit.

This highlights the power of using the Hawkeye Volume Indicators to identify and capitalize on market opportunities effectively.

Learn More

If you found this analysis insightful and want to learn how to apply these strategies in your trading, I invite you to join me in an upcoming training webinar.

We will dive deeper into the relationship between volume and price action, and how you can leverage this knowledge across various markets and timeframes.

Whether you’re trading stocks, futures, forex, or cryptocurrencies, understanding these concepts is crucial for improving your trading outcomes.

Click the link below to secure your spot in the training webinar and take your trading to the next level. Join the Training Webinar

I look forward to seeing you there and helping you enhance your trading skills.

Happy Trading,

Anthony Speciale

Hawkeye Traders

Big Energy Profits 

Using Volume Analysis for Flawless Reversal

flawless reversal

Using Hawkeye Volume To Stack The Odds In My Favor – Flawless Reversal

Anthony Speciale here from Hawkeye Traders. I hope you’re having a wonderful day. 

Today, I want to share the details of a trade I executed in the crude oil futures market and illustrate how Hawkeye Volume Analysis was pivotal in making my trading decisions.

The Setup: Crude Oil Futures on a 5-Minute Chart

The trade took place on a 5-minute chart of WTI Light Sweet Crude Oil Futures. 

At 7:15 AM, I entered a short position. The key factor in my decision was the market’s behavior around the 6:55 AM mark.

Analyzing the Volume and Price Action

At 6:55 AM, the chart showed a build-up in buying volume followed by a Hawkeye Wide Bar.

This wide bar often signals a potential flawless reversal. I patiently waited for the price to revisit this wide bar’s wick area. 

The rationale was that if the price failed to break above this wick, it would likely head back towards the prior lows, which is exactly what transpired.

flawless reversal

Key Observations

  • Strong Buying Volume with Weak Candle Close: Despite a significant increase in buying volume, the candle closed at about the 60-65 percentile of its range. This indicated that the buyers couldn’t maintain control in the upper 30-35% of the candle’s range.
  • Repeated Failures at Resistance: The price tested the resistance area again and failed, reinforcing my short bias.
  • Previous Hawkeye Wide Bars: Looking back, another Hawkeye Wide Bar on high selling volume had shown similar behavior, failing to close in the bottom 10 percentile, indicating strong support at that level.

The Trade Execution

I shorted at 7:15 AM, targeting the prior lows, supported by the analysis of Hawkeye Wide Bars and volume behavior. As price approached these prior lows, I started to take profits incrementally, adhering to the principles of paying and protecting myself.

The Importance of Volume and Price Action

Understanding the relationship between volume and price action is crucial.

Hawkeye’s indicators provided the confidence to place the trade by highlighting significant buying volume that couldn’t sustain higher prices, suggesting a likely downturn.

Key Takeaways for Traders

  • Volume Analysis: The highest buying volume in the session failed to push prices significantly higher, indicating potential weakness.
  • Hawkeye Wide Bars: These bars, combined with volume analysis, are powerful tools for identifying key support and resistance levels.
  • Risk Management: Always have a trade plan and good risk management strategies in place. Protect your profits by adjusting your stops and taking profits when the market offers them.

Join Me for a Deeper Dive

To truly grasp these concepts and apply them to your trading, I invite you to join me in a training webinar. We will delve deeper into the interaction between volume and price action, regardless of the market or timeframe you trade.

Join the Training Webinar

In the webinar, you will learn:

  • How to identify key trading opportunities using volume analysis.
  • The significance of Hawkeye Wide Bars in your trading strategy.
  • Practical tips for effective risk management and trade planning.

Whether you’re trading stocks, futures, forex, or cryptocurrencies, understanding these concepts will revolutionize your trading approach.

I look forward to seeing you in the webinar. Until then, may your days be profitable!

Happy Trading,

Anthony Speciale

Hawkeye Traders

Big Energy Profits

High Volume Node and Supply in AUD/USD

high volume node

AUD/USD – Using Hawkeye High Volume Node To Identify Supply

Hey folks, Anthony Speciale here with Hawkeye Traders. Welcome to today’s analysis video where we’ll dive into the Australian Dollar/US Dollar (AUD/USD) currency pair.

We’re going to focus specifically on a high volume node that occurred at 9:45 a.m. today, triggered by some economic data releases.

Understanding a high volume node and its implications can greatly enhance your trading decisions.

Economic Data and Market Reactions

This morning, economic data releases impacted market movements.

Throughout the week, we’ll continue to see various data points that the market will react to, either bullishly or bearishly.

Our goal as traders is to interpret these reactions accurately and make informed trading decisions.

Analyzing Volume and Price Action

On my screen, you can see traditional volume printing red, while Hawkeye volume is printing green.

Additionally, the Hawkeye paint bar is also green. This discrepancy is crucial to understand.

Many might assume that a lower closing price compared to the opening should result in a red bar. However, the bias within this candle was actually driven by aggressive buyers.

This situation exhibits significant weakness and absorption, leading the market to continue lower. As the session progressed, the AUD/USD pair failed to break above the earlier session highs, indicating a strong supply zone at those levels.

This consistent inability to move higher suggests that sellers are absorbing buying pressure.

high volume node

Identifying Supply and Resistance Levels

The high of this particular candle marks an area of supply. Despite multiple retests, the market failed to push higher, resulting in lower highs.

This pattern, combined with the surge in volume, signifies strong resistance and potential for further downward movement.

Traditional volume might show red, but Hawkeye volume reveals aggressive buying being absorbed by sellers, leading to a continued sell-off.

The Importance of Understanding Volume Dynamics

Recognizing who the aggressor is at any given point is crucial. In this instance, strong buying was met with absorption by sellers, causing the price to fall.

This insight is vital for traders aiming to make low-risk, high-probability trades.

By understanding the relationship between volume and price action, traders can identify significant market movements before they happen.

Enhance Your Trading With Hawkeye Volume Indicators

At Hawkeye, our goal is to help you understand these market dynamics. Our indicators are designed to reveal insights that traditional volume charts might miss.

We want you to recognize when, where, and why something out of the norm is happening because these are often the precursors to substantial market moves.

Join Our Training Webinar

To dive deeper into these concepts, I invite you to join our training webinar.

We’ll explore the intricate relationship between volume and price action and how to use this knowledge to develop a robust trading strategy.

During the webinar, we’ll get the Hawkeye Volume Indicators on your chart and provide access to the Hawkeye Volume Mastery Series, where we delve further into these theories.

Understanding market dynamics is key to successful trading.

By attending our training webinar, you’ll gain the insights needed to identify high-probability setups and enhance your trading performance.

REGISTER NOW

Trading is all about making informed decisions based on accurate market analysis.

The insights provided by the Hawkeye indicators can help you see the market in a new light, allowing you to make better trading decisions.

Join our training webinar to learn more about how volume and price action interact and how you can use this knowledge to your advantage.

Thank you for watching, and I look forward to seeing you in the training webinar.

Happy Trading,

Anthony Speciale

Hawkeye Traders

Big Energy Profits

Unfavorable Market Conditions in Futures

unfavorable market conditions

Identifying Unfavorable Market Conditions

Hello everyone, Anthony Speciale here with Hawkeye Traders. I hope you’re having a fantastic day.

Today, I want to discuss the Gold Futures Market and highlight an essential lesson for all traders: knowing when not to trade.

As a trader, it’s easy to get caught up in the excitement and the urge to be constantly active in the market.

However, it’s crucial to understand that not every day presents ideal trading opportunities.

This is particularly true if you’re new to trading.

The key to success is not just about finding trades but also knowing when to stay out of the market.

Identifying Non-Ideal Trading Days

Today, we observed a typical scenario in the Gold Futures Market that highlights this point perfectly.

On a five-minute chart, you can see what I call the “Chop Chop” phase—where the market isn’t moving in any significant direction.

Unless you have a highly advanced scalping strategy, this kind of market is less than desirable.

Notice the dots above and below the price action on the chart.

These represent pivot highs and pivot lows.

When these dots are close together, it indicates the market is in a consolidation phase, not trending.

Trading during these times can be risky and often unprofitable, especially for less experienced traders.

unfavorable market conditions

Recognizing Market Phases

There are distinct phases in market movements:

  • Trending Market: When pivot highs are consistently getting lower or pivot lows are getting higher.
  • Consolidation Phase: When the market moves sideways, and pivot points are close together, indicating a lack of clear direction.

During consolidation, the market is often referred to as being in “chop,” where trading can be hazardous.

Recognizing these phases is crucial. In trending conditions, such as those seen in the overnight hours, the market presents better opportunities.

The Importance of Patience and Discipline

Part of successful trading is knowing when not to trade.

This morning, Gold Futures didn’t present a trading opportunity.

Instead of forcing a trade, it’s better to wait for a more favorable market condition.

If you’re a single-market trader like I am with crude oil, and your market isn’t presenting opportunities, it’s perfectly okay to step back for the day.

Tools to Enhance Your Trading

To help you identify these market conditions, we provide Hawkeye indicators and access to the Hawkeye Volume Mastery Series.

These tools are designed to help you understand when the market is presenting opportunities and when it’s not.

The Hawkeye pivots do an excellent job of isolating areas of consolidation, so you can avoid unprofitable trades.

Join Our Training Webinar

I invite you to join our upcoming training webinar where I’ll dive deeper into these concepts. We’ll explore:

  • How to identify market phases using Hawkeye indicators
  • Understanding the Hawkeye Volume Mastery Series
  • Developing a disciplined approach to trading

During this webinar, I’ll teach you how to recognize trending and consolidating markets and confirm these conditions with volume and price action.

This education is vital for any trader looking to achieve consistent and disciplined trading results.

Register Now

Don’t miss out on this opportunity to enhance your trading skills.

Click on the link below to register for the training webinar.

Let’s dive deeper into market analysis, get the indicators on your chart, and provide you with the education you need to understand the market’s behavior.

Click here to register for the training webinar

Looking forward to seeing you in the webinar and helping you take your trading to the next level.

Stay informed, stay focused and stay disciplined ! ! !

Happy Trading,

Anthony Speciale

Hawkeye Traders

Big Energy Profits

High-Volume Reversal Meaningful Trendlines

Drawing Meaningful Trendlines At High-Volume Reversal Candles

Anthony Speciale here from Hawkeye Traders. I hope you’re having a fantastic day. 

Today, I’m excited to walk you through my morning trading ritual, providing insights into how I approach the markets and analyze price action. 

This method isn’t confined to any single market; you can apply it to stocks, futures, forex, and even cryptocurrencies.

Why I Prefer Manual Analysis

While some traders rely on computer-generated analysis, I believe in the power of manual interpretation. 

This approach allows me to make decisions based on the interaction between volume and price action. 

For instance, when drawing trend lines, I focus on where volume shows significant buyer or seller interest. 

This method ensures that my trend lines hold validity later in the session.

Analyzing the S&P 500: A Step-by-Step Guide

Today, I’ll use the S&P 500 as an example. The chart I’m analyzing is a 5-minute timeframe. Let’s break down the process:

Identifying Key Volume Points

Starting from a low point at 10:15 PM EST, I noticed a rising price trend. My goal is to identify where buyers are strongest. Here are the steps I followed:

  • Strong Buying Volume: I first noted a significant buying volume.
  • Trend Line Criteria: For a trend line to be meaningful, it should have at least three touches.

Using a tool called the Ray, which extends indefinitely, I placed my trend line origin at a notable low. 

The next significant buying volume formed my second point. 

This method allows the trend line to represent an area where significant buyers have historically stepped in.

high-volume reversal

Drawing and Interpreting Trend Lines

By connecting these points, I established a trend line. Here’s what I observed:

  • Three Touches: The trend line had multiple touches, confirming its validity.
  • Potential Support: If the price revisits this trend line, it might offer support.

Next, I reset the screen to see the broader picture. 

The price came close to the trend line, suggesting potential support. 

Cloning the trend line to include additional wicks helped define this support area.

Predicting Future Price Action

With the trend line in place, I considered two scenarios:

  • Price Bounces: If the price respects the trend line, it could bounce back up.
  • Breaks the Trend Line: If it breaks, we might target previous lows as new support levels.

For instance, if the price breaks through the trend line and neckline of a double top, potential targets could be the points where the trend line had significant buying volume.

Practical Application

This method isn’t limited to the S&P 500. 

You can apply it across various markets and timeframes. 

When drawing trend lines, focus on the areas with the highest buying or selling interest. 

This approach ensures that your trend lines are meaningful and actionable.

Using Volume for Enhanced Accuracy

Volume plays a crucial role in identifying key reversals. 

For example, a “green bottom” indicates high buying volume and potential support, while a “red top” signals high selling volume and potential resistance. 

Employing volume in your analysis can significantly improve the accuracy of your trend lines.

Join Me for a Deeper Dive

If you’re interested in exploring these concepts further, I invite you to join me for a training webinar. 

We’ll delve deeper into price action and volume theory, and I’ll show you how to get the Hawkeye indicators on your screen. 

Additionally, you’ll gain access to the Hawkeye Volume Mastery Series, a comprehensive resource to help you master the interaction between price and volume.

Click the link below to join the training webinar and start enhancing your trading skills. 

This method has been a game-changer for me and my clients, and I believe it can revolutionize your trading too.

Join the Training Webinar

I look forward to seeing you there…

Happy Trading,

Anthony Speciale 

Hawkeye Traders

Big Energy Profits

Aggressive Sellers and Market Breakdowns

aggressive sellers

How Aggressive Sellers Confirm a Low of Day Break

Anthony Speciale here with Hawkeye Traders, and I hope you’re having a wonderful day. 

Today, we’re diving into the critical concept of price breaking through a prior low, often referred to as a “breakdown.” 

Understanding this can significantly enhance your trading strategies, allowing you to make more informed decisions with a greater degree of certainty.

Identifying Key Levels

The chart we’re looking at today is a 3-minute intraday chart of light sweet crude oil futures. While this example focuses on crude oil, the principles apply to any market and timeframe, whether you’re trading stocks, futures, forex, or cryptocurrencies.

First, let’s identify a significant prior low on the chart. You can see that price initially came down to this level, where buyers stepped in and drove it back up. 

This tells us that at this point, buyers were more aggressive than sellers.

As the market approached this area again, we needed to be cautious of potential support or a failed breakdown.

Analyzing Trends and Volume

A quick look at the chart shows the highs are trending lower, indicating a downward bias. A valid trend line, constructed from multiple touches, confirms this direction.

The real insight comes from observing the volume. As the market pushed down to break the prior low, we saw an increase in selling volume. 

This is crucial because it indicates that sellers are more aggressive, adding validity to the breakdown.

aggressive sellers

The Role of Aggression

Understanding market movements boils down to recognizing the aggression between buyers and sellers. 

The market doesn’t move simply because there are more buyers or sellers; it moves because one side is more aggressive. 

Increasing selling volume confirmed the sellers’ aggression, validating the breakdown.

Confirming the Breakdown

Let’s focus on the critical breakdown moment. Despite a surge in buying volume, the price couldn’t push back through what was now a resistance level. 

This failure confirmed that the aggressive sellers were still in control. As a result, the market continued to move lower, offering a significant trading opportunity.

Practical Application

This example highlights the importance of understanding the relationship between volume and price action. 

It’s not about finding a magical indicator; it’s about reading the market’s story through volume and price. 

The Hawkeye tools simplify this process by clearly showing who the aggressive party is within each candle.

Join Our Training Webinar

To dive deeper into these concepts, I’m hosting a training webinar. We’ll explore the relationship between volume and price action, providing you with practical strategies to apply in your trading. 

You’ll gain access to the Hawkeye Volume Indicators and the Volume Mastery Series, which will help you master these principles at your own pace.

Understanding how to confirm a breakdown using volume and price action is a game-changer. It’s not about being scared of a market move; it’s about understanding why it’s happening and acting confidently.

If you’re ready to enhance your trading skills and make more informed decisions, join me in the training webinar. 

Click the link below to register, and let’s take your trading to the next level.

Click Here for Webinar Registration

I look forward to seeing you there!

Happy Trading,

Anthony Speciale

Hawkeye Traders

Big Energy Profits

Market Dynamics in Real-Time Trades

Global Market Dynamics: Lack of Buying Interest at Key Resistance Area Identified LIVE

Anthony Speciale here with Hawkeye Traders. I hope you’re having a wonderful day!

Today, I want to take you inside my trading process with a detailed breakdown of a trade I placed this morning.

This isn’t just about sharing my thought process; it’s about helping you understand how to make informed trading decisions in real-time.

In this blog post, I’ll walk you through the trade, the analysis behind it, and the outcomes, all backed by a video of the live trade.

Analyzing the Trade: Sweet Crude Oil

As many of you know, I frequently trade sweet crude oil.

This morning’s trade is a perfect example of how understanding market dynamics and volume can lead to successful trades.

market dynamics

Let’s dive into the setup:

Overnight Market Movement: During the overnight session, the market made a high but then pushed lower, failing to retake that high before continuing to sell off. This initial movement set the stage for our trade.

Identifying Key Levels: As the market pushed higher, it fell into a consolidative state. By cloning the price action, we could clearly see the resistance level where the market was unsuccessful in pushing higher. This resistance was a critical line in the sand.

Volume Analysis: One of the most telling indicators was the lack of new buying interest. Despite occasional pushes in buying volume, there was no significant momentum to break through the resistance. Instead, every push resulted in a lower high, signaling a potential sell-off.

Executing the Trade

https://vimeo.com/987134236?share=copy 

Entry Point: Recognizing the signs of weakness and lack of buying enthusiasm, I entered a short position into momentum as the market started to break down from the consolidative state.

Profit Target: I identified a support level from previous analysis and set this as my profit target. The trade played out quickly, moving about 23 ticks in my favor. Though it was a short move, it was highly rewarding due to the leverage involved.

Volume and Price Action: Throughout this trade, volume was the key indicator. The absence of strong buying volume in an area of previous resistance suggested a high probability of a price decline. This understanding allowed me to confidently execute the trade and exit with a profit.

The Bigger Picture: Volume and Price Action

This trade underscores the importance of understanding the relationship between volume and price action. Volume tells the story of market intentions, and by reading these signals accurately, you can make informed trading decisions.

Join Me for an In-Depth Training Webinar

To help you master these concepts, I invite you to join my upcoming training webinar.

In this session, we will:

  • Dive deeper into the relationship between volume and price action.
  • Analyze real-time market movements and identify trading opportunities.
  • Provide access to the Hawkeye indicators and the Volume Mastery series.
  • Discuss how to apply these strategies to your own trading.

By attending this webinar, you will gain the tools and insights needed to improve your trading performance.

You’ll learn how to identify low-risk, high-probability trades and execute with confidence.

Why You Should Attend

Understanding volume and price action is crucial for any trader looking to succeed in the markets. This webinar will provide you with practical, actionable knowledge that you can apply immediately. Whether you’re a day trader or a swing trader, these insights will help you navigate the markets more effectively.

Register Now

Don’t miss this opportunity to enhance your trading skills and learn from a seasoned professional. Register for the training webinar today and take the first step towards more successful trading.

Register Here for the Training Webinar

I look forward to seeing you there and helping you achieve your trading goals.

Happy Trading,

Anthony Speciale

Hawkeye Traders

Big Energy Profits

Failed Breakout Due to Lack of Buying Interest

buying interest

Failed Breakout Easily Identifiable Due To Lack Of Buying Interest

Anthony Speciale here with Hawkeye Traders. I hope you’re having a wonderful day.

Today, I want to dive into the recent aggressive selloff in the S&P 500 and discuss how you could have identified a failed attempt to push higher.

This insight is crucial for intraday, swing, and position traders alike.

Recognizing the Failed Breakout

Early this morning, the S&P 500 showed some interesting activity.

Overnight, the market struggled to break through the 5660 level.

At 9:05 AM, we saw a push higher, but this was where things got interesting.

As the price reached this prior high, the volume started to decline significantly.

Why is this important? Because it indicates a lack of buyer interest above that level.

If the buyers aren’t interested, there’s a high chance the market will reverse, which is exactly what happened.

This isn’t just hindsight; I identified this live, sharing my analysis with traders who were managing live money accounts.

Recognizing these patterns in real-time adds a layer of credibility and practicality to analysis.

The Power of Volume and Price Action

Understanding the interaction between volume and price action is essential for successful trading.

Many traders might see a breakout and immediately decide to buy, but without considering volume, this can lead to significant mistakes.

In our example, the failure to sustain higher prices due to declining buying interest was a clear signal that the market was likely to roll over.

By noon, the S&P 500 had dropped about 244 ticks, which is substantial.

This highlights the importance of not just recognizing price patterns, but understanding the underlying volume dynamics that drive these moves.

My Journey with Hawkeye

I want to share that I am not just a promoter; I am a paying customer of Hawkeye Traders.

My journey to understanding volume and price action was filled with challenges until I found Hawkeye.

This in-depth understanding is now a cornerstone of my trading strategy.

There’s a lot of noise in the market with various indicators and software promising wins.

However, sustainable success comes from a solid understanding of market dynamics.

That’s why I emphasize mastering the relationship between volume and price action.

Join Me for a Deeper Dive

If you’re interested in gaining a deeper understanding of these concepts, I invite you to join me for a training webinar.

In this session, we will explore the relationship between volume and price action in detail.

You’ll also get access to the Hawkeye Volume Mastery Series, a resource designed to help you learn at your own pace.

This isn’t just about adding indicators to your chart; it’s about fundamentally changing how you interpret and trade the markets.

Whether you’re a day trader, swing trader, or position trader, understanding these dynamics can revolutionize your trading.

Practical Application and Analysis

buying interest

On my charts, you’ll see hand-drawn levels and volume indicators.

While the specific levels are part of my personal analysis, the key takeaway is that volume and price action are the core components.

By hiding the drawings, what remains is the pure relationship between volume and price action, which is where the true insights lie.

Many traders might see a breakout and want to jump in, but it’s crucial to ask: Are the buyers really interested in pushing prices higher?

If not, the market is likely to reverse, as we saw today.

I encourage you to watch the video included in this blog post where I explain these concepts in real-time.

Click here to join the webinar and start your journey toward mastering volume and price action with Hawkeye.

Understanding these market dynamics has transformed my trading, and I believe it can do the same for you. I look forward to seeing you in the webinar.

Stay safe, trade smart, and God Bless!

Happy Trading,

Anthony Speciale

Hawkeye Traders

Big Energy Profits

High Selling Volume Signals Explained

High Selling Volume

High Selling Volume Into Support Triggers 170 Tick IntraDay Crude Oil Rally

Hey folks, Anthony Speciale here with Hawkeye Traders. I hope you’re doing well.

Today, I want to dive into a real-life example of trading light sweet crude oil.

As you know, this market is my passion, and I believe using real-time trades adds a layer of credibility that’s often missing elsewhere.

The Morning Setup

Recently, we had an intriguing setup on the five-minute chart. A key moment occurred at 8:05 AM when we observed high selling volume without follow-through.

This high selling volume was met with strong support at the $81.20 level, leading to an immediate rebound.

This reaction solidified my confidence in declaring $81.20 as a support level in our live trading session, predicting a potential rally from this point.

Analyzing the Market Movement

Here’s a breakdown of the market movement:

  • Initial Signal: At $81.20, we saw high selling volume into support with no follow-through. This indicated strong buying interest and the potential for a rally.
  • Double Top Formation: After setting a low and a higher low, the market formed a double top.
  • Break and Retest: The market broke through the double top and retested the support level on high selling volume, which failed to push the price lower.

This scenario exemplified the critical relationship between volume and price action.

From $81.20, the market rallied roughly 170 ticks, all thanks to accurately interpreting these signals in real-time.

High Selling Volume

Understanding Volume and Price Action

The key takeaway here is the importance of understanding the relationship between volume and price action.

Many traders might see a high selling volume as a signal to avoid going long, but in this case, it indicated that sellers were being absorbed by buyers, leading to a strong upward movement.

If you find this analysis intriguing and believe you could benefit from a deeper understanding of these concepts, I invite you to join me in a training webinar.

In this session, we’ll dive deeper into these strategies, helping you develop the skills to interpret volume and price action accurately.

Join Our Training Webinar

In the webinar, we’ll cover:

  • How to use volume-based indicators effectively.
  • The relationship between volume and price action.
  • Real-time examples to solidify your understanding.

We’ll also provide you with access to the Hawkeye Volume Mastery series, enabling you to study these concepts at your own pace and implement them in your trading strategy.

Trading successfully requires more than just indicators and software; it demands a solid understanding of market dynamics.

By focusing on volume and price action, you can develop the skills to make informed trading decisions.

I urge you to remove the clutter from your charts and concentrate on what truly matters.

I look forward to helping you master these essential trading skills.

Join the Training Webinar

Thank you for being a part of our community. I am confident that with the right tools and knowledge, you can achieve greater success in your trading endeavors.

God bless, and I will see you in the next video!

Happy Trading,

Anthony Speciale 

Hawkeye Traders

Big Energy Profits

High-Volume Areas: Keys for Intraday Moves

high-volume areas

Using Ultra High-Volume Areas to Identify Significant IntraDay Turning Points

Anthony Speciale here with Hawkeye Traders. I hope you’re having a fantastic day!

Today, I want to break down how we navigated light sweet crude oil this morning and discuss a couple of high-volume areas that I believe are meaningful. 

I’ll explain what these areas meant to me, how I interpreted them, and ultimately what the price did around them.

Analyzing Light Sweet Crude Oil Futures

On my screen, you’ll see the light sweet crude oil futures, presented on a three-minute chart.

Each candle here represents three minutes of price action. 

I’m utilizing several tools from Hawkeye, including the volume paint bar, Hawkeye pivots, Hawkeye volume, and the Hawkeye volume radar. 

These tools provide a comprehensive view of the market dynamics at play.

Identifying Key Volume Levels

During a significant downtrend, I called out the session low around 8 a.m., noting that it was the strongest volume present thus far from the overnight Globex session. 

This high buying volume indicated a potential low for the session, though it was still early in the day.

Fast forward to 9 a.m., the official crude oil market open, and we observed another high-volume area, this time marked by strong selling. 

Despite the substantial selling pressure, the market did not push through to new lows. 

Instead, it formed a higher low, which I identified live during the trading session. 

This failure to make new lows despite high selling volume was a crucial signal.

high-volume areas

Interpreting Volume and Price Action

As the session progressed, we saw the market slowly but surely chopping its way higher. By 11:18 a.m., a significant candle formed, triggering a short-term correction. 

This correction tested prior highs, which now acted as support, demonstrating the symmetrical nature of the market.

These key occurrences all showed a relationship between volume and price action.

Understanding this relationship allows traders to anticipate market moves with a greater degree of accuracy. 

The market moves on intention and aggression, not on an imbalance of buyers or sellers. This concept is crucial for interpreting market behavior.

Volume Climax and Market Reversals

One notable observation was the volume climax at 9 a.m., where despite strong selling volume, the market did not make new lows. 

This indicated that sellers exhausted their efforts without achieving a significant price drop. The market then reversed and continued to make higher lows and higher highs.

Understanding volume climax and its implications is vital. It reveals the exhaustion points of buyers or sellers and can signal a potential reversal or continuation of a trend. 

This insight can be incredibly valuable for making informed trading decisions.

Applying These Insights to Your Trading

These observations and analyses demonstrate the power of understanding volume and price action. 

By recognizing high-volume areas and interpreting their impact on price, traders can gain a significant edge. 

This edge is further enhanced with the right tools, such as those provided by Hawkeye.

To dive deeper into these concepts and learn how to apply them to your trading strategy, I invite you to join me for an exclusive training webinar. 

During this webinar, we’ll explore these ideas in greater detail, ensuring you have a thorough understanding of how to capitalize on these market dynamics.

Join the Training Webinar

We’ll also discuss how you can get access to the Hawkeye Volume Mastery series and other tools that will help you understand market movements more effectively. 

This next step could be pivotal in enhancing your trading performance.

Thank you for being here with me today!

I look forward to seeing you in the webinar, where we’ll take these insights to the next level and help you build a robust trading plan. Until then, happy trading, and God bless!

Happy Trading,

Anthony Speciale 

Hawkeye Traders

Big Energy Profits

Double-Top Reversals in Gold Futures

double-top

How To Identify A Double-Top Forming LIVE

Anthony Speciale here from Hawkeye Traders!

Today, I want to delve into a recent trading session focused on intraday gold futures.

What makes this session noteworthy is that it was conducted live in front of an audience trading live accounts, adding a layer of real-time credibility to the analysis.

This morning, we witnessed a robust rally in gold futures shortly after the opening bell.

At 10:51, there was strong buying momentum, followed by immediate price action that confirmed the movement.

This kind of follow-through is an excellent indicator of market strength.

However, understanding when a reversal might occur is crucial, especially if follow-through isn’t as strong.

Identifying Reversals with Volume

During the session, I observed a significant candle with strong buying volume, albeit not as aggressive as the initial 10:51 candle.

This discrepancy in volume raised a red flag.

When we encounter another wide bar that fails to close above the previous high on neutral volume, it signals a potential market shift.

The neutral volume indicates a balance between buyers and sellers, often preceding a sell-off. This pattern often indicates a double-top formation, a common reversal pattern traders look for.

Utilizing Hawkeye’s Tools

Hawkeye Traders provides unique tools that enhance your ability to interpret price action and volume.

For example, the Wide Bar and Volume Radar indicators help highlight critical areas of market activity.

In the session, after observing a high buying volume without subsequent strong follow-through, it became evident that the market was likely to reverse.

This was confirmed when the next candle’s volume was lower than expected, leading to a significant sell-off, solidifying the double-top pattern.

Practical Application: A Case Study

Let’s look at the specific case from the session:

  • Initial Push: Strong buying at 10:51 followed by immediate price action.
  • Second Wide Bar: This bar had less buying volume, raising concerns.
  • Third Candle: Closed below the previous high on neutral volume, indicating a balance between buyers and sellers and signaling a potential sell-off.

By recognizing these signs, we managed to ride the market down approximately 90+ ticks.

This was after a significant rally of nearly 200 ticks to the upside, demonstrating the importance of volume and price action interpretation.

double-top

The Power of Simplicity

One of the key takeaways is the power of simplicity in trading.

By focusing on critical indicators like volume and price action, you can strip away unnecessary noise from your charts.

This approach allows for clearer, more decisive trading decisions.

Join Our Training Webinar

I invite you to join me in a detailed training webinar where we will dive deeper into the relationship between volume and price action.

During this session, you will:

  • Learn how to use the Hawkeye Wide Bar and Volume indicators effectively.
  • Gain access to the Hawkeye Volume Mastery Series to study at your own pace.
  • Understand how to simplify your trading approach by focusing on what truly matters.

Click the link below to register for the webinar and start transforming your trading strategy.

By mastering these concepts, you’ll enhance your ability to predict market movements and improve your trading outcomes.

Final Thoughts

The best traders focus on volume and price action, not an overload of indicators.

Simplifying your approach can lead to more consistent and profitable trading.

Join our webinar and take the first step towards mastering these essential skills.

See you at the webinar!


Happy Trading,

Anthony Speciale

Hawkeye Traders

Big Energy Profits

Reliable Volume Data in Swiss Franc Futures

reliable volume data

Confirming a Double-Top Reversal Setup: Swiss Franc Currency Futures

Anthony Speciale here with Hawkeye Traders. I hope you’re having a wonderful day. 

In this post, we’ll delve into the Swiss Franc Futures Market using a 5-minute chart, where each candle represents 5 minutes of open market, transacted price action.

If you’re primarily a Forex trader, you might find it challenging to read volume accurately due to the decentralized nature of the Forex market. 

However, the Futures market offers a more regulated environment, providing reliable volume data that can significantly enhance your trading strategies.

Why Trade Futures Instead of Forex?

Futures markets in the United States are heavily regulated, ensuring accurate and reliable volume data. This regulation is why I personally prefer trading Futures over Forex. 

By examining the Futures market for both pairs you’re trading, you gain a clearer picture of volume and price action, enabling more confident trading decisions.

Identifying Key Market Movements

In this analysis, we focus on identifying a reversal and a potential double top formation. Let’s break down a specific instance from the 5-minute chart of the Swiss Franc Futures.

Analyzing Volume and Price Action

At 3:00 AM, we see strong buying volume, with the candle closing in the top 10-15% of its range. This indicates aggressive buying and suggests potential continuation. 

However, subsequent candles show a different story. A larger candle closes near the top, but with lower volume, signaling weakening buying pressure.

We observe a volume climax, where buyers made a final push, but the candle closes around the 50% mark of its total range. 

This suggests that if we retest this area, it might serve as a future point of failure, as the initial buying effort was not strong enough to sustain higher prices.

reliable volume data

Recognizing a Double Top

The market falls back with low volume, attempts to recover, and pushes back up. 

Despite a large candle closing near the top, the volume remains low. 

This lack of supporting volume indicates a weakening buying interest, setting the stage for a potential reversal.

Ultimately, we see a double top formation, with the neckline representing the low between the two peaks. 

Price breaks down, retests, and continues lower, confirming the double top pattern.

Practical Application

As a trader, you could have taken two approaches:

  • Shorting at the volume climax with a stop above the candle’s high, aiming for the neckline as the target, offering a favorable risk-reward ratio.
  • Shorting on the retest of the wick with significantly lower buying volume, again targeting the neckline.

Both strategies capitalize on understanding the relationship between volume and price action, essential for successful trading.

The Hawkeye Advantage

At Hawkeye Traders, we emphasize the critical relationship between volume and price action. 

Our tools, such as the Hawkeye Volume Mastery Series, help you understand this relationship, making it easier to identify market aggressors and potential opportunities.

Join our training webinar to dive deeper into these concepts.

We’ll explore practical examples and show you how to apply these principles using our Hawkeye indicators on various charting platforms like TradeStation, TradingView, NinjaTrader, and MetaTrader.

Understanding volume and price action is crucial for making informed trading decisions.

By leveraging reliable volume data from the Futures market and using tools like Hawkeye, you can enhance your trading strategies and increase your chances of success.

Click the link below to join our training webinar and start mastering the relationship between volume and price action. Let’s simplify and amplify your trading together.

Join the Training Webinar

Thank you for your time, and I look forward to seeing you in the webinar…

Happy Trading,

Anthony Speciale

Hawkeye Traders

Big Energy Profits

How to Confirm a Breakdown with Volume

breakdown

How to confirm a low of day break followed by continuation

Anthony Speciale here with Hawkeye Traders, and I hope you’re having a wonderful day. 

Today, we’re diving into the critical concept of price breaking through a prior low, often referred to as a “breakdown.” 

Understanding this can significantly enhance your trading strategies, allowing you to make more informed decisions with a greater degree of certainty.

Identifying Key Levels

The chart we’re looking at today is a 3-minute intraday chart of light sweet crude oil futures. While this example focuses on crude oil, the principles apply to any market and timeframe, whether you’re trading stocks, futures, forex, or cryptocurrencies.

First, let’s identify a significant prior low on the chart. You can see that price initially came down to this level, where buyers stepped in and drove it back up. 

This tells us that at this point, buyers were more aggressive than sellers.

As the market approached this area again, we needed to be cautious of potential support or a failed breakdown.

Analyzing Trends and Volume

A quick look at the chart shows the highs are trending lower, indicating a downward bias. A valid trend line, constructed from multiple touches, confirms this direction.

The real insight comes from observing the volume. As the market pushed down to break the prior low, we saw an increase in selling volume. 

This is crucial because it indicates that sellers are more aggressive, adding validity to the breakdown.

breakdown

The Role of Aggression

Understanding market movements boils down to recognizing the aggression between buyers and sellers. 

The market doesn’t move simply because there are more buyers or sellers; it moves because one side is more aggressive. 

Increasing selling volume confirmed the sellers’ aggression, validating the breakdown.

Confirming the Breakdown

Let’s focus on the critical breakdown moment. Despite a surge in buying volume, the price couldn’t push back through what was now a resistance level. 

This failure confirmed that the aggressive sellers were still in control. As a result, the market continued to move lower, offering a significant trading opportunity.

Practical Application

This example highlights the importance of understanding the relationship between volume and price action. 

It’s not about finding a magical indicator; it’s about reading the market’s story through volume and price. 

The Hawkeye tools simplify this process by clearly showing who the aggressive party is within each candle.

Join Our Training Webinar

To dive deeper into these concepts, I’m hosting a training webinar. We’ll explore the relationship between volume and price action, providing you with practical strategies to apply in your trading. 

You’ll gain access to the Hawkeye Volume Indicators and the Volume Mastery Series, which will help you master these principles at your own pace.

Understanding how to confirm a breakdown using volume and price action is a game-changer. It’s not about being scared of a market move; it’s about understanding why it’s happening and acting confidently.

If you’re ready to enhance your trading skills and make more informed decisions, join me in the training webinar. 

Click the link below to register, and let’s take your trading to the next level.

Click Here for Webinar Registration

I look forward to seeing you there!

Happy Trading,

Anthony Speciale

Hawkeye Traders

Big Energy Profits

Spotting Trends with Buying Volume

Buying volume

Lack of Buying Interest at Prior Highs Triggers Opening Bell Short Play

Hello traders, Anthony Speciale here with Hawkeye Traders. I hope you’re having a fantastic day. 

Today, I want to share a live trade I executed, alongside other traders using live money. 

This detailed walkthrough of my thought process will illustrate how I identify and react to trading opportunities based on the relationship between volume and price action.

The Power of Volume and Price Action

Understanding the interaction between volume and price action is crucial for trading. 

Once you grasp this relationship, it becomes almost instinctive to identify profitable trades. 

Today’s trade on light sweet crude oil (on a 5-minute chart) serves as a perfect example.

Identifying Key Market Levels

Early in the session, around 5:30 AM New York time, the market hit the session’s high and sold off. 

It made several attempts to break this high but failed each time. 

The market surged into this supply area right after the 9:00 AM open, only to face significant resistance.

The Crucial 9:05 Candle

Buying volume

What stood out was the 9:05 AM candle. 

Despite a significant increase in buying volume, the market failed to break the supply area. 

This is a fundamental concept in trading: understanding supply and demand zones where buyers and sellers dominate. 

The inability to surpass this high, despite strong buying volume, was a clear signal to me.

Strategic Timing and Execution

I avoid entering trades right at the 9:00 AM or 9:30 AM opens due to heightened volatility.

After the 9:30 AM open, I observed a surge in selling volume, reinforcing my conviction that the market would likely test the session lows. 

I targeted a specific support area that had been tested multiple times, signaling a potential breakdown.

Trade Execution and Management

I entered the trade anticipating a drop to the session lows. 

The market, indeed, fell through, validating my analysis. 

I moved my stop quickly to break even to manage risk. 

The trade played out as expected, offering a significant profit opportunity.

Learning from Live Trades

I encourage you to watch the accompanying video in the blog post. It shows the trade’s entry, exit, and my rationale in real-time. 

Seeing the highest buying volume of the session with no follow-through was a red flag. As soon as selling gained momentum, I capitalized on the move.

The Importance of Simplicity in Trading

Trading doesn’t need to be complicated. 

Traders clutter their charts with indicators like MACDs or Bollinger Bands, losing clarity. 

Trading on a “naked chart” – one devoid of unnecessary indicators – allows for a clearer interpretation of the market. Understanding price action and volume is paramount.

Invitation to Deepen Your Trading Knowledge

If you’re intrigued by this approach and want to master the relationship between volume and price action, join our training webinar. 

We’ll delve deeper into these concepts and get these powerful indicators on your trading platform, whether you use TradeStation, NinjaTrader, TradingView, or MetaTrader.

Additionally, you’ll gain access to the Hawkeye Volume Mastery Series, a comprehensive resource designed to enhance your trading skills at your own pace. 

This series will help you build a solid foundation in understanding volume and price action, leading to more informed and profitable trading decisions.

Take the Next Step in Your Trading Journey

Don’t miss this opportunity to elevate your trading skills. 

Click the link below to register for the training webinar. 

This session will be the first step in transforming your approach to trading. 

Following the webinar, we’ll assist you in integrating these indicators into your platform and provide ongoing education through the Hawkeye Volume Mastery Series.

Register for the Training Webinar

Join me, and let’s unlock the full potential of volume and price action trading together. Your path to trading success starts here.

Thank you for being here today. Feel free to reach out with any questions. We are here to support you. God bless, and I look forward to seeing you in the next video.

Happy Trading,

Anthony Speciale

Hawkeye Traders

Big Energy Profits

Economic Data Rally Signals Trading Opportunity

economic data rally

Shorting Economic Data Rally Based On Hawkeye WideBar And Volume Climax

Anthony Speciale here with Hawkeye Traders. I hope you’re having a fantastic day! 

I wanted to take a moment to share a trade setup I executed this morning, breaking down my thought process and the key factors that led to a successful outcome. 

I’ve also included a video below showcasing the latter part of this trade in action.

The Morning Setup

At 8:30 AM Eastern Standard Time, we had significant economic data releases: unemployment claims and CPI numbers. 

These reports created an intraday trade setup for light sweet crude oil futures. 

For this analysis, I’m using a 5-minute chart, meaning each candle represents 5 minutes of price action.

Key Indicators and Decision Making

Following the economic data release, we observed two wide bars back-to-back, signaling strong market movements. 

This observation became instrumental in my decision-making process and that of others trading live with me.

I pointed out that we would likely face resistance in this area. 

Specifically, I noted that if we couldn’t close above the 8:30 candle, there was a strong chance that prices would fall back to $82, and subsequently to $81.80. 

These predictions were based on our technical indicators and historical price movements.

The Trade Execution

Here’s how it unfolded:

  • First Target: $82
  • Second Target: $81.80

From the high of the wide bar candle, there was an opportunity to capture approximately 50 ticks of profit followed by another 70 ticks. 

The price did indeed fall to our predicted levels, providing a lucrative intraday setup.

Why I Believed the Market Wouldn’t Go Higher

The decision to anticipate a price drop was reinforced by witnessing a volume climax. 

At 8:30, there was an ultra-high surge in buying volume, marked by a red volume radar dot and a wide bar print. 

This scenario is a textbook example of a potential reversal, regardless of whether it’s temporary or for the entire session.

Recognizing this, I alerted LIVE traders that crude oil might struggle to push higher. 

The market did fail to close above the 8:30 candle, as anticipated, and subsequently fell to our targeted prices.

Understanding the Volume and Price Relationship

One crucial concept that helped in this trade is understanding the relationship between volume and price action. 

High buying volume with no follow-through often indicates a potential reversal. 

This pattern, combined with our technical indicators, made it clear that the market was likely to decline.

economic data rally

Source: TradingView

Invitation to Learn More

I believe that mastering the relationship between volume and price action is vital for any trader. 

Below, I’ve included a link to a webinar where we can dive deeper into this topic. 

By understanding these concepts, you’ll gain a leading edge in predicting market movements, whether you’re day trading, swing trading, or position trading.

The indicators discussed in this setup work across various platforms including TradeStation, TradingView, NinjaTrader, and MetaTrader, and are applicable to stocks, futures, forex, and cryptocurrencies.

Join Us for a Webinar

I invite you to join me in the webinar to explore these concepts further. 

Click the link below to register. Let’s get these indicators working on your charts and enhance your trading strategy.

Register for the Webinar

I look forward to seeing you there and in our future videos. Thank you for being part of our trading community. God Bless!

Happy Trading,

Anthony Speciale

Hawkeye Traders

Big Energy Profits

NASDAQ Reversal Identified by Hawkeye

NASDAQ reversal

150 TICK Nasdaq 100 Reversal Identified By Hawkeye WideBar

Welcome traders! I’m Anthony Speciale with Hawkeye Traders, and today I want to dive into an insightful discussion about the NASDAQ 100.

This is especially for our intraday traders who are always on the lookout for potential market shifts. The key to understanding these shifts lies in one crucial element: volume.

The NASDAQ’s Impressive Uptrend

Recently, the NASDAQ 100 has been in a significant uptrend. Despite some morning volatility, the market broke past a prior high and surged nearly 400 ticks.

It’s been a substantial move, and naturally, we all wish we could perfectly time the top and bottom of these trends.

However, trading isn’t about being right; it’s about making informed decisions based on evidence. This evidence comes from the relationship between volume and price action.

Recognizing Market Signals

Let’s break down a recent market scenario. The NASDAQ made a strong push upward, eventually hitting a period of consolidation.

During this consolidation, our Hawkeye Pivots indicated resistance and support levels, leading to a notable breakout on high buying volume.

This breakout formed what we call a “wide bar.” A wide bar is a critical signal for traders.

It indicates something abnormal in the market, often leading to immediate or significant reversals.

In this instance, after the wide bar appeared, the market saw a reversal, testing previous resistance and support levels.

This volume climax—a sudden, substantial increase in volume—screamed short-term or session reversal to me.

NASDAQ reversal

Source: TradingView

Making Informed Decisions

Seeing a volume climax should trigger a thought process for any trader.

If you’re long on the NASDAQ and witness this, it might be time to take profits or tighten your stop.

It’s about having a plan and knowing how to react when the market gives you these signals.

For instance, if the next candle closes above the wide bar, we might expect continued upward momentum. If not, NASDAQ reversal could be imminent.

During our LIVE session, we saw the market fall back after testing the high of the wide bar, reinforcing its potential significance as a session high.

The Importance of Volume and Price Action

Understanding the interplay between volume and price action is crucial. It can save you from significant losses and help you capitalize on market movements.

For example, had you recognized the wide bar and taken action, you could have avoided a 145-tick drop, protecting your profits or even considering a reversal trade.

Join Our Webinar

To help you master this relationship, I’m offering a webinar where we’ll dive deeper into the dynamics between volume and price action.

In this session, I’ll show you how to use our indicators on various trading platforms, whether you trade stocks, futures, forex, cryptocurrencies, or options.

The insights you’ll gain are game-changing.

Below this post, you’ll find a link to join the webinar.

Volume and price action are foundational to successful trading.

As someone who has tested numerous strategies, I can attest to the power of focusing on these elements.

Our Hawkeye indicators have transformed my trading, and I’m excited to share this knowledge with you.

In the webinar, you will:

  • Learn how to identify volume climaxes and potential market reversals.
  • Understand the importance of multi-timeframe analysis.
  • Discover how to use the Hawkeye indicators effectively on various trading platforms, including TradeStation, TradingView, NinjaTrader, and MetaTrader.
  • Gain access to the Hawkeye Volume Mastery series, a comprehensive library designed to enhance your trading skills.

Trading with a clear understanding of volume and price action, supported by reliable indicators, can give you a significant edge in the market.

By focusing on these core principles, you can develop a robust trade plan and improve your overall trading performance.

If you’re ready to take your trading to the next level, click here to join the training webinar.

Bring a notebook, jot down your questions, and reach out to us with any inquiries.

Let’s get the Hawkeye Volume Indicators set up on your charts and you access to the Hawkeye Volume Mastery Library so we can start mastering the market together!

We look forward to helping you revolutionize your trading journey.

Click Here to join the webinar and take the first step towards a more straightforward and effective trading strategy.

Thank you for being here, and I look forward to seeing you in the next video. God Bless!

I look forward to seeing how these insights will benefit your trading journey!

Happy Trading,

Anthony Speciale 

Hawkeye Traders

Big Energy Profits

Gold Prices Drop: Live Trading Insights

gold prices drop

Calling GOLD’s Pre-Market Session Low LIVE: Gold prices drop

Anthony Speciale here with Hawkeye Traders. I hope everyone is having a wonderful day.

Today, I want to share some valuable insights from our live trading session this morning, focusing on the gold futures market. 

This detailed analysis will provide you with actionable knowledge that you can incorporate into your own trading strategies.

Understanding the Market Setup

This morning, I gathered LIVE with some traders at 8:00 a.m. to analyze the gold futures market using a three-minute chart, where each candle represents three minutes of price action. 

Initially, we noticed the market plateauing at an upper resistance level, struggling to make a significant push higher. 

This led to a series of price pullbacks and a hard time breaking through the current level.

Key Moment: The Hawkeye Wide Bar

During the session, we identified a crucial moment marked by a Hawkeye Wide Bar. 

This bar signaled a significant increase in selling volume. 

As price declined, the volume trended upwards, culminating in an ultra-high volume radar dot. 

Despite this selling pressure, the market failed to close that candle within the bottom 10% of the wide bar, indicating potential support and a likely reversal.

gold prices drop

Source: TradingView

Analyzing the Reversal

From the close of this significant candle, the market rallied 144 ticks leading up to the 10:00 a.m. economic statements by Fed Chair Powell and Treasury Secretary Janet Yellen. 

This reversal move was a key opportunity for traders who recognized the setup.

Trading Strategy Insights

The critical lesson here is understanding how to identify potential lows using volume and price action analysis. 

While trading with the trend is essential for beginners, seasoned traders can benefit significantly from spotting reversal opportunities. 

These moves, though riskier, often yield the highest returns.

Risk and Reward

For this particular trade, the potential risk was about 14 ticks, with a reward of 144 ticks—offering a 10:1 risk-to-reward ratio. 

Mastering these setups requires understanding the market dynamics and using tools like Hawkeye Volume Indicators, which simplify the process by highlighting key volume and price interactions.

Your Path Forward

To help you master these techniques, we offer comprehensive training that delves deeper into identifying market tops and bottoms. 

This training includes the Hawkeye Volume Mastery Series, designed to equip you with the skills to spot these opportunities across various market conditions and time frames.

In the webinar, you will:

  • Learn how to identify volume climaxes and potential market reversals.
  • Understand the importance of multi-timeframe analysis.
  • Discover how to use the Hawkeye indicators effectively on various trading platforms, including TradeStation, TradingView, NinjaTrader, and MetaTrader.
  • Gain access to the Hawkeye Volume Mastery series, a comprehensive library designed to enhance your trading skills.

Trading with a clear understanding of volume and price action, supported by reliable indicators, can give you a significant edge in the market. 

By focusing on these core principles, you can develop a robust trade plan and improve your overall trading performance.

If you’re ready to take your trading to the next level, click here to join the training webinar.

Bring a notebook, jot down your questions, and reach out to us with any inquiries. 

Let’s get the Hawkeye Volume Indicators set up on your charts and you access to the Hawkeye Volume Mastery Library so we can start mastering the market together!

We look forward to helping you revolutionize your trading journey. 

Gold prices drop often precede strategic trading opportunities, especially when coupled with insightful volume analysis.

Click Here to join the webinar and take the first step towards a more straightforward and effective trading strategy.

Thank you for being here, and I look forward to seeing you in the next video. God Bless!

Happy Trading,

Anthony Speciale

Hawkeye Traders

Big Energy Profits

Real-Time Session Low Analysis with Volume

session low

Identifying A Potential Session Low On Multiple Intraday Timeframes

Anthony Speciale here with Hawkeye Traders, and I’m thrilled to share some invaluable insights from my personal trading experience this morning.

This isn’t just about placing trades; it’s about developing a strategic approach that maximizes your potential in the market.

Every morning, I follow a specific ritual to prepare myself for the trading day ahead.

When I first log into my trading terminal, I dedicate at least 30 minutes to simply observing the market.

This crucial period allows me to get a feel for the market’s movements without the pressure to place an immediate trade.

This habit has significantly improved my trading discipline and decision-making process.

One of the key rules in my trade plan is to take this initial observation time seriously.

During this period, I assess the market conditions, check the economic news calendar, and mark up my charts for any potential volatility that may arise from upcoming events.

This practice helps me anticipate market movements and avoid unnecessary risks.

In today’s LIVE session, I focused on the light sweet crude oil futures contract.

session low

I primarily use five and three-minute charts for short-term trading, while also referencing higher time frames like the weekly, daily, and four-hour charts.

For today’s analysis, the three-minute and five-minute charts played a crucial role in identifying key market signals.

At 6:12 a.m. EST on the three-minute chart and 6:10 a.m. EST on the five-minute chart, I observed significant volume activity that caught my attention.

Using Hawkeye volume indicators, I noticed high selling volume followed by a doji candle on the five-minute chart.

This combination suggested a potential volume climax, indicating a possible reversal in the downtrend that had been present since the Globex open.

Understanding the relationship between volume and price action is essential.

Volume is the only leading indicator in the market, and mastering it can transform your trading approach.

The Hawkeye indicators simplify this complex relationship, allowing you to see market movements from a perspective that many traders overlook.

As the morning progressed, the market confirmed my initial observations.

The high selling volume was not followed by a significant price decline, suggesting that the sellers were losing momentum.

This insight helped me identify a session low and anticipate a reversal.

Later in the session, I took two short trades off a resistance level at 82.80.

Both trades were profitable, although I had to manage the second one around a scheduled doctor’s appointment.

The first trade was cut short as the market reversed, but I re-entered the trade and took another short, which also yielded positive results.  

Here’s how the 2nd trade transpired:

It’s important to note that my trading decisions were informed by a thorough understanding of volume and price action.

I also maintained a meticulous trading journal, noting significant observations and potential market moves.

For instance, I had written down that the 6:10 a.m. low could be a significant session low, and this proved to be a valuable reference throughout the day.

To help you understand and apply these principles in your trading, I invite you to join our training webinar.

This webinar will provide a deep dive into the interaction between volume and price action, using the Hawkeye indicators to simplify your analysis and improve your trading outcomes.

In the webinar, you will:

  • Learn how to identify volume climaxes and potential market reversals.
  • Understand the importance of multi-timeframe analysis.
  • Discover how to use the Hawkeye indicators effectively on various trading platforms, including TradeStation, TradingView, NinjaTrader, and MetaTrader.
  • Gain access to the Hawkeye Volume Mastery series, a comprehensive library designed to enhance your trading skills.

Trading with a clear understanding of volume and price action, supported by reliable indicators, can give you a significant edge in the market.

By focusing on these core principles, you can develop a robust trade plan and improve your overall trading performance.

If you’re ready to take your trading to the next level, click on the link below to join the training webinar.

Bring a notebook, jot down your questions, and reach out to us with any inquiries.

Let’s get the Hawkeye Volume Indicators set up on your charts and grant you access to the Hawkeye Volume Mastery Library so we can start mastering the market together!

We look forward to helping you revolutionize your trading journey.

Click Here to join the webinar and take the first step towards a more straightforward and effective trading strategy.

Thank you for being here, and I look forward to seeing you in the next video. God Bless!

Happy Trading,

Anthony Speciale

Hawkeye Traders

Big Energy Profits

Trade Smart with Volume and Price Action

volume and price action

Do You Understand The Relationship Between Volume & Price Action?

Welcome, fellow traders! I’m Anthony Speciale with Hawkeye Traders. I hope you’re having a wonderful day. In today’s blog post, I want to dive into a crucial topic: identifying significant highs and lows in the market by understanding volume activity. 

By mastering this, you can better predict market movements, leading to more profitable trading decisions.

When you understand what volume is doing, you’ll often notice patterns where a low corresponds to a selling candle and a high to a buying candle. 

This isn’t always consistent, but recognizing these relationships helps you comprehend market behavior. 

You might wonder why the market didn’t move lower despite selling during a pullback or didn’t move higher despite buying at a high. 

Let’s explore this through a detailed analysis of the SPY daily chart.

In the chart below, each candle represents one day of trading activity. 

The bottom section shows Hawkeye volume, while the price action is depicted by our volume paint bar and wide bar with pivots.

Analyzing Pullbacks and Corrections

On January 5th, we observed a pullback. 

Notably, the selling volume decreased during this correction. 

Despite the strong presence of sellers, the candle closed higher than it opened, indicating buyer absorption. 

This divergence signals a potential reversal, which was confirmed by the following up day with increased volume.

Volume Patterns and Market Trends

When analyzing volume patterns, it’s essential to observe both increases and decreases in volume relative to price movements. 

For instance, if the market makes a new high on decreasing volume, it suggests a potential correction. 

Conversely, a new high on increasing volume indicates a strong trend continuation.

Practical Example

On March 15th, we saw a significant pullback with high selling volume. 

However, the candle did not close below the previous low, signaling buyer strength. 

This pattern often indicates a strong support level where buyers are stepping in to absorb sell orders, pushing the market higher.

Identifying Market Reversals

Spotting reversals is critical. For example, if we see increasing volume without the ability to close above a prior high, it suggests a brewing reversal. 

A notable instance was when the market failed to close above a high after four days of increasing buying volume. 

This weak candle signaled a significant reversal, leading to a 5.5% market drop.

The Role of Support and Resistance

Support and resistance levels play a pivotal role in market movements.

For instance, a high selling volume at a support level indicates seller exhaustion, with buyers ready to absorb the selling pressure. 

This often results in a market bounce from the support level.

The Market’s Three Phases

  • Trending: The market moves consistently in one direction.
  • Consolidating: The market trades within a range.
  • Reversing: The market changes direction after a trend.

Understanding these phases helps you align your trades with the overall market direction. For example, during an uptrend, look for corrections to find low-risk entry points, thereby minimizing risk and maximizing returns.

Practical Trading Tips

  • Stay with the Trend: In a trending market, avoid shorting. Instead, look for corrections to enter trades.
  • Identify Significant Volume Changes: Pay attention to volume spikes and drops as they often precede price movements.
  • Use Support and Resistance Levels: Recognize these levels to anticipate market bounces or breaks.

Intraday Trading: Volume and Price Action

Intraday trading requires the same principles. 

Analyzing volume and price action on shorter time frames helps identify intraday trends and reversals. 

For instance, observing increasing volume during a correction that fails to push prices lower indicates potential buyer strength.

Attend Our Volume and Price Action Training Webinar

Understanding the relationship between volume and price action is essential for successful trading. 

By focusing on significant volume changes, support and resistance levels, and market phases, you can make informed trading decisions.

To deepen your understanding, join our training webinar where we dive further into volume and price action analysis. 

Our indicators work across various platforms, including TradeStation, TradingView, NinjaTrader, and MetaTrader. Whether you trade stocks, futures, forex, cryptocurrencies, or options, mastering these concepts will give you a trading edge.

Thank you for reading. I hope you found this guide beneficial. God Bless!

Stay tuned for more useful trading insights…

Happy Trading,

Anthony Speciale

Hawkeye Traders

Big Energy Profits

Mastering Absorption Analysis in Markets

absorption

Identifying Areas Of Buying and Selling Absorption [CAKE]

Hello, traders! Anthony Speciale here from Hawkeye Traders, and I hope you’re having a fantastic day. Today, we’re diving into an insightful analysis of the Cheesecake Factory (ticker: CAKE) using a daily chart. 

Our goal is to understand how to identify absorption using the Hawkeye methods and the Hawkeye Volume indicator. This technique can be pivotal in your trading strategy, allowing you to make informed decisions with confidence.

Understanding Absorption in Trading

Let’s start by marking off the previous highs on the chart. These high points often act as significant resistance levels. If the price struggled to break through these levels before, it’s likely to face similar challenges again. 

As we observe the recent price action, we see buying volume pushing into these prior highs, followed by an aggressive fallback. This isn’t entirely surprising but offers a crucial lesson.

On the next approach to these highs, notice something important: consistent buying volume without any follow-through. This should raise a red flag. 

Whether on a daily chart or a five-minute chart, such behavior indicates that buyers are being absorbed by sellers at this level. Sellers perceive this as a value area to short or exit their long positions.

Recognizing Absorption in Market Highs and Lows

This concept of absorption works both ways. Look at the market lows, where you’ll typically see a lot of selling volume. If the price isn’t breaking down further despite high selling volume, it indicates that buyers are stepping in, absorbing the sellers’ pressure. Understanding this inverse relationship is crucial for anticipating market reversals.

absorption

The Power of Hawkeye Indicators

The Hawkeye indicators make this process straightforward. By printing the actual volume within each candle, we can see exactly what’s happening in real-time. 

My screen shows the proprietary Hawkeye volume, price action, Hawkeye pivots, and volume radar dots. It’s a clean setup, free of unnecessary clutter, focusing only on the critical relationship between volume and price action.

Many traders struggle with consistency because their charts are overloaded with lagging indicators. The key to success lies in simplifying your analysis. 

At Hawkeye, we emphasize understanding the interplay between volume and price action. This knowledge is applicable across all time frames, whether you’re day trading or swing trading.

Simplifying Your Trading Approach

Most traders have overly complex charts filled with numerous indicators. This often leads to confusion and inconsistent trading results. The solution is simple: strip your charts down to the essentials—volume and price action. 

This minimalist approach will help you focus on what truly matters.

As someone who once struggled with cluttered charts, I can confidently say that adopting the Hawkeye tools transformed my trading. It allowed me to read the market with clarity and precision. Now, I want to share this game-changing approach with you.

Join Our Training Webinar

To help you grasp these concepts further, I invite you to join our training webinar. Click on the link below, grab a pen and paper, and get ready for an in-depth exploration of volume and price action. 

During the webinar, we’ll answer any questions you have and show you how to get the Hawkeye indicators up and running on your platform.

Our indicators are compatible with NinjaTrader, TradeStation, TradingView, and MetaTrader, supporting various markets, including stocks, futures, forex, cryptocurrencies, and options. 

Whether you’re a day trader, swing trader, or position trader, the principles of volume and price action remain consistent across all time frames.

Transform Your Trading Journey

By simplifying your charts and focusing on volume and price action, you’ll gain a clearer understanding of market dynamics. 

This approach not only enhances your trading accuracy but also makes the process more predictable and less stressful.

We look forward to helping you revolutionize your trading journey. 

Click Here to join the webinar and take the first step towards a more straightforward and effective trading strategy.

Thank you for being here, and I look forward to seeing you in the next video. God Bless!

Happy Trading,

Anthony Speciale

Hawkeye Traders

Big Energy Profits

How to Navigate Trending Markets Effectively

Trending markets

Mastering Trend Entry Using Hawkeye Volume

Welcome, everyone! Anthony Speciale here from Hawkeye Traders. 

In today’s video, we’re diving deep into the art of entering a trending market, specifically focusing on the NASDAQ 100 on a 5-minute intraday timeframe. 

Each candle you see represents 5 minutes of price action, offering valuable insights into how to navigate and capitalize on trends effectively.

Understanding Trending Markets

Entering a trending market involves strategically identifying pullbacks or corrections where you can initiate trades to ride the trend’s momentum. 

This approach not only maximizes profit potential but also minimizes risk by aligning with the prevailing market direction.

Analyzing with Hawkeye Volume

One of the key tools we leverage is the Hawkeye Volume indicator, which simplifies the process of identifying market sentiment. 

Here’s how it works: during pullbacks or consolidations, we look for candles that close green, indicating the presence of buyers stepping in to support the price. 

This bullish confirmation is crucial as it signals a potential continuation of the upward trend.

Conversely, when the market shows signs of hesitation or a pullback with high selling volume, it suggests a temporary pause or a reversal point. 

This insight guides our decision-making process, ensuring that we enter trades when buyers are in control and the trend momentum remains intact.

Trending markets

Practical Application of Hawkeye Indicators

The Hawkeye software suite provides comprehensive tools like the Hawkeye Paint Bar, Wide Bar, Volume Radar Dots, and Pivots. 

These indicators paint a clear picture of market dynamics directly on your trading screen, allowing you to make informed trading decisions based on volume and price action correlations.

Steps to Enhance Your Trading Skills

To deepen your understanding of these principles, I encourage you to click on the training webinar link below this video. 

In the webinar, we’ll delve into the intricate relationship between volume and price action, equipping you with the knowledge to identify optimal entry points in trending markets.

By mastering these concepts, you’ll gain confidence in navigating any timeframe and recognizing who controls the market—buyers or sellers. 

This strategic approach not only enhances your trading precision but also aligns your trades with the prevailing market sentiment for optimal results.

JOIN Training Webinar NOW

Trading in trending markets requires a disciplined approach rooted in understanding volume dynamics and market sentiment. 

At Hawkeye Traders, our goal is to empower retail traders like you to trade with confidence and clarity.

Join us on this journey to elevate your trading skills.

Click on the webinar link, absorb the content, and feel free to reach out with any questions. Let’s equip you with the tools and knowledge from the Hawkeye Volume Mastery Series, enabling you to trade like a seasoned professional.

Thank you for watching, and I look forward to seeing you excel in your trading endeavors. Stay tuned for more insights and strategies in our upcoming videos. 

Have a fantastic day, and remember, at Hawkeye, we’re here to support your trading journey every step of the way.

Happy Trading,

Anthony Speciale

Hawkeye Traders

Big Energy Profits

Live Intraday Crude Oil Trading Strategy

Trading strategy

Interpreting The Intraday Crude Oil Market Using Hawkeye Volume Trading Strategy

Hey traders, Anthony Speciale here from Hawkeye Traders. 

Today, I want to take you through a detailed analysis of a recent intraday trade I took in the Light Sweet Crude Oil market. 

This blog post will walk you through the setup, decision-making process, and outcomes, offering insights that can help you enhance your trading strategy.

Analyzing the Market Setup

I started by analyzing the 5-minute chart, which showed a clear downtrend with lower lows and lower highs. 

This bearish pattern set the stage for potential trading opportunities, focusing my attention on key support and resistance levels.

Key Entry Points and Volume Analysis

What caught my attention was a significant consolidation phase near a crucial support level, accompanied by high buying volume that prevented further downward movement. 

This consolidation hinted at potential exhaustion among sellers, prompting me to look for a reversal or continuation setup.

Volume played a critical role in my decision-making process. 

I observed moments of intense selling followed by strong buying volume, particularly around pivotal price levels. 

These volume patterns provided confirmation for my trading thesis and boosted my confidence in the trade setup.

Executing the Trade Strategy

I entered a short position following a highly bearish candle at 10:30 AM, coinciding with a bullish inventory report release. 

The candle, characterized by its large red body and exceptionally high selling volume, validated my decision to go short.

Risk Management and Profit Taking

Although I anticipated a deeper retracement towards a higher timeframe support level at 82.42, the market paused slightly above at 82.46 before reversing. 

Despite missing my target by a few ticks, I managed to secure profits as the market continued its downward trend. 

Adjusting my stop-loss to break even once the trade showed profitability was key in managing risk effectively.

Market Response and Trade Outcome

Following the initial selloff, the market swiftly rotated as bullish sentiment from the inventory report took hold. 

This quick turnaround underscored the volatility of intraday trading, where news events can rapidly alter market dynamics.

Trading strategy

Lessons Learned and Moving Forward

This trade experience taught me valuable lessons in interpreting volume dynamics and aligning with market sentiment. 

Understanding these nuances can significantly enhance your trading edge, enabling you to identify high-probability setups with confidence.

Take Your Trading Skills Further

To deepen your understanding of intraday trading strategies and learn advanced techniques for interpreting volume patterns, I invite you to join our upcoming training webinar at Hawkeye Traders

This webinar will equip you with the tools and insights needed to navigate today’s dynamic markets successfully.

My trade example highlights the importance of disciplined analysis and strategic decision-making in intraday trading. 

By integrating volume analysis and adapting to market conditions, you can elevate your trading skills and achieve consistent profitability.

Ready to take your trading to the next level? 

CLICK HERE to register for our upcoming webinar and embark on your journey to mastering intraday trading with Hawkeye Traders.

Thank you for joining me in this insightful exploration of intraday trading strategies. 

I look forward to seeing you succeed in your trading endeavors.

Happy Trading,

Anthony Speciale 

Hawkeye Traders

Big Energy Profits

Real-Time Market Analysis Strategies With WTI

real-time market analysis

Real-Time Market Analysis: Calling WTI’s Session High LIVE Using Hawkeye Volume

Hello, fellow traders! Anthony Speciale here with Hawkeye Traders. I hope you’re all having a wonderful day. Today, I want to share an exciting real-time market analysis setup we identified this morning as it unfolded. This isn’t about hindsight or theoretical lessons—this is about actionable insights that happened live in the market.

The Setup: Crude Oil Highs

We’re focusing on Light Sweet Crude Oil, specifically analyzing a three-minute chart. Each candle represents three minutes of price action. This morning, we pinpointed a high in real-time, and I’m eager to show you how we did it.

Identifying the Trend

As many of you know from previous videos, I’m a fan of drawing simplistic trend lines to spot potential price movements. By getting three or four touches on a trend line, we can anticipate market behavior. This method played a crucial role in identifying today’s high.

Key Candle Insights

Pay close attention to the 8:42 AM candle, a doji-style candle indicating indecision. What made this candle significant was the strong increase in selling volume as we pushed higher. This candle signaled a potential resistance point, a warning to be cautious about further upward movement.

As time passed, the market showed a mix of buying and selling, but the 9:00 AM candle brought another spike in selling volume. This increased selling volume, combined with an unsuccessful attempt to push higher, indicated that the market might have reached its peak for the session.

real-time market analysis

LIVE Market Analysis, Interpretation and Expectations

I identified this setup live in front of traders with active accounts, emphasizing the high probability of a market sell-off from this high. Personally, I took this trade, knowing the risk involved. If the market had closed above the identified high, my analysis would have been incorrect, and I would have exited the trade. However, my prediction held true, leading to a significant downward movement.

Multiple Time Frame Confirmation

To enhance the reliability of my analysis, I use multiple time frames. While the three-minute chart showed high selling volume, the five-minute chart revealed an important detail: a volume climax. At the 9:00 AM candle, despite strong buying, the buyers were absorbed by even stronger selling pressure. This volume climax indicated the exhaustion of buyers, further confirming the potential for a downward reversal.

Trade Execution

Combining insights from the three-minute and five-minute charts, I decided to short the market. The three-minute chart showed high selling volume, while the five-minute chart indicated a buying climax. These combined signals suggested a strong probability of a market reversal.

The specific levels we targeted included:

  • 84.16, 83.95, 83.65, 83.45, and 83.35: Key points indicating potential support.

My big picture target was 82.75, which the market slightly exceeded, reaching 82.72. While I was off by three ticks, the overall strategy proved highly effective.

The Importance of Volume and Price Action

Understanding the relationship between volume and price action is essential for successful trading. It allows you to anticipate market movements and make informed decisions. In this trade, identifying the selling volume and buying climax was key to predicting the market’s direction.

This real-time market analysis and trade execution illustrate the power of understanding volume and price action. By using Hawkeye indicators—volume paint bars, wide bars, pivots, volume radar dots—you can gain the insights needed to make profitable trades.

I invite you to watch our training webinar for a deeper dive into these concepts. It’s crucial to understand volume and price action, as all other indicators are secondary.

Our volume indicators are compatible with platforms like TradeStation, TradingView, NinjaTrader, and MetaTrader.

Join us for the webinar, take notes, and reach out with any questions.

Let’s get these powerful tools on your screen and start making informed trading decisions based on real-time market dynamics.

Thank you for your time. I look forward to seeing you succeed using Hawkeye’s volume and price action strategies. God Bless!

Happy Trading,

Anthony Speciale

Hawkeye Traders

Big Energy Profits

Volume and Price Action Mastery in Gold’s Session

Calling Gold’s Session Low LIVE Using Hawkeye Volume and Price Action Analysis

Hello, traders! Anthony Speciale here with Hawkeye Traders. I hope you’re having a fantastic day. Today, I’m thrilled to share some powerful insights with you, insights that we identified live in the market, providing you with actionable knowledge to enhance your trading strategy.

Real-Time Market Analysis: A Case Study with Gold Futures

What sets today’s lesson apart is that it’s not based on hindsight but on real-time market activity. We’re going to delve into a live scenario we observed with Gold Futures on a three-minute chart. This isn’t a theoretical exercise—this is the real deal, happening in the moment with live traders.

As we examined the market, we identified a significant low point during the session. What’s fascinating is that this low was respected throughout the entire trading session. Let me show you how we pinpointed this critical low and how you can use similar strategies in your trading.

The Downtrend and the Reversal

Initially, we were in a clear downtrend. You could see the market moving consistently lower. As we approached this pivotal low, ultra-high selling volume emerged. Despite the intense selling pressure, the market couldn’t close below the wick of a particular candle—a crucial indicator. This lack of follow-through was our first clue.

We saw the market consolidate with increasing selling volume, yet it couldn’t push lower. Then, at 8:06 AM, a powerful buying candle appeared, marking the beginning of a significant reversal. This strong buying pressure signaled the end of the downtrend and the start of a bullish movement.

volume and price action

Understanding Volume and Price Interaction

By carefully analyzing the interaction between volume and price, we identified this reversal in real time. The key factors were:

  • High Selling Volume: Indicating strong selling pressure.
  • No Lower Closure: Despite high selling, the market didn’t close lower.
  • Strong Buying Volume: A powerful buying surge indicating a reversal.

These signals told us that the market was likely to turn around, which it did, resulting in a substantial 150-tick move—a significant profit opportunity in Gold Futures.

The Power of Volume Analysis

Understanding the relationship between volume and price action is a game-changer for traders. It allows you to anticipate market reversals and trend changes with greater accuracy. When you see strong selling with no follow-through followed by strong buying, it’s a clear sign that the market may reverse.

This insight helps you avoid entering trades against the trend and positions you to capitalize on significant market moves. By focusing on volume and price, you can make informed decisions without relying on lagging indicators like moving averages or MACD.

Simplifying Your Trading Screen

One of the most valuable lessons I’ve learned over my 13-year trading career is that simplicity is key. A cluttered screen with numerous indicators can obscure important market signals. By stripping down your chart to focus on volume and price action, you gain clarity and can make more effective trading decisions.

At Hawkeye Traders, we use a few essential tools:

  • Hawkeye Paint Bar: Colors bars based on volume.
  • Hawkeye Volume: Displays volume levels.
  • Volume Radar Dot: Highlights significant volume changes.
  • Hawkeye Wide Bar: Indicates heavy market interaction.

These tools provide a clear view of the market, helping you understand the interaction between volume and price without unnecessary distractions.

Join Our Training Webinar

To help you master these techniques, we’re offering an exclusive Training Webinar. In this webinar, we’ll dive deeper into the principles of volume and price action analysis. You’ll learn how to apply these strategies across various markets and timeframes, whether you’re trading stocks, futures, forex, or cryptocurrencies.

What You Will Learn:

  • Advanced volume and price action analysis techniques.
  • Practical strategies for identifying market reversals and trend changes.
  • How to simplify your trading screen for better clarity.
  • Real-world examples and case studies.

Register Now and Transform Your Trading

Click the link below to register for our Training Webinar. Gain the knowledge and tools to enhance your trading strategy and start making more informed, profitable trades.

Register for the Training Webinar

By attending this webinar, you’ll not only get access to our Hawkeye Indicators but also the Volume Mastery Series. This comprehensive course will equip you with the skills to analyze any chart and understand the crucial interplay between volume and price action.

Don’t miss this opportunity to take your trading to the next level. Click the link, register for the webinar, and start your journey towards becoming a more successful trader.

Thank you for joining me today. I look forward to seeing you in the webinar and helping you succeed in the markets. God Bless!

Happy Trading,

Anthony Speciale

Hawkeye Traders

Big Energy Profits

Trend Line Strategies for Better Trades

trend line

Trend line Provides Future Support Confirmed By Hawkeye Volume

Welcome to another insightful post from Hawkeye Traders. I’m Anthony Speciale, and today, I’m excited to walk you through one of the most fundamental yet often misunderstood tools in trading: the trend line. 

Trend lines play a vital role in analyzing market behavior, especially when combined with volume and price action. My goal is to help you understand how to draw and use trend lines correctly, ensuring they become a powerful tool in your trading arsenal.

The Importance of Trend Lines

Trend lines are essential for identifying the direction of the market. 

They provide a visual representation of support and resistance levels, helping traders make informed decisions. 

However, many traders struggle with using trend lines effectively. A poorly drawn trend line can lead to false signals and losses, which is why it’s crucial to master this skill.

trend line

Source: TradingView

Drawing a Proper Trend Line

To draw a meaningful trend line, you need at least three touches. Two points alone can be connected by anyone, but three touches validate the line’s significance. 

Here’s a step-by-step approach:

  • Identify Pivot Points: Look for pivot lows (in an uptrend) or pivot highs (in a downtrend). These points will serve as the anchors for your trend line.
  • Use a Ray Tool: A ray automatically extends your line, making it easier to identify future points of interaction.
  • Find Clean Touches: Ensure that your trend line touches at least three significant points. This validation process helps confirm the trend line’s reliability.

Case Study: Bank of America [BAC]

Let’s consider a practical example using Bank of America’s daily chart. We established a trend line with four clean touches between January 17th and February 16th. This trend line, formed over a month, became a crucial indicator for future price movements.

Analyzing Volume and Price Action

Understanding the relationship between volume and price action when interacting with a trend line is critical. 

For instance, on April 16th, the price aggressively tested our trend line. 

We observed heavy selling volume and a Hawkeye Wide Bar into support.

If the following candle does not continue lower, it indicates a high probability of a reversal. 

In this case, the price corrected, formed a higher low, and eventually rallied past the previous highs.

Future Support and Resistance

By drawing just two lines on Bank of America’s chart, we identified future support levels. 

These levels are crucial for making informed trading decisions. 

For example, after breaking the double top, the previous highs became new support. 

This insight allowed us to anticipate potential entry points with higher accuracy.

Key Takeaways

  • Trendline Validation: Ensure your trend line has at least three touches to confirm its validity.
  • Volume Climax: High volume at trend lines often indicates potential reversals.
  • Future Projections: Use trend lines and volume analysis to predict future support and resistance levels.

Mastering trendlines and understanding their interaction with volume and price action can significantly enhance your trading strategy. 

By following these principles, you can identify high-probability trade setups with lower risk.

I invite you to join our training webinar, where we dive deeper into these concepts. 

Our team is here to assist you in integrating these tools into your trading routine, helping you make more informed and profitable decisions.

Let’s simplify your trading and improve your accuracy. 

Click Here to access the Hawkeye Volume Mastery Series.

I look forward to helping you on your journey to becoming a more successful trader!

Happy Trading,

Anthony Speciale

Hawkeye Traders

Big Energy Profits

Ultra-High Selling Volume in MTDR

Ultra-High Selling Volume in MTDR

Ultra-High Selling Volume At KEY Price Level: MTDR

Welcome to the blog! Anthony Speciale here with Hawkeye Traders.

Today, we’re diving into an analysis of Matador Resources Company (ticker: MTDR).

Our goal is to determine if it’s time to sell based on recent market activity, focusing specifically on the volume and price action.

Ultra-High Selling Volume: What Does It Mean?

On Friday, June 28, 2024, we witnessed the highest daily selling volume for Matador Resources since the peak buying volume back in April 2022.

This is significant and worth paying close attention to.

However, the concerning part is that despite the high selling volume, the price did not close below the previous candle.

This suggests a potential resistance point.

Typically, when we see such high selling volume without a significant drop in price, it raises questions.

You might assume that heavy selling would lead to a price decline, but that’s not always the case.

This scenario could indicate that the buyers have exhausted themselves, or perhaps a large number of stop orders were triggered.

Key Indicators and Support Levels

Let’s break down the recent price action.

On June 3, 2024, a wide bar with significant selling volume appeared.

Fast forward to June 28, and we see a much smaller bar despite the ultra-high volume.

This discrepancy suggests that the sellers may be losing momentum.

Before making any decisions, I recommend looking for additional confirmation.

If we see a break below the recent upward push, it could signal that the sellers are regaining control.

On the other hand, if the price holds and starts to push higher, it could confirm that this was a sellers’ climax, meaning the selling pressure has peaked, and we may see a rebound.

Ultra-High Selling Volume in MTDR

Potential Price Targets

If the price begins to rise, we should watch for retests of previous highs:

  • $61.89
  • $63.89
  • $65.88
  • $67.52

These levels represent potential resistance points where selling could resume.

However, if the price breaks through these, it could signal a continued upward trend.

Conversely, if the price fails to hold, we could see a decline towards $53.23, a significant support level.

Action Steps

  • Monitor the Volume: High selling volume like we saw on June 28 can lead to a significant move. Watch how the price reacts around the $59.50 level.
  • Look for Confirmation: If the price holds and begins to rise, it could confirm a sellers’ climax. If it falls, be prepared for further declines.
  • Set Alerts: Place alerts at the key levels mentioned above to stay informed of potential price movements.

The relationship between volume and price action is crucial in understanding market behavior.

I encourage you to add Matador Resources to your watchlist and observe how this situation unfolds over the coming days and weeks.

Next Steps

I’m committed to keeping you updated on this analysis.

I’ll post an update next week or the week after to see if this was indeed a sellers’ climax or if the sellers continue to push the price lower.

In the meantime, I highly recommend attending the Training Webinar linked below.

It dives deeper into the relationship between volume and price action, providing valuable insights that can enhance your trading strategy.

Attend The Training Webinar Now

Understanding these dynamics is vital, whether you’re day trading, swing trading, or position trading.

By mastering the interaction between volume and price, you’ll be better equipped to make informed decisions in the market.

Thank you for reading. Stay tuned for more updates, and as always, God bless.

Happy Trading,

Anthony Speciale

Hawkeye Traders

Big Energy Profits

Hawkeye Volume: Identifying Continuation Followed By Weakening

hawkeye volume

Identifying Continuation Followed By Weakening Using Hawkeye Volume

Welcome to another insightful analysis session. This is Anthony Speciale with Hawkeye Traders, hoping everyone is having a wonderful day.

Today, we’re diving into the daily chart of Johnson & Johnson (JNJ), where each candle represents a full trading session’s worth of data.

Whether you’re a swing trader, position trader, or even someone considering entering or exiting trades, understanding the interaction between volume and price can significantly enhance your trading strategy. By using Hawkeye Volume, you can gain deeper insights into market dynamics.

Key Turning Points on the JNJ Chart

Let’s focus on identifying key turning points by examining high volume surges and the reaction or interaction between volume and price.

On Friday, December 15, 2023, we observed an intriguing scenario.

Despite ultra-high selling volume, the candle that formed was a small doji-style candle.

Intuitively, such high selling volume should produce a substantial downward candle, similar to what we saw on Wednesday, the 20th.

However, this small candle indicated that strong sellers were unable to push below the prior buying candle, signaling that the buying candle had established new support.

To illustrate this, I drew a trend line from the prior low to the low of this small candle, noticing how price interacted with it subsequently.

When price pulled back to this level, the selling volume was significantly lower, suggesting that the sellers had lost their momentum and climaxed on December 15th.

This trend line held as support, leading to a subsequent rally.

hawkeye volume

The Importance of High Volume Candles

When analyzing JNJ, it’s crucial to note that ultra-high volume candles can provide significant insights into market dynamics.

For example, strong selling volume without a new low indicates a potential higher low, which could signal a buying opportunity.

Conversely, diminishing buying volume as price pushes into a high suggests that buyers are losing interest, potentially signaling an upcoming price decline.

Applying These Insights to Your Trading

As we continue to examine the chart, it’s evident that interpreting high volume areas can lead to a better understanding of potential price action.

The failure of sellers to push prices lower at high volume points can signify support levels, while decreasing buying at resistance levels can indicate upcoming declines.

For traders, this means that high volume areas can serve as critical indicators for making informed decisions.

By focusing on the relationship between volume and price action, traders can gain valuable insights into market trends and potential turning points.

Next Steps

To further your understanding, I invite you to CLICK HERE and watch our training webinar.

Grab a piece of paper and a cup of coffee or tea, and dedicate some time to learning about the relationship between volume and price action.

This knowledge will empower you to integrate these insights into your strategy effectively.

After watching the webinar, we can help you get these indicators set up on your trading platform, whether it’s TradingView, TradeStation, NinjaTrader, or MetaTrader.

Our software is versatile and applicable to all these platforms.

Additionally, you’ll gain access to the Hawkeye Volume Mastery Series, which will deepen your understanding of the interaction between buyers, sellers, and price action.

By focusing on volume and price action, you’ll streamline your analysis, making it easier to identify key market movements and trends.

This approach eliminates the need for numerous indicators, allowing you to make more informed trading decisions.

Thank you for joining me in this analysis. I look forward to seeing you in the training webinar and helping you integrate these powerful tools into your trading strategy.

ENTER TRAINING WEBINAR 

Happy Trading,

Anthony Speciale

Hawkeye Traders

Big Energy Profits

Volume Analysis: Check These 2 Ultra-High Volume WideBars

volume analysis

Volume Analysis: 2 Ultra-High Volume WideBars Fail To Make NEW Higher Close

Welcome to today’s deep dive into optimizing your day trading strategy with a focus on Ultra-High Volume WideBars. I’m Anthony Speciale with Hawkeye Traders.

Today, we’re diving into the Russell 2000 Futures Market, dissecting key insights that could transform your trading game.

Each candle on a 5-minute chart represents just a snapshot, but understanding the paired volume can provide invaluable context. 

This volume analysis approach not only enhances your decision-making process but also improves the accuracy of your trades.

Let’s break down what we observed today on the Russell 2000 Futures Market. 

We began by identifying ultra-high volume and wide bars—key indicators of significant market volatility. 

These moments are crucial because they highlight areas where price action is most intense.

Our Hawkeye tools specialize in pinpointing these pivotal moments, guiding us through complex market movements.

For instance, we noticed a series of wide bars indicating attempts to breach a resistance level. Despite initial efforts, the market failed to sustain these upward moves. 

This pattern of highs and failure to close above resistance strongly suggested that buyers were losing momentum. 

This insight is pivotal for a trader because it signals a potential reversal or at least a hesitation in bullish sentiment.

Moreover, using Hawkeye’s Volume Analysis, we identified crucial support and resistance levels. 

Simple trend lines drawn from these points provided clear guidance on where the market might pivot towards next. 

volume analysis

Source: TradingView

This approach is not just about spotting trends but about understanding the dynamics between volume and price action—a relationship that drives market movements across all asset classes.

Today’s session was a prime example of how economic news can impact different indices differently. 

While NASDAQ and S&P surged on strong data, the Russell 2000 showed reluctance to follow suit, highlighting its unique behavior and signaling caution for traders.

If you’re serious about refining your day trading strategy, I invite you to join our upcoming training webinar.

We’ll delve deeper into using Hawkeye volume tools effectively across various trading platforms—TradeStation, NinjaTrader, TradingView, and MetaTrader. 

Whether you trade stocks, futures, forex, cryptocurrencies, or options, mastering volume-price dynamics will give you a competitive edge.

It’s time to elevate your trading skills with insights that matter—volume and price action. 

Let’s empower your trading journey together!

I look forward to seeing you at the webinar and discussing how Hawkeye volume tools and mastery training series can transform your trading approach.

Happy Trading,

Anthony Speciale

Hawkeye Traders

Big Energy Profits

400 Ticks of Profit for BEP Members

400 ticks

Congrats To BEP Members Locking In An Additional 400 TICKS Of PROFIT

Welcome to our latest update from Hawkeye Traders. Anthony Speciale here, and today, I’m thrilled to share some exciting news and valuable insights that can help you navigate the ever-changing landscape of the markets more effectively.

Our Big Energy Profits members have had an incredible opportunity, taking profits for the second time at 400 ticks.

We initially entered the trade at $78, and today, we hit a high of $82.0, taking profits at $80 and $82, respectively.

This fantastic setup has provided our members with substantial gains, especially during the summertime rally in crude oil.

In this blog post, I want to focus on the importance of volume in trading and how it can help you make more informed decisions.

Understanding volume can provide you with critical insights into market behavior, allowing you to identify potential highs and lows during a trading session.

Let’s delve into a recent example from the crude oil market to illustrate this concept.

The Power of Volume Analysis

Crude oil opened the New York session at 9:00 AM, and we witnessed significant activity right out of the gate.

At 9:05 AM, the buying volume peaked, which is clearly visible on the volume chart.

However, by 9:10 AM, we saw the session high being placed on lower buying volume, followed by a substantial sell-off of approximately 55 ticks.

Why did this happen?

Many traders, including Big Energy Profits members, were eyeing $82 as a major target.

When significant targets are reached, a large number of sell orders typically get triggered, overpowering the remaining buyers and causing the price to drop.

This pattern can provide traders with valuable clues about potential resistance levels.

Identifying Key Trading Signals

Let’s break down the key signals from the crude oil session:

  • Initial High on Lower Volume: The session high was established with lower buying volume at 9:10 AM, indicating a potential peak.
  • Aggressive Sell-Off: Following the high, a sharp sell-off occurred as sell orders flooded the market, leading to a significant price drop.
  • Failed Retest of High: Later in the session, a second attempt to breach the high on high buying volume failed, reinforcing the resistance level.

These signals suggest that the high established at $82.04 was a significant resistance point. When the market fails to push through a high on increased buying volume, it often indicates that a peak has been reached, at least for the current session.

400 ticks

Source: TradingView

Practical Application for Traders

As a trader, recognizing these volume patterns can help you make more informed decisions.

Here are some practical steps to incorporate volume analysis into your trading strategy:

  • Stay Informed: Continuously monitor volume levels alongside price action. High volume at significant price points can indicate potential reversals or continuations.
  • Be Flexible: Adapt your trading strategy based on volume signals. If you notice a high being placed on lower volume followed by a sell-off, consider adjusting your positions accordingly.
  • Use Simple Tools: Rely on essential indicators like volume and price action. Avoid cluttering your charts with unnecessary tools that can lead to confusion.

Invitation to Enhance Your Trading Skills

To further enhance your trading skills, I invite you to explore the resources we offer at Hawkeye Traders.

CLICK HERE to access our powerful indicators and Hawkeye Volume Mastery series.

Additionally, we provide information on Big Energy Profits for those interested in swing trading the energy sector using volume and price action.

Congratulations again to our Big Energy Profits members for achieving 400 ticks – that’s $4,000 per contract closed at our current target.

We’re still aiming for higher targets, but taking profits along the way ensures consistent gains and minimizes risk.

Understanding volume and its relationship with price action is crucial for successful trading.

By focusing on these core elements, you can gain valuable insights into market behavior, identify key levels, and make more informed trading decisions.

We look forward to helping you integrate these strategies into your trading routine.

Thank you for being a part of our community. If you have any questions or need assistance, please don’t hesitate to reach out. We’re here to support your journey!

Happy Trading,

Anthony Speciale

Hawkeye Traders

Big Energy Profits

Ranging Markets: Using Green Bottoms and Red Tops for Trading Success

ranging markets

Understanding Ranging Markets:

“Green Bottom” @ Support & “Red Top” @ Resistance – Trigger Opportunity

How to Use Hawkeye Volume and Price Action for Successful Trading

Welcome to today’s discussion, where we’ll explore the essential strategies for navigating ranging markets using Hawkeye Volume and Price Action analysis. 

As retail traders, understanding these concepts is crucial for enhancing your trading success. Let’s dive in…

The Reality of Market Trends

Statistically, markets trend only about 30% of the time. 

The remaining 70% of the time, they are either ranging, reversing, consolidating, or congesting. 

If you can’t decipher what’s happening during these conditions, you’ll struggle to succeed in placing trades. 

As you progress in your trading career, you’ll realize the necessity of applying different approaches based on varying market conditions.

Identifying Ranging Markets

Let’s examine a real-time example with the NASDAQ 100 Futures Market on a three-minute candle chart. 

Observing the market post-opening bell at 9:30 a.m. Eastern Standard Time, we notice that the market is ranging rather than trending. 

This is a typical scenario where understanding key price actions becomes critical.

Key Indicators in Ranging Markets

  • Volume Analysis: Identify significant rotations or key candles with high volume that fail to move the market significantly. For instance, at 9:06 a.m., a candle with strong selling volume showed a large wick but small body, indicating a potential reversal despite high selling pressure.
  • Green Bottoms and Red Tops: Recognize specific candles such as green bottoms (indicating potential buying opportunities) and red tops (signifying potential selling points). These are crucial in determining entry and exit points within a range.
  • Support and Resistance Zones: Draw zones around areas where the market consistently fails to move higher or lower. This helps in identifying resistance and support levels.

Practical Application

By drawing boxes around key areas, such as where high volume fails to push prices lower (support) or higher (resistance), we establish zones that guide our trading decisions. 

For example, increased selling volume with no follow-through indicates potential support, while increased buying volume without upward movement suggests resistance.

ranging markets

Source: TradingView

Example Analysis

  • Support Zone Analysis: Notice high selling volume around 9:06 a.m. failing to push prices lower, forming a support zone.
  • Resistance Zone Analysis: Multiple instances of increased buying volume failing to breach a certain level, indicating resistance.

When the market approaches these zones, pay attention to volume changes and price actions like wicks and candle bodies. 

These observations will help you predict potential reversals or continuations.

Implementing a Ranging Strategy

To trade effectively within a range, employ strategies specific to these conditions. 

For instance, buy near support and sell near resistance. 

Look for confirmation signals like green bottoms at support or red tops at resistance

This ensures that your trades align with the market’s behavior.

Example Trades

  • Buying at Support: A green bottom at a support zone with high volume but no lower movement signals a buy opportunity.
  • Selling at Resistance: A red top at a resistance zone with high buying volume but no higher movement signals a sell opportunity.

By understanding and applying these concepts, you can make informed trading decisions even in ranging markets.

Navigating ranging markets effectively requires an understanding of volume & price action. 

Using the Hawkeye Volume and incorporating these insights into your trading plan will enhance your ability to identify key levels and potential reversals, leading to more consistent and profitable trades.

For further learning and to see these indicators in action, CLICK HERE to watch our training webinar. Take notes and reach out with any questions. 

We’re here to help you integrate these strategies into your trading process. 

Access the Hawkeye Volume Mastery Library and start focusing on what truly matters in the market: the relationship between volume and price action.

Thank you for your time. We look forward to hearing from you and helping you become a more disciplined and successful trader.

Remember, understanding volume and price action is key. Everything else is secondary. Let’s get started on refining your trading strategies today.

Join us for the Training Webinar, start integrating these indicators into your trading, and let’s work together to enhance your trading performance. See you in the webinar!

Happy Trading,

Anthony Speciale

Hawkeye Traders

Big Energy Profits

Crude Oil Session: Spotting Red Tops for Profits

crude oil session

Hawkeye “Red Top” Sets Stage For Push Thru Crude Oil Session Lows

Understanding Red Tops and Green Bottoms

Welcome, traders! Anthony Speciale here with Hawkeye Traders, hoping you’re having a fantastic day. Today, we’re diving into a critical aspect of technical analysis: the Red Top. 

For those unfamiliar, a Red Top can be a powerful indicator of market behavior, and I’ll guide you on how to identify and use it effectively in your trading strategy. 

Let’s break down a prime example from this morning’s crude oil session.

What is a Red Top?

A Red Top occurs at key levels of resistance and signifies a strong presence of selling volume. 

For it to be a Red Top, the candle must close in the lower 50% of its range, combining the wick and the body. 

Identifying these at crucial support or resistance levels can be a game-changer in your trading decisions.

Analyzing Today’s Crude Oil Example

This morning at 11:18 AM EST, crude oil presented a textbook Red Top. 

Recognizing these patterns at key levels can significantly enhance your profit-taking strategies as the market moves lower off these Hawkeye Red Tops.

We saw a channel structure forming using the session low and a higher low marked by a green bottom. 

This channel was confirmed as the price action tested and failed to break the resistance, indicated by the Red Top. 

When we see a Red Top at such levels, it’s a strong signal that the market may face a downside pressure.

crude oil session

Key Trading Levels and Strategy Execution

From the Red Top at 11:18 AM, we projected the move down to several target levels. 

The first support level provided a 37-tick profit. 

Subsequent levels at the channel structure and prior lows offered additional 50 ticks and 66 ticks, respectively. 

Finally, the market touched the session low, culminating in an 82-tick profit.

Understanding who is in control at these key levels is crucial.

Typically, strong buyers at support and strong sellers at resistance dictate the market’s next move. 

This morning’s session saw a high buying volume bar at 10:51 AM, but without significant follow-through, signaling that buyers were losing steam. 

Pairing this with the Red Top reinforced the confidence in the market’s potential to roll over.

Why Red Tops Matter

Trading is about stacking probabilities in your favor. 

By identifying Red Tops at resistance and Green Bottoms at support, you align your trades with high-probability setups. 

This approach is not based on hindsight but on real-time analysis and interpretation.

Practical Application and Next Steps

In live market conditions, I was keenly watching the 81.72 level as a potential resistance point, predicting that it would be challenging for the market to break above. 

This prediction was validated as the market struggled to sustain its highs and eventually rolled over.

If you’re serious about enhancing your trading, understanding these dynamics is essential. 

The next step? Join our Training Webinar. Here’s what you need to do:

  • Click the link below to register for the Training Webinar.
  • Take notes during the session.
  • Reach out to us with any questions you have.

During the webinar, we’ll dive deeper into these strategies, helping you understand how to identify Red Tops and Green Bottoms in real-time. 

You’ll also gain access to the Hawkeye Volume Mastery Series, equipping you with the tools to leverage volume and price action for better trading decisions.

Remember, clarity in trading comes from simplifying your charts. 

Focus on volume and price action, as they reveal the true intentions of market participants. 

By mastering this relationship, you can pinpoint high-probability setups and confidently apply risk to the market.

Trading is about patience, discipline, and having an edge. 

Understanding Red Tops and Green Bottoms at critical levels of support and resistance provides that edge.

Join us for the Training Webinar, start integrating these indicators into your trading, and let’s work together to enhance your trading performance. See you in the webinar!

Happy Trading,

Anthony Speciale

Hawkeye Traders

Big Energy Profits

Ultra-High Volume: Adding More Risk for Greater Rewards

ultra-high volume

Ultra-High Volume Offers Opportunity To Add More Risk

Welcome, traders! This is Anthony Speciale with Hawkeye Traders, and today, I want to share an insightful analysis of my morning trading session.

I focus primarily on Light Sweet Crude Oil, using Hawkeye volume indicators to guide my decisions.

By sharing my thought process and strategy, I aim to provide you with actionable insights that can enhance your trading performance.

Morning Market Overview

Today’s analysis revolves around a 5-minute chart of Light Sweet Crude Oil.

Each candle represents five minutes of price action, offering a detailed view of market dynamics.

As I began my morning session, the market was struggling to break through prior highs, creating a critical level of resistance.

Identifying Key Patterns

At around 5:45 AM and again at 8:00 AM, the market revisited a significant resistance level but failed to rally beyond it.

This failure signaled a potential opportunity for a short position.

I drew a simple zone around this consolidation area and identified a trend line that the market was respecting.

Recognizing Volume Signals

One of the most critical aspects of my analysis was the volume.

At 8:00 AM, the market exhibited ultra-high buying volume, the highest of the session so far.

However, despite this significant buying pressure, the candle closed roughly at the midpoint of its range.

This indicated that the buyers were unable to push the price higher, a classic sign of a potential reversal.

Executing the Trade

Seeing the market’s failure to break through resistance, I entered a short position.

As the market began to move lower, I scaled out of my position, taking profits at predefined levels.

My higher time frame analysis suggested support around 80.35, slightly above the session low at 80.27.

ultra-high volume

Adding to the Position

When the market pulled back and printed another high-volume candle at resistance, I re-added to my short position.

The key here was the combination of high buying volume and the market’s inability to close in the top percentile of the candle.

This reinforced my belief that the market would continue to push lower.

The Relationship Between Volume and Price

The success of this trade hinged on understanding the relationship between volume and price action.

The ultra-high volume at resistance, followed by a failure to break through, was a clear signal of a reversal.

This understanding allowed me to confidently add to my position and maximize my profits.

Invitation to Learn More

If you found this analysis insightful, I invite you to attend our training webinar.

We’ll dive deeper into the relationship between volume and price action, equipping you with the tools to apply these principles to your trading.

You’ll gain access to the Hawkeye Volume Mastery Library, a comprehensive resource designed to enhance your understanding and proficiency in trading.

It’s Time To Unleash Your Full Trading Potential

Mastering the market requires a keen understanding of the dynamics between volume and price action.

By focusing on these elements, you can make more informed trading decisions and improve your overall performance.

Join us in our training webinar to take your trading to the next level.

Thank you for reading, and I hope this post has provided you with valuable insights.

Remember, the key to successful trading is not just understanding the market but also understanding how volume and price interact.

See you in the next post!

Happy Trading,

Anthony Speciale

Hawkeye Traders

Big Energy Profits

Hawkeye WideBar: Analyzing NVDA Across Multiple Timeframes

hawkeye widebar

Analyzing Multiple Timeframes On NVDA Using The Hawkeye WideBar

Anthony Speciale here with Hawkeye Traders. Today, I’m excited to dive into an analysis of Nvidia, a stock that has been a leading force in the market.

In this detailed breakdown, we will explore Nvidia’s price action, volume, and how our Hawkeye indicators can provide valuable insights.

Whether you’re new to trading or a seasoned pro, this analysis will equip you with actionable knowledge to enhance your trading strategies.

Why Nvidia?

Nvidia has been a standout performer, propelling the market to new highs recently.

What caught my attention was an intriguing statistic about Nvidia’s worth per employee, which outshines even tech giants like Google and Apple. This remarkable performance makes Nvidia a prime candidate for technical analysis.

The Power of Hawkeye Indicators

In this analysis, I’ll demonstrate how our Hawkeye indicators can shed light on market movements.

Specifically, we’ll focus on the Hawkeye WideBar, a tool that highlights significant market activity by identifying bars that have moved in excess of our internal settings.

This analysis will span multiple timeframes, providing a comprehensive view of Nvidia’s market behavior.

Monthly Chart Analysis

Let’s start with the monthly chart to capture the big picture. Nvidia has experienced a vertical run, a phenomenon we’ve observed with the help of the Hawkeye WideBar.

This bar signals that the market has moved significantly beyond the average range of the previous 14 bars.

When a Hawkeye Wide Bar appears, I mark it with a box, noting the high and low points.

For Nvidia, this analysis revealed that breaking above the high of a wide bar typically leads to further upward movement. This zone, marked by the highs of wide bars, often provides support during pullbacks.

For example, a notable wide bar on the monthly chart set the stage for Nvidia’s recent parabolic rise.

Recognizing these zones can be crucial for identifying potential support levels during corrections.

Weekly Chart Insights

Moving to the weekly chart, we gain more clarity on Nvidia’s support zones.

By marking off wide bars on this timeframe, we can see how they have consistently provided support before the stock continued its upward trajectory.

Analyzing these wide bars helps us anticipate potential pullback areas.

For instance, Nvidia may experience corrections towards zones defined by previous wide bars.

Identifying these areas allows traders to plan entries and manage risk effectively.

Daily Chart Dynamics

On the daily chart, we focus on more recent market activity.

Yesterday’s candle, a wide bar, indicates significant market movement.

This tells us to be cautious around this price level, as it may act as resistance if the market pulls back.

Conversely, breaking above this level could signal continuation of the upward trend.

By marking the high and low of this wide bar, we establish a resistance zone that traders should monitor closely.

Understanding these dynamics can guide both short-term trades and long-term investment decisions.

hawkeye widebar

Anticipating Market Corrections

Markets don’t move in straight lines forever; corrections are a natural part of any trend.

For Nvidia, potential pullback areas are identified around $116 to $109 and, if a deeper correction occurs, around $97.

Recognizing these zones helps traders plan their entries and manage risk during market fluctuations.

Simplifying Trading with Hawkeye Volume and Price Action

At Hawkeye, we emphasize the importance of volume and price action.

Indicators like the Hawkeye WideBar provide insights into market behavior that can simplify trading decisions.

By focusing on these key elements, traders can develop a clear and effective trading plan.

It’s Time To Unleash Your Full Trading Potential

In conclusion, understanding Nvidia’s price action through the lens of Hawkeye indicators can provide valuable insights for your trading strategy.

By analyzing wide bars across multiple timeframes, we can identify support and resistance zones, anticipate market corrections, and plan trades with confidence.

I invite you to explore these concepts further by watching our detailed video analysis.

Click the link below to access the video, where I break down these strategies step by step.

Take notes, ask questions, and see how the Hawkeye Volume Based indicators can transform your trading approach.

Join me in the Training Webinar and unlock the power of volume and price action in your trading journey today!!!

I look forward to seeing you there and helping you succeed in the markets!

Happy Trading,

Anthony Speciale

Hawkeye Traders

Big Energy Profits

Market Clues: Unlocking Market Secrets

reading market clues

Look Left … The Market Will Leave You Vital Clues, Start Reading them!!!

Anthony Speciale from Hawkeye Traders here, hoping you’re having a fantastic day. 

Today, I want to share a crucial part of my morning routine when I approach the trading terminal – scanning the overnight session for clues that can shape the day’s market movements.

It’s fascinating how the market often leaves behind subtle hints during sessions when we’re not actively trading. 

Yesterday morning, the NASDAQ presented a clear clue around 3:30 a.m. Eastern Standard Time. 

We observed a Hawkeye Wide Bar with the highest selling volume of the entire overnight session, forming a strong reversal candle known as a red top.

Now, I’m not suggesting that anyone was up at 3:30 a.m. to short the market precisely at that moment. 

Rather, I’m emphasizing how crucial it is to spot these clues. 

They provide insights into potential market directions for the day ahead. 

In this case, with such a significant selling volume and a strong bearish indicator, it signaled caution for any bullish moves.

What happened next was telling . . . 

The NASDAQ dropped 1,550 ticks from the point of that red top. 

reading market clues

This isn’t about perfect timing but about recognizing patterns and using them to guide your trading decisions throughout the day.

As traders, we’re taught to “look left” on our charts – meaning, pay attention to historical data and the storyline it tells. 

The market leaves clues, and these clues often serve as leading indicators of future price movements. 

Understanding this relationship between volume and price action is pivotal.

Reading Market Clues with Hawkeye Traders

At Hawkeye Traders, we’ve developed volume and price action based tools and include access to our Hawkeye Mastery Library, offering extensive training on interpreting volume and price action. 

Whether you’re day trading, swing trading, or trading on any timeframe or market, our tools are designed to simplify your analysis and enhance your trading precision.

I encourage you to dive deeper into this concept by watching our training webinar.

It’s packed with insights that will give you that “aha” moment – realizing that trading isn’t about drowning in indicators but about understanding what volume and price action are revealing.

Take notes, ask questions, and let us help you integrate Hawkeye indicators into your trading toolkit. 

We’re here to support you in mastering the art of reading market clues and making informed trading decisions.

Let’s decode the market together. Click the link below now, watch the webinar, and start enhancing your trading strategy today.

Join me in the Training Webinar and unlock the power of volume and price action in your trading journey today!!!

I look forward to seeing you there and helping you succeed in the markets!

Happy Trading,

Anthony Speciale

Hawkeye Traders

Big Energy Profits

Green Bottoms – Setting the Stage for Record Highs

Stacked “Hawkeye Green Bottoms” Set Stage For Record Highs

Anthony Speciale here from Hawkeye Traders. I hope you’re having a fantastic day. 

Today, I’m excited to delve into a concept that could significantly enhance your trading strategy: green bottoms. 

Whether you’re familiar with this term or not, understanding it can provide valuable insights into market reversals and potential entry points.

What is a Green Bottom?

A green bottom refers to a reversal candlestick pattern characterized by high buying volume. 

This pattern signals a potential shift in market direction from bearish to bullish. 

Conversely, a red top represents a reversal with high selling volume, indicating a potential shift from bullish to bearish sentiment. 

Both patterns, generated by Hawkeye Volume Trading Software, offer crucial signals for traders to pay attention to.

Analyzing the S&P 500 with Green Bottoms

Let’s focus on a recent example where green bottoms on the S&P 500 signaled significant market movements. 

Specifically, we observed two distinct green bottom candles that played a pivotal role in market dynamics. 

These candles marked crucial points where buying pressure overwhelmed selling, suggesting a potential reversal in the market’s direction.

The first green bottom occurred here, and the second, more significant one, appeared here. 

What makes the second one more significant? It’s the intensity of buying volume compared to preceding selling efforts. 

This imbalance indicates strong buyer conviction, often trapping sellers who then rush to cover their positions, further fueling upward momentum.

green bottoms

Key Insights from Green Bottoms

Identifying green bottoms isn’t just about spotting a candlestick pattern. 

It’s about recognizing shifts in market sentiment and potential trend reversals. 

For instance, if these levels hold without being breached, it often confirms a bullish bias in the market. 

Conversely, a breach could signal a continuation of the previous trend, prompting traders to reassess their strategies.

In this particular case, the green bottoms anticipated the S&P 500’s move towards setting new all-time highs. 

This insight isn’t about predicting exact highs and lows but understanding when momentum shifts favorably.

Implementing Your Trade Plan

As a trader, having a well-defined trade plan is crucial. 

Understanding how to interpret volume and price action helps in crafting effective strategies. 

For example, I knew not to short the market because the volume analysis clearly indicated strong buying interest.

If you’re new to trading or looking to refine your strategy, understanding the relationship between volume and price action is fundamental. 

It’s not just about the tools but how you integrate them into your decision-making process.

Take Your Trading to the Next Level

If you’re intrigued by how green bottoms and volume analysis can transform your trading, I invite you to explore our special training webinar. 

Click here to gain access to valuable insights and resources that can elevate your trading.

Whether you’re into day trading, swing trading, or position trading, mastering volume and price action dynamics applies across all time frames and markets. 

Our Hawkeye Volume and Price Action Mastery Library offers comprehensive education to help you leverage these insights effectively.

Don’t miss out on this opportunity to enhance your trading skills. 

JOIN WEBINAR NOW, dive into the content, and feel free to reach out to us with any questions. We’re here to support you on your journey to trading success.

Thank you for joining me in this discussion. Let’s harness the power of volume and price action together and navigate the markets with confidence.

Happy Trading,

Anthony Speciale

Hawkeye Traders

Big Energy Profits

[sg_popup id=13743]