Ultra-High Volume: Triggers YTD Sell-Off in PLAY

Join countless traders worldwide who use
the Hawkeye algorithms day in and day out to gain a powerful edge

Ultra-High Volume: Triggers YTD Sell-Off in PLAY

ultra-high volume

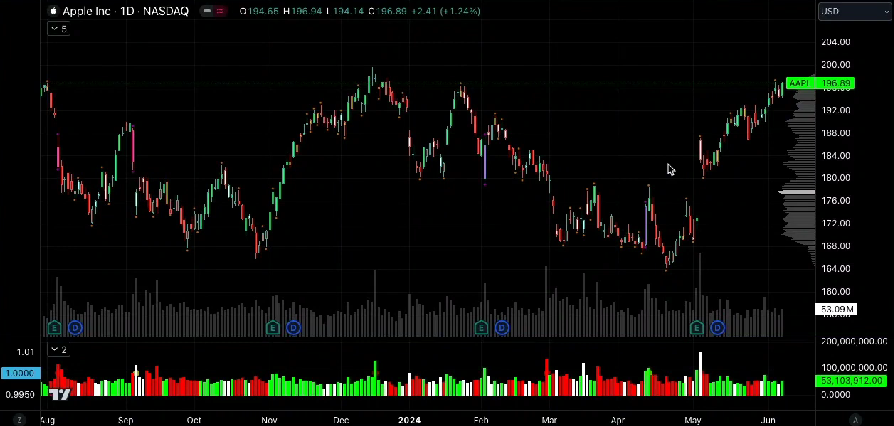
Ultra-High Volume Surge, Triggers YTD Sell-Off

Welcome to another insightful session, Anthony Speciale here from Hawkeye Traders. 

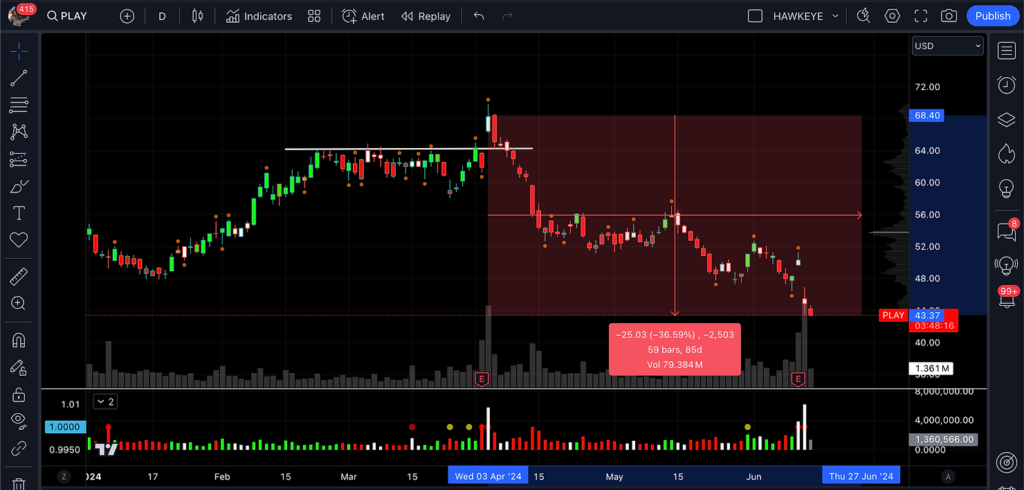
Today, we’re diving into the world of intraday price patterns through the lens of a popular ticker, Dave & Buster’s (PLAY). 

This analysis will provide valuable insights into how to interpret price movements and volume to enhance your trading decisions.

Dave & Buster’s, a well-known entertainment venue offering a combination of dining, video games, and craft beers, presents a fascinating case for analyzing intraday price patterns. 

While the venue itself provides a unique blend of fun for adults, our focus here is on its stock chart and the implications of recent price actions.

Chart Analysis and Key Patterns

On April 3rd, 2024, Dave & Buster’s stock reached a new YTD high, marking a significant point on its year-to-date chart. 

This peak was a critical area of resistance, a concept that retail traders must grasp to make informed decisions. 

Resistance levels are price points where selling pressure tends to overcome buying pressure, often leading to price reversals.

As we scrutinize the chart, we notice that the stock hit this resistance multiple times before ultimately breaking through. 

This breakthrough was accompanied by an ultra-high volume, the highest recorded for the year, signifying a point of major indecision between buyers and sellers. 

Such ultra-high volume candles are pivotal as they often precede significant price movements.

Deciphering the Ultra-High Volume Candle

The ultra-high volume candle observed on the chart was neutral, indicating that both buyers and sellers agreed on the price level but couldn’t push it decisively in either direction. 

This neutrality can be a precursor to a potential reversal if the subsequent price action doesn’t support a continued trend.

In this case, after the neutral candle, sellers took control, leading to a decline.

The stock closed below the previous support line, retracing its gains and continuing to fall. As of now, the stock is testing the low for the year. 

This scenario highlights the importance of understanding volume in conjunction with price action.

ultra-high volume
ultra-high volume

Applying the Insights

For retail traders, the key takeaway is the ability to recognize these high probability reversal points. 

By identifying ultra-high volume candles and interpreting them within the context of the overall price action, you can anticipate potential reversals and adjust strategies accordingly.

In practical terms, if you spot an ultra-high volume candle followed by a failure to maintain higher prices, it might indicate that sellers are taking control. 

This insight could prompt you to consider short positions or protective measures if you’re already long.

Enhancing Your Trading

Understanding and applying the knowledge of price patterns and volume analysis can significantly elevate your trading strategy. 

It’s not just about recognizing shapes on a chart but understanding the underlying market sentiment they represent. 

By combining these insights with a disciplined trading approach, you can improve your decision-making process and profitability.

We encourage you to continually educate yourself on these concepts and apply them in your trading routine. 

If you’re ready to seek a further understanding and employ volume based tools to assist in your analysis, our team at Hawkeye Traders is here to help you succeed.

May your days be filled with profitable opportunities!

Happy Trading,

Anthony Speciale

Hawkeye Traders

Big Energy Profits

Volume Analysis in Trading: Insights for Market Movements

volume analysis in trading

A Sustainable Move -OR- An Emotional Reaction? Let’s find out with Volume Analysis in Trading

Anthony Speciale here from Hawkeye Traders, and today, I want to share some crucial insights about incorporating volume analysis in trading strategy, especially when dealing with significant economic news releases. 

This is a vital aspect of trading that can elevate your understanding of market movements and enhance your trading decisions.

volume analysis in trading

The Importance of Volume Analysis

Volume is a critical indicator that provides insights into the market’s strength and potential direction. 

Unlike price action alone or traditional lagging indicators, volume reveals the underlying sentiment and participation level of traders in the market

Recognizing this can help you make more informed trading decisions and avoid potential pitfalls.

Real-Time Analysis: The S&P 500 Case Study

Let’s dive into an example using the S&P 500. 

On a typical trading day, economic news releases, often scheduled at 8:30 AM EST, can significantly impact market movements. 

As a pre-market trader, I usually start around 7 or 8 in the morning and sometimes trade until noon. 

Some days, I’m done even before finishing my first cup of coffee, while other days require more patience.

On a recent trading day, the S&P 500 chart, set to three-minute candles, showed an aggressive push higher at the 8:30 AM candle. 

This surge was accompanied by ultra-high buying volume but failed to sustain beyond the initial spike. 

This failure indicated a high level of emotion-driven trading, often seen during economic data releases.

I marked the high and low of this candle and observed the market’s behavior. 

Despite the strong initial buying, the market eventually fell below the candle’s low, signaling a shift in control from buyers to sellers. 

This downward move continued, creating new lows for the session.

Recognizing Key Indicators

At Hawkeye Traders, we use specific indicators to highlight significant volume events.

Our wide bars, marked in magenta, represent candles with volume exceeding a certain threshold, indicating heightened trader activity and emotional responses. 

Identifying these wide bars can provide valuable clues about potential market directions.

For example, after the initial spike and subsequent decline, neutral volume followed, suggesting the absence of continued buying interest. 

The market then broke the low of the initial candle, retested, and continued downward, offering substantial trading opportunities.

Practical Application

Understanding where and when emotion occurs in the market can be incredibly powerful. 

By recognizing high volume areas and the subsequent control shift between buyers and sellers, you can make more calculated trading decisions. 

This approach is not limited to intraday trading; it applies to day trading, swing trading, and position trading across various markets, including stocks, futures, forex, and cryptocurrencies.

Our indicators are compatible with platforms like TradingView, TradeStation, NinjaTrader, and MetaTrader, making it accessible for all retail traders.

Access Hawkeye Indicators and Volume Mastery Training Today

Incorporating volume analysis in trading strategy can significantly enhance your market understanding and trading success. 

By focusing on the interaction between volume and price action, you can gain a clearer picture of market dynamics and improve your trading outcomes.

Thank you for joining me in this deep dive into volume analysis in trading. Stay disciplined, patient, and always keep learning. 

I look forward to sharing more insights with you in the next video. All the best!

Happy Trading,

What’s on deck for Ethereum?

Ethereum

What’s on deck for Ethereum? 

Anthony Speciale here with Hawkeye Traders. 

Today, I’m excited to take you through an in-depth analysis of Ethereum, focusing on the intricate relationship between volume and price action. 

By the end of this post, you’ll understand how to identify potential market turns and make more informed trading decisions.

Revisiting Ethereum’s Highs

Let’s dive right in… 

Recently, Ethereum revisited its previous highs, pushing up and spending significant time there. 

However, we noticed that the buying interest waned at the top, leading to a notable pullback. 

Despite some strong buying activity and a recovery attempt, the momentum wasn’t sustained. 

Using Hawkeye’s tools, we could see a wide bar push with notable buying volume, but the price failed to secure the channel structure.

Understanding Volume Climax

One of the critical elements we focus on at Hawkeye is identifying volume climaxes. 

For instance, we observed a specific candle with ultra-high volume radar dots. 

Despite the high volume, the presence of sellers created a significant upper wick, indicating resistance. 

After multiple attempts (11 to be precise), the price was unable to close above this crucial level, signaling potential downside.

Potential Downside Support Areas

Given the high volume and inability to sustain higher prices, we’re cautious about Ethereum’s potential to break higher. 

Instead, the lack of continued buying suggests we might see a pullback. 

We look at previous supply areas and note that Ethereum has retested and failed to push through these levels. 

This sideways movement, coupled with strong buying volume that failed to lead to a breakout, is concerning.

The Importance of Volume and Price Action

For every trade, whether it’s a day trade, swing trade, or position trade, the relationship between volume and price action is paramount. 

This approach isn’t limited to Ethereum or cryptocurrencies; it applies to stocks, futures, and forex as well. 

The Hawkeye methodology emphasizes that without confirming volume and price action, trading plans lack a critical edge.

Why You Should Focus on Volume and Price Action

Understanding volume and price action allows you to qualify your trades better and anticipate market moves more accurately. 

This focus has been game-changing for many traders, myself included. 

It provides a clearer picture of the market, helping you to make informed decisions and improve your trading outcomes.

How Hawkeye Tools Can Help

Hawkeye offers a suite of indicators designed to help you analyze volume and price action effectively. These include:

  • Wide Bars
  • Ultra High Volume Radar Dots
  • Paint Bars
  • Pivots

These tools are compatible with platforms like TradingView, TradeStation, NinjaTrader, and MetaTrader, and can be applied to various markets and timeframes.

Your Next Steps

If you want to enhance your trading strategy with volume and price action analysis, I invite you to:

  • Watch Our Training Webinar: Gain detailed insights into using Hawkeye tools.
  • Access the Hawkeye Mastery Library: Learn to spot key market signals.
  • Reach Out to Us: Contact our team for a personalized demonstration and answers to your questions.

By focusing on what truly matters – volume and price action – you can significantly improve your trading performance. 

Click here now to get started, and let’s take your trading to the next level.

Final Thoughts

Trading is about stacking the odds in your favor, and understanding the relationship between volume and price action is a crucial component. 

Apply these insights to your trading plan, and you’ll see the difference it makes.

Thank you for reading, and I hope this post has provided valuable insights. 

Happy Trading,

Volume Climax: The Key to Trading Success

Volume Climax

Are You Equipped To Call The Next AAPL High? Learn how with these Volume Climax Insights.

Anthony Speciale here from Hawkeye Traders.

Today, I’m excited to walk you through a fascinating case study on how to precisely identify significant price levels using the power of volume and price action.

Specifically, we’ll explore how I pinpointed one of Apple’s prior highs with near-perfect accuracy and how you can apply the same techniques to your own trading.

Understanding All-Time Highs and Market Resistance

As we approach all-time highs, it’s crucial to understand what these levels indicate and how they can influence market behavior. Let’s dive into one of Apple’s recent highs and break down the process using Hawkeye Indicators.

The Hawkeye Wide Bar: Spotting Market Resistance

During a recent attempt to push past an all-time high, Apple formed a wide bar on the chart. This wide bar, which closed higher than it opened, was accompanied by Hawkeye volume indicating a dominance of sellers. What does this tell us?

  • Significance of the Wide Bar: The wide bar signals an area of resistance. Sellers stepped in aggressively, preventing the price from moving higher.
  • Wick Resistance: The presence of a wick at the top of the wide bar suggests that sellers were strong enough to push back against the buyers, creating a potential resistance level.

Ultra High Volume Radar Dot: Identifying Volume Climax

One of the most powerful signals in volume analysis is the Ultra High Volume Radar Dot. Let’s focus on a specific candle that highlights this perfectly:

  • Tiny Candle, Huge Volume: On March 15, 2023, a very small candle formed, with a total movement of about 87 cents. Despite its size, the volume was extraordinarily high, one of the highest in the past 12 months.
  • Volume Climax: This occurrence is known as a volume climax, where there is a surge in volume but minimal price movement. This typically indicates a potential turning point as buyers or sellers exhaust their momentum.

Analyzing the Impact

Following the volume climax, we observed a massive sell-off.

This tiny candle at a significant resistance level was a clear indicator that buyers had lost interest, leading to a substantial drop in price.

  • Market Reaction: The market’s reaction to these signals can provide lucrative trading opportunities. Recognizing these patterns allows traders to anticipate market moves and position themselves accordingly.

Applying Hawkeye Indicators to Your Trading

The examples above demonstrate the critical role of volume and price action in identifying market turns. By incorporating Hawkeye Indicators into your trading strategy, you can enhance your ability to spot these pivotal moments.

  • Hawkeye Wide Bar: Use this tool to identify areas of potential resistance or support where significant market moves are likely to occur.
  • Ultra High Volume Radar Dot: This indicator helps you detect volume climaxes, signaling possible market reversals.

Why Volume and Price Action Matter

After over a decade of trading, I can confidently say that understanding the relationship between volume and price action is fundamental to trading success.

Unlike lagging indicators, volume and price action provide real-time insights into market sentiment and potential future movements.

  • Universal Application: Whether you trade stocks, futures, forex, or cryptocurrencies, and whether you’re a day trader, swing trader, or position trader, volume and price action analysis is universally applicable and incredibly valuable.

Get Started with Hawkeye Traders

Are you ready to elevate your trading by mastering volume and price action?

I encourage you to explore the Hawkeye Indicators and access our Mastery Library.

These tools are designed to help you identify major trade setups and make informed trading decisions.

Take the Next Step

  • Watch the Training Webinar: Click the link below to access our comprehensive training webinar, where we dive deeper into these concepts.
  • Contact Our Team: Reach out to us for a personalized demonstration or any questions you may have.

Watch the Training Webinar

Understanding how to read the market through volume and price action is a game-changer. Don’t miss out on the opportunity to enhance your trading skills with Hawkeye Indicators.

Happy Trading,

Anthony Speciale

Hawkeye Traders

Big Energy Profits

Real-Time Trading Using Wide Bar and Volume Radar

real-time trading

Identified LIVE: Real-Time Trading with Hawkeye WideBar Triggers Sell-Off, Ultra-High Volume Radar Triggers Rally

Anthony Speciale here from Hawkeye Traders.

I’m thrilled to share insights from a recent real-time trading session where we leveraged the Hawkeye Wide Bar and Ultra High Volume Radar Dot to make informed trading decisions.

This post is tailored specifically for retail traders eager to enhance their market strategies using volume and price action analysis.

The Power of Volume and Price Action

Volume and price action are foundational to successful trading.

They provide real-time trading insights into market dynamics, helping traders make informed decisions. In this session, we focused on WTI Light Sweet Crude Oil, using a three-minute chart to pinpoint entry and exit points.

Key Indicators and Their Interpretation

  • Hawkeye Wide Bar: This magenta-colored bar signifies significant market movement. When it appears, it indicates a potential shift in market direction.
  • Ultra High Volume Radar Dot: This marker signals intense buying or selling pressure. Understanding its implications can help predict market reversals.

Real-Time Analysis and Trades

During our real-time trading session, we identified a resistance level around 76.12.

Despite strong buying volume, the market struggled to break through this level. This was our first clue that a reversal might be imminent.

At 8:06 AM EST, the Hawkeye Wide Bar confirmed our suspicion.

I initiated a short trade at the close of this candle, with a stop loss slightly above the high. My targets were set based on prior price action, aiming for 75.90, 75.80, 75.70, 75.60, and ultimately 75.45.

The market hit our final target of 75.45, yielding a high reward-to-risk ratio of 12.8:1.

This trade exemplifies the precision and effectiveness of using volume and price action for real-time trading analysis.

The Reversal Signal

At 9:00 AM EST, a significant Ultra High Volume Radar Dot appeared, marking the highest volume of the session.

This high selling volume, coupled with the inability to push prices lower, indicated a selling climax.

Recognizing this, we anticipated a reversal, setting up a long trade that also yielded substantial gains.

Why Volume and Price Action Matter

Volume and price action are the only leading indicators in the market.

They reveal the balance between buyers and sellers, offering a clear picture of market sentiment.

By understanding this relationship, traders can validate or invalidate their theories, making more confident and precise trades.

Consistency Across Markets

The principles of volume and price action are universal, applicable across various markets, including stocks, futures, forex, and cryptocurrencies.

While my focus is often on the futures market, these techniques are beneficial for all trading styles and asset classes.

Join Us and Enhance Your Trading Skills

If your current trading strategy does not prioritize volume and price action, it might be time for a change.

Understanding these elements can significantly improve your trading outcomes.

I encourage you to explore the Hawkeye Mastery Library, where you can learn to apply these principles effectively.

As a dedicated user and advocate of Hawkeye Traders, I’ve seen firsthand how these tools can transform trading success.

We offer comprehensive resources and support to help you master volume and price!

Trading is not just about following signals; it’s about understanding market dynamics.

By integrating volume and price action into your strategy, you can make more informed decisions and achieve consistent success.

For more detailed insights and personalized guidance, connect with our team.

We’re here to help you every step of the way!

Happy Trading,

Anthony Speciale

Hawkeye Traders

Big Energy Profits

Intraday NASDAQ Trading: Enhancing Market Analysis

Intraday NASDAQ Trading

Intraday NASDAQ Trading: “Red Top” Precedes Failed Ultra-High Buying Volume Candle

Welcome to another insightful, market analysis training session.

Today, we’re diving into the intricate world of intraday NASDAQ trading, focusing on a vital yet often overlooked aspect: knowing how to “look left”.

In this session, I’ll illuminate the power of understanding volume and price action, and how mastering this relationship can significantly enhance your trading performance.

The Core of Successful Trading

At Hawkeye Traders, we emphasize the foundational importance of volume and price action. Regardless of what additional indicators or tools you use, if you don’t grasp these two key elements, you’re navigating the market with a blurred vision.

Intraday NASDAQ trading relies on volume and price action as the universal constants across all market conditions and time frames. They provide a clear, unadulterated view of the market’s intentions, enabling you to anticipate potential movements accurately.

Intraday NASDAQ Trading

Volume and Price Action

Our methodology is not just about providing you with indicators; it’s about teaching you to understand the relationship between volume and price action.

This knowledge is crucial for developing a robust trade plan and an effective risk management strategy. By focusing on these core elements, you can strip away the noise and distractions that often clutter trading charts.

In today’s session, we analyzed the NASDAQ 100 Futures using a three-minute chart. This means each candle represents three minutes of market activity.

Our unique indicators, such as the paint bar and wide bar, play a critical role in interpreting market conditions.

The paint bar reflects the volume traded within each candle, while the wide bars signal significant volatility compared to prior bars, alerting traders to potential market shifts.

LIVE Intraday NASDAQ Analysis

Let’s delve into a practical example from our LIVE trading session.

At the opening bell of the US market (9:30 a.m. EST), we observed the highest volume traded so far during the Globex session. This moment was marked by a red volume radar dot and a wide bar, indicating significant market activity and potential volatility.

To make sense of this, we looked left—examining past price actions to gain insights into future movements. This approach is akin to reading a roadmap: the more you understand past movements, the better you can predict future directions.

We identified key resistance levels by marking prior session highs and analyzing the market’s response at these points.

For instance, at 8:15 a.m. EST, we noted a “red top”—a newly appointed high on high selling volume. This indicator often signals a strong turning point.

By marking this candle and observing subsequent market behavior, we could anticipate potential resistance levels.

The Importance of High and Low Points

As the market progressed, we observed that despite strong buying volume at the opening bell, the market failed to surpass the prior high.

This inability to break through a resistance level, despite high buying volume, indicated that the buyers’ momentum was weakening.

Consequently, this led to a lower high formation—a strong signal that the market might reverse direction.

Our analysis showed that this red top, combined with the lower high and significant selling volume, created a strong resistance area.

This informed our trading strategy, allowing us to anticipate a market downturn and prepare accordingly.

The Power of Disciplined Trading

This session underscored the importance of disciplined trading and the ability to recognize when not to trade.

By focusing on the relationship between volume and price action, you can develop a clear, confident approach to intraday NASDAQ trading.

This foundation will help you avoid unnecessary trades and preserve your capital for more opportune moments.

Trading is not just about seizing every opportunity; it’s about making informed, strategic decisions based on a solid understanding of market dynamics.

By mastering the art of knowing when not to trade, you can enhance your overall trading performance and achieve sustainable success in the market.

Remember, trading is a journey of continuous learning and improvement.

Stay focused, stay disciplined, and always prioritize understanding the fundamental relationships in the market.

Thank you for joining us today. We hope this analysis has provided you with valuable insights to refine your trading strategy. See you in the next training video!

Join the Hawkeye Family of Traders and take your trading to new heights!

Real-Time Analysis Strategies: Understanding Market Movements

Real-Time Analysis Strategies: Understanding Market Movements

Calling The Morning Session High Using Volume in Real-Time Analysis

Welcome, traders! Today, we’re diving into a crucial aspect of trading that often separates the successful from the struggling: understanding volume and price action.

I’m Anthony Speciale, and I’m thrilled to share this insightful presentation with you.

Let’s cut to the chase: volume precedes price action.

But does it guarantee success every time? No.

However, grasping the relationship between volume and price action can give you a significant edge in the market—something beyond your wildest dreams.

Before we delve into the specifics, it’s essential to establish credibility.

Real-Time Analysis Strategies: Understanding Market Movements
Real-Time Analysis

Everything I’m about to discuss was identified live, in real-time, with traders actively trading live money.

Why does this matter? Because it’s easy to analyze historical charts and claim insights. But live, real-time analysis requires a deep understanding of volume-price dynamics.

Let’s zoom in on a specific example: the 8:54 a.m. Eastern Standard Time candle on Light Sweet Crude Oil, depicted on a 3-minute chart.

Notice the small body with a significant wick—a classic reversal candle. At that moment, buying volume surged, indicating bullish momentum.

However, despite the spike in volume, the price failed to sustain upward movement.

This scenario illustrates a crucial point: volume provides insight into potential market direction. In this case, high buying volume preceded a sharp price decline.

Similarly, during an inventory report, ultra-high buying volume collided with a known resistance level, resulting in a swift market reversal.

Understanding volume and price action enables traders to anticipate market movements.

For instance, a high buying volume without follow-through suggests impending downward pressure, while ultra-high selling volume near a support level hints at potential price rebounds.

But how do we interpret volume and price action effectively?

It boils down to three key elements: volume, price action, and market context.

These pieces form the foundation of any successful trade plan.

Without a clear understanding of these components, adding more indicators or cluttering your charts won’t enhance your trading performance.

To illustrate, let’s consider my approach. I use two charts: a reference chart with indicators and a clean chart focusing solely on price action and volume. This dual perspective allows me to capture market nuances and make informed decisions.

Now, let’s address a common misconception: cluttered charts.

Many traders overload their screens with unnecessary indicators, obscuring the fundamental drivers of market movements.

In reality, volume and price action are the primary drivers of market behavior, applicable across all asset classes and time frames.

To help traders master these essential concepts, we offer our clients access to the Hawkeye Price Action and Volume Mastery Library.

These comprehensive resources provide in-depth insights into volume-price dynamics, equipping traders with the tools to navigate any market condition effectively.

Ultimately, success in trading hinges on your ability to interpret volume and price action.

No fancy indicator or software can compensate for a lack of understanding in these areas.

By investing in your education and mastering these core principles, you’ll unlock the key to consistent, disciplined, and profitable trading.

If you’re serious about elevating your trading game, I encourage you to explore our educational resources and reach out to our team for personalized guidance.

Together, let’s embark on a journey towards trading mastery.

Thank you for joining me in this exploration of volume and price action.

If you found value in this content, please like, comment, and subscribe to our channel for more insights.

Remember, click here to access our educational resources below—take the first step towards trading success today.

Wishing you abundance and prosperity in your trading journey!

Click here to watch the video and transform your trading journey today!

Ready To Transform Your Trading?  Contact Us Today!

Email: [email protected] – OR – Call: 888-233-8598


Happy Trading,

Anthony Speciale

Hawkeye Traders

Big Energy Profits

Volume Climax: Essential Techniques for Spotting Market Turns

Essential Techniques for Spotting Market Turns


TO SEE A MORE DETAILED TRAINING CLICK HERE

Every trader seeks the edge that will enhance their market success, and one of the most effective ways to achieve this is by mastering volume analysis. 

Understanding volume climaxes can dramatically improve your ability to pinpoint market highs and lows, providing you with the confidence to make well-timed trades. 

In our latest training video, we dive deep into this technique using a real-time example from today’s Gold Futures market.

Why Volume Climaxes Are Key:

A volume climax can be a critical indicator in trading, often signaling a potential reversal in the market. 

These climaxes occur when there is a sudden and significant increase or decrease in volume, indicating that the current trend may be reaching its peak strength and could soon exhaust. 

Recognizing these moments allows traders to anticipate market downturns or rallies, providing a strategic advantage in entering or exiting trades.

In the video above, I analyze a specific instance in the Gold Futures market where a significant high was identified and subsequently followed by a decline. 

This scenario illustrates:

  • The Role of Decreasing Volume: Just as the market reached a session high, the volume significantly dropped compared to the previous four candles. This decrease is a classic signal that the high might fail.
  • Practical Application: You’ll see how this information could have been used to predict a drop of approximately 126 ticks in Gold, translating into a significant potential gain per contract.
Essential Techniques for Spotting Market Turns
Volume Climax

By understanding the signs of a volume climax, you not only avoid common pitfalls that many traders fall into but also enhance your potential for making profitable trades. 

This video is not just about theory; it’s a practical guide that:

  • Enhances Decision Making: Learn to make informed decisions based on the analysis of volume trends.
  • Improves Trade Timing: Better timing for entering and exiting trades can significantly increase your trading efficiency and profitability.

Watch a more detailed training here and Learn the secrets that only the most profitable traders know

Don’t miss this opportunity to refine your trading strategy with our expert insights into volume climaxes and start applying these techniques to your trading. 

Understanding the ‘when, where, why, and how’ of volume climaxes will empower you to execute more successful trades and build a more robust trading plan.

It’s time to take your trading to the next level! Watch a more detailed training video by clicking the link below and gain the confidence to identify and act on crucial market signals. 

You can’t afford to let another profitable volume-based opportunity pass you by

For any queries or further discussion, feel free to contact us through the details provided below the video. 

Don’t forget to like, subscribe, and comment to stay updated with our latest trading insights!

Happy Trading,

Anthony Speciale

Hawkeye Traders

Netflix in Elon Musk’s crosshairs means opportunity

Today I want to share with you a groundbreaking technology that would have gotten you into Netflix in December turning every $1,000 you invested into $11,160

The great thing is we’re seeing another setup that could be even bigger.

But first, let’s talk about Netflix.

Last week Netflix’s stock price crashed.

For the first time in ten years, the company lost subscribers.

The CEO blames the loss on password-sharing and the economy.

Maybe, but many think there is a bigger issue at play.

Elon Musk put it best, “The woke mind virus is making Netflix unwatchable.”

His tweet says what many are thinking.

Netflix thinks it’s more important to spread woke ideas than to make good content. People hate that the company has canceled good shows, or changed them, to push some leftist agenda.

This may work for getting praise on social media. But, it doesn’t help make better content and shareholders are responding with their wallet.

It’s not surprising that Netflix is losing subscribers. And it’s not surprising that their share price is crashing.

But, knowing why the price is dropping in hindsight doesn’t make you money.

It’s all about knowing before it happens and Hawkeye users have known the drop in Netflix’s share price was coming since December!

When our algorithm turns all red it’s time to sell.

And if you had known, you could have made a whopping 1116% trading the netflix 55.5, 6 month 30 delta put!

Hawkeye enables you to see what the big players are doing in real time.

These are the guys that make things happen. They make up most of the market. And when their money moves, the market moves. And with Hawkeye, you can follow their money and line your pockets.

In fact, there are several opportunities shaping up as I write this.

So click over to learn how you can get access to the Hawkeye Software and capitalize on the next big move.

Click here to see how you can get in before the next big move (hint, it’s happening now).

The hottest trades in the market right now

Grab a cup of coffee or tea because we’ll be covering a lot during today’s free training:

We’ll go over multiple of the hottest trades in the market right now, according to the Hawkeye Scanner…

DPZ and Bill Ackman’s 6% stake in Domino’s Pizza…

How the new infrastructure plan will have a big impact on a certain group of companies (revealed in the training)…

And much more!

You think this is helpful content?

Wait till you see what’s behind the scenes when you join Hawkeye Traders!

Free training: Tesla, new trade opportunities, and much more!

Coach J.R here coming to you with some solid money-making tips.

We’re going to review some trades the Hawkeye Scanner has picked up… live!

We’ll talk about the levels where you can still trade Tesla profitably.

And we’ll close it by talking about some settings you can use to maximize your trading results when using the Hawkeye software.

Let’s get into it:

If you want more trade ideas like these and to take advantage of the Hawkeye System, click here to join the Hawkeye Community.

Check‌ ‌out‌ ‌these‌ ‌3‌ ‌charts‌ ‌before‌ ‌next‌ ‌week‌

Today‌ ‌I’m‌ ‌gonna‌ ‌make‌ ‌your‌ ‌week!‌ ‌

But‌ ‌not‌ ‌THIS‌ ‌week…‌ ‌rather‌ ‌the‌ ‌next‌ ‌one.‌ ‌

Because‌ ‌I’m‌ ‌bringing‌ ‌you‌ ‌3‌ ‌charts‌ ‌that‌ ‌you‌ ‌need‌ ‌to‌ ‌look‌ ‌at‌ ‌if‌ ‌you‌ ‌want‌ ‌to‌ ‌get‌ ‌in‌ ‌some‌ ‌
solid‌ ‌trades‌ ‌next‌ ‌week.‌ ‌

Plus,‌ ‌I‌ ‌recorded‌ ‌a‌ ‌training‌ ‌where‌ ‌I‌ ‌teach‌ ‌you‌ ‌how‌ ‌to‌ ‌“stay‌ ‌in‌ ‌the‌ ‌trend”‌ ‌and‌ ‌a‌ ‌couple‌ ‌
other‌ ‌things‌ ‌that‌ ‌I‌ ‌don’t‌ ‌want‌ ‌to‌ ‌reveal‌ ‌yet‌ ‌;)‌


And‌ ‌as‌ ‌promised,‌ ‌here‌ ‌are‌ ‌the‌ ‌3‌ ‌charts‌ ‌with‌ ‌my‌ ‌thoughts…‌ ‌


I‌ ‌am‌ ‌not‌ ‌surprised‌ ‌at‌ ‌all‌ ‌to‌ ‌see‌ ‌WFC‌ ‌so‌ ‌often‌ ‌on‌ ‌our‌ ‌scanner.‌ ‌After‌ ‌some‌ ‌terrible‌ ‌PR‌ ‌-‌ ‌
due‌ ‌to‌ ‌self-inflicted‌ ‌malpractices‌ ‌in‌ ‌their‌ ‌banking‌ ‌business‌ ‌-‌ ‌I‌ ‌see‌ ‌the‌ ‌stock‌ ‌making‌ ‌a‌ ‌
strong‌ ‌comeback‌ ‌and‌ ‌one‌ ‌of‌ ‌the‌ ‌good‌ ‌inflation‌ ‌hedges‌ ‌available‌ ‌for‌ ‌investors‌ ‌and‌ ‌
traders.‌ ‌So‌ ‌keep‌ ‌an‌ ‌eye‌ ‌on‌ ‌it.‌ ‌


Catherine‌ ‌Wood‌ ‌does‌ ‌give‌ ‌some‌ ‌light‌ ‌about‌ ‌the‌ ‌new‌ ‌market‌ ‌structure‌ ‌many‌ ‌seem‌ ‌to‌ ‌
forget.‌ ‌We‌ ‌have‌ ‌boomers‌ ‌and‌ ‌millennials‌ ‌in‌ ‌the‌ ‌game,‌ ‌while‌ ‌before‌ ‌it‌ ‌was‌ ‌only‌ ‌one‌ ‌
demographic,‌ ‌but‌ ‌now‌ ‌young‌ ‌generations‌ ‌understand‌ ‌the‌ ‌business‌ ‌of‌ ‌trading,‌ ‌and‌ ‌yes,‌ ‌
they‌ ‌may‌ ‌have‌ ‌a‌ ‌short-term‌ ‌view‌ ‌still,‌ ‌they‌ ‌provide‌ ‌new‌ ‌buy‌ ‌impetus‌ ‌to‌ ‌this‌ ‌bull‌ ‌market.‌ ‌
So‌ ‌yes,‌ ‌trading‌ ‌volume‌ ‌increases‌ ‌and‌ ‌so‌ ‌players‌ ‌like‌ ‌SCHW‌ ‌will‌ ‌reach‌ ‌new‌ ‌highs.‌


The‌ ‌big‌ ‌reopening‌ ‌opportunities‌ ‌are‌ ‌set‌ ‌to‌ ‌explode‌ ‌in‌ ‌2022.‌ ‌MGM‌ ‌not‌ ‌only‌ ‌on‌ ‌the‌ ‌leisure‌ ‌
front,‌ ‌also‌ ‌on‌ ‌the‌ ‌new‌ ‌business‌ ‌volume‌ ‌it‌ ‌will‌ ‌get‌ ‌from‌ ‌sports‌ ‌betting‌ ‌and‌ ‌never‌ ‌forget‌ ‌
they‌ ‌still‌ ‌have‌ ‌Macau.‌ ‌You‌ ‌cannot‌ ‌miss‌ ‌this‌ ‌stock‌ ‌and‌ ‌ride‌ ‌the‌ ‌bullish‌ ‌trend‌ ‌we‌ ‌all‌ ‌must.‌ ‌

Hope‌ ‌this‌ ‌was‌ ‌super‌ ‌helpful!‌ ‌ ‌

If‌ ‌you‌ ‌want‌ ‌more‌ ‌help‌ ‌from‌ ‌the‌ ‌Hawkeye‌ ‌scanner‌ ‌and‌ ‌software,‌ ‌its‌ ‌community,‌ ‌and‌ ‌the‌ ‌
Hawkeye‌ ‌team…‌ ‌

Click right here to become a Hawkeye Trader

The 6 ways the market moves

Today we’re going back to the basics of the Hawkeye Methodology. But don’t get that wrong…

Just because we’re talking about basics doesn’t mean this isn’t incredibly powerful.

As with everything, the key to success relies on the fundamentals and proven principles.

If you watch boxing or mixed martial arts you’ve seen this a million times. The fighter that wins the most is the one who has solid fundamentals, not the one who throws weird punches or spinning kicks.

With trading, something similar happens. Once you can understand the structure of how the market moves, then you can “read” and track trends.

And that’s precisely what we’re going to cover today: the six ways the market moves.

(Grab a pen and take notes because this is information that we only share with paying members)

Okay, let’s get into it…

Identifying what the market is doing and how it’s moving is absolutely vital for your success as a trader.

Luckily, there are only 6 ways a market can move:

  • Trend
  • Trend Pause
  • Congestion entrance
  • Congestion
  • Congestion exit
  • Trend reversal

So, how do we identify where we are in the market?

Using Isolated Lows and Isolated Highs.

Isolated Lows:

Isolated lows occur when there’s a lower low than both the previous bar and the next bar (Point A) and a lower high than both the previous bar and the next bar (Point A).

Phantom isolated lows occur when only the low condition Point A is met. At this point, there’s no need to see where the high is.

Isolated Highs:

Isolated highs occur when there’s a higher high than both the previous bar and the next bar (Point A) and a higher low than both the previous bar and the next bar (Point A).

And phantom isolated highs occur when only the high condition Point A is met. There’s no need to see where the low is for these guys.

So now that you know how to identify what’s happening in the market let’s talk about the different ways the market moves:

Trend Run

Trend runs are established (Point A) when the close is above the dot, the dot is rising and the close is greater than the open and in the top 40% of range.

At Point B the dot is equidistant from the previous point and continues to be equidistant.

Trend Pause

A trend pause is exactly the same as a trend run. However, when a close is under the dot and open (Point A) but the dot is still rising, it denotes a pause.

At that point, you’re looking to see resumption of the trend run (close being greater than the dot ). This should occur within three to five time frames.

Congestion Entrance

Congestion entrances happen when the close is under the dot and the dot is flatish to the previous dot. This is the congestion entrance (Point B). You then look for the last isolated/phantom high (Point A).

Congestion

Once the congestion entrance has been defined, you’re then waiting for the first isolated phantom low to form (Point B). This has to be within 5 bars.

Next, extend a dotted line from the isolated/phantom high (Point A) and the isolated/phantom low (Point B), you then have your congestion high and low.

As the chart continues, you’ll see new lower isolated highs (not phantoms) and isolated lows developing. You then move your congestion parameters to these newly formed pivots (Point C and Point D). It should be noted that you can only contract in congestion.

If after congestion entry, there are no isolated / phantom low formed within 5 bars, you are then in a trend run down and should trade it according to the rules.

Congestion Exit

Once you’ve got defined congestion, you’re waiting for a close either above the last isolated high (Point C) or below the last isolated low (Point D).

At Point E, the close is greater than at Point C and a congestion exit to the upside has commenced. The bar close must be greater than the open and in the top 40% of the range of the bar (approximately).

In this example at Point E, the dot has also closed above the dotted line at Point C. This is a stronger indication of congestion exit but a close also greater than Point C is sufficient.

Our final market move to cover today is…

Trend Reversal

At Point B, the bar is wide and the dot is less than the dot 3 bars previously and the close is less than the dot.

And there you have it, all of the possible ways for the market to move, Now that you understand that, we’ll build on that foundation with more complicated concepts next time.

This is just the tip of what we cover inside Hawkeye Traders…!

If you want to get access to all the money-making secrets, tactics and strategies we use inside Hawkeye Traders to consistently generate profits from the market…

Click right here to become a Hawkeye Trader

Don’t do THIS with Tesla’s stock!

I’ve got something very important to tell you about…

Everyone’s talking about Tesla right now, and most people are dead WRONG!

If you’ve been thinking about trading Tesla, or are looking into it…

Please watch today’s training before you do anything!

But that’s not all I talk about in the training..

Nooo, this one is packed!!

We’re also going to cover some trade ideas the Hawkeye Scanner has presented for the week ahead and how to have conviction of when and where to buy.

Want to use the Hawkeye Methodology to find trades like these? Click right here!

THIS sector is red hot

The Hawkeye Scanner came today with a report full of opportunities…

And after reading through them I found a GOOD one that I want to talk to you about.

Goldman Sachs.

Investment banks have been red hot and beating expectations.

So I want to show you how to take advantage of this trend.

Want to get the best ideas without the extra work of chasing trades or investment?

Click right here to do so…

My favorite trading strategy and a new ticker

In today’s training video we’ll cover:

The newest trade opportunity – courtesy of the Hawkeye scanner – and how we’re working the trade. Plus, I’ll share the ticker with you.

My favorite trading strategy where I wait until the end of the day to look at the data and pull the trigger with more upside.

And how to use the Hawkeye Methodology to move the odds in your favor.

Click here if you want to use the Hawkeye Methodology to increase your odds of success.

[URGENT] Check out this trade now

Today we’re doing a new training on Hawkeye Trader’s tools…

And we’re going to cover everyone’s favorite tool, the Hawkeye Scanner!

Why? Because the scanner just presented a trade that YOU can take advantage of right now…

Plus, I also cover the Facebook debacle and the opportunity with it, how to know when to exit the trend – and a secret tool I use to do so with minimal risk.

Want to use these tools I covered and take your trading to the next level?

Then click the link below:

Grab the Hawkeye Professional Package

New tickers, new secret tools and new strategies

A new issue of this video blog coming to you today…

We’re going to be using the Hawkeye Indicators to find and validate trade opportunities.

Full of new tickers, secret tools and strategies that will help you take your trading to the next level.

One of the main things we’re going to talk about today is how to spot momentum/penny stocks BEFORE anyone else and how to make money from them.

If you don’t want to miss out on any future winners…

You NEED Roadkill!

Click here to get Roadkill and never miss any winners again

Building watch lists + 3 tickers for this week

In today’s video I’ll show you…

Why the Hawkeye Scanner is such a powerful – yet easy to use – tool to build watch lists…

I’ll give you 3 tickers you need to pay attention to this week.. PLUS, I’ll break the trades down!

And I’ll reveal the one shift you need to make when you go from ‘chasing riches’ to trading for a living.

And if you’re ready to give the Hawkeye Software a chance…

Click here to discover how you can take your trading to the next level!

We fire back at Morgan Stanley

J.R. is back today breaking down two amazing plays our new scanner presented!

But that’s not all, because today J.R is going shooting back at this…

Mike Wilson at Morgan Stanley keep pulling sneaky tricks to scare people, but J.R is here to tell you what’s really going on!

Watch today’s training and discover Morgan Stanley’s real intentions

And if you’re ready to give the Hawkeye Software a chance…

Click here to discover how you can take your trading to the next level!

Free gift from the Hawkeye Scanner inside

Today we’re going BIG with the Hawkeye Scanner!

As you probably know by now, every Tuesday and Thursday I use the Hawkeye Scanner to bring you the stocks that you should be paying attention to.

And today, we are covering not 1… not 3… but 6 potential opportunities!

Both stocks and options plays…

That’s not all though, because we’re also talking about organizing your workday and how to analyze volume when we find new opportunities.

If you want to close all these opportunities as safely as possible…

Make sure to check out the Hawkeye Software here.

“3 stock ideas you MUST know TODAY”

Buckle up because today we’re going for a crazy ride!

I’m giving you access to a new, fresh out of the oven training where I cover…

3 stock ideas you MUST know TODAY. Yes, today as in September 16th!

What to do when the market is flat or there’s not much action going on…

How the Hawkeye Scanner makes my life way easier and how it can do the same for you…

And a couple hacks and tricks I’ll reveal in the training.

If you want more stock picks like the ones we covered in this training…

More juicy trading knowledge, hacks, and tricks…

And to use the Hawkeye Scanner to know where to look for buy or sell opportunities…

Then click right here, because there’s way more of that where it came from.

Maximize your profits with Hawkeye, step-by-step

You already know I love the outdoors…

So the trade we’re covering in today’s video blog is one that excites me.

I just recorded an amazing step by step training on how to use Hawkeye to find amazing trades and how I spot different profit opportunities within the trade.

We are going to start with the Hawkeye Scanner and a great opportunity it presented us.

Then I’m going to show you what data I use to validate trades the right way.

And then I’ll show you a couple tricks to maximize your profits and secure 60% plus gains like it’s nobody’s business.

Click here to learn more about the tools that changed my trading forever

What to do when the market is kicking your butt

As traders it’s normal for our performance to fluctuate.

Sometimes we’re kicking it out of the park.

Other times we’re on the receiving end of an arse kick by the market.

It’s a tough thing to go through…

We start to lose motivation, trade with insecurity and deviate from our trading plan.

It’s the name of the game we play.

But luckily for you, I’ve been in this game for 10 plus years.

So I’ve gotten my fair share of arse kicks from the market. Which means I know precisely what to do when things are going south.

There are 5 things you should be doing when this happens to you.

Let’s get into them:

#1. Don’t deviate from your trading plan

Your trading plan is designed to be your compass when navigating the markets.

And the destination is profits.

When you’re going through a rough patch stick diligently to your trading plan.

If you stay true and disciplined to your plan, you should at least remain profitable.

#2. Don’t trade out of revenge

When we suffer a big loss, it’s normal to try to make that money back fast.

This typically leads to “revenge trading”.

We start relying on hope instead of our plan, we take risky chances, and we take too long to cut losses.

My advice?

If you feel like a feeling of revenge is taking over your trading…

Reset and get back to it the next day.

#3. Chip it out

Start again slowly.

Do small trades with some profit.

As time passes, you will regain your confidence and work your way back to your normal volume.

#4. What to do if things go south again

If you get hit again, consider taking a day or two off and do something totally unrelated to trading.

Do not look at the markets or second guess yourself.

Trust the process.

#5. Talk to someone who understands what you’re going through

Trading is 90% emotional – yes, I always say this… because it’s true!

When we’re in a bad place emotionally with regards to trading, the best thing you could do is talk to a more experienced trader who’s been through the same you’re going through.

They’ll help you organize your thoughts, pinpoint your weak spots, get the fire back, and overall, see the light at the end of the tunnel.

Don’t have someone like that in your life right now?

No problem.

At Hawkeye Traders I personally host weekly Q&A calls where you can ask me ANYTHING you need help with.

Whether you need help with mindset, your trading plan, or picking a niche…

I’ll be there to give you a hand.

Click here if you’d like to join me on these calls and I’ll show you how it all works.

Boredom is Catastrophic to Trading

By Guest Contributor, Michele Hurlbut

Hi Everyone.

The markets have been a bit schizophrenic these last few weeks. They are moving along at a snail’s pace and then they have these sudden surges of activity that subside as quickly as they come and back to snail’s pace again.

In addition to watching out for the sudden volatility, you also have to fight the boredom as boredom is catastrophic to trading.

Of all the places boredom is not welcome, trading is where it can bring the most damage. In my lifetime, I have done some really interesting things so that I wasn’t bored any more; some good, some not so good.  And when it comes to trading, some really bad……

Boredom

How does boredom show up in trading you may ask?

Have you ever been waiting for your set up and it seems to be taking forrrrrevvvver?

All of a sudden, you glance over at your email that may be open on the other screen or start ‘chatting’ with a friend or trading buddy.  Next thing you know, five minutes have done by. You look over at your trade screen and your set up has passed you by.

Then you may become ‘irritated’ (my word, you may have another.)  That ‘irritation’ may lead to revenge trading or worse, calling yourself all sorts of names that don’t help the situation. Or, maybe you’re bored and so you start looking for ANY trade you can take just to DO something. (Naw, you’ve never done that, she says tongue in cheek.)  Ok, maybe you haven’t, but I can honestly say that I have. And on more than one occasion in my trading life time.

Boredom is catastrophic to your trading because it costs you 1) Opportunity and 2) Money!

And none of us want that.

Oh, but I can watch the markets and answer emails, you say to this newsletter as you read it; I’m a good multi-tasker.  Be honest with yourself, are you really?

Fully Focused

You are the only one you have to answer to and you are also the only one that knows your reality.  Many studies have shown that, while we can multi-task and get things taken care of, we can not FULLY FOCUS on more than one task at a time. And when you are trading, you want to be FULLY FOCUSED on your trading and the gyrations of the market that make you money.

The reason I bring all this up now is because I got bored the other day while watching my charts and waiting for my 3-Step Entry to appear.  It felt like it was taking forever!!

You may remember me talking a couple blogs ago about Every day be a better version of you.  I still practice that daily, and today I identified how boredom creeps into my trading day.

So I spent some quality time watching my charts and experiencing what my body and mind want to do when it thinks I am bored.  It was quite interesting being the outside observer.

Here is what I noticed; my concentration wandered time and time again, thinking about checking my emails or Skype to see if there was someone I could talk to. I had to consciously will myself not to do those things as I know how they take my focus off the markets.

When I hear the signal set up, and I’m not fully focused, I do not take the care I need to make sure the signal is a good one to take. While software can guide us, only the human mind can see the big picture and that takes focus!

I also recognize that sometimes we have to keep our hands busy and so I came up with a few ideas:  Shell pistachios, skin soaked almonds to make your fresh almond milk, play with a slinky, squeeze a grip strengthener, play with worry balls.  Anything to mindlessly occupy your hand.

Finally…

The key word here being ‘mindless’. I am sure you can think of a few others and I hope you do.

Disclaimer, I thought about adding yoyo to the list but it is not as mindless as one would think and you have to look away from your charts to untangle the mess that was just made 🙂

I hope you discover what ‘boredom’ looks like in your trading so that it will not be catastrophic to your trading career.

Great trading everyone and speak with you again soon.


Join Randy in the next free LIVE Hawkeye Demonstration Room held every Wednesday at 9.30am EST US (next session postponed until Wednesday, November 7th). You will learn more about volume and volume price analysis and see more examples and live trade setups. It is open to all.

Click this link for more information or to join us in class.

Learn to trade the Hawkeye way.

Randy Lindsey
Hawkeye Traders, LLC

Every Day Be a Better Version of You

Be a Better Version of You

By Guest Contributor, Michele Hurlbut

Hi Everyone.

Be a Better Version of You

I was talking with my mentor a few weeks back and I was marveling at how he saw the market and how it reminded me that I have so much more to learn. I half-jokingly said to him “when I grow up I want to be just like you! :)”

He replied, “Don’t be like me, be a better version of you!”

I had one of those ‘ah ha’ moments. If I set a goal every morning to be a better (trading) version of me, what I could accomplish would be endless.

We all say ‘that would be nice’ and ‘I am going to do that’ when we hear something interesting but when it comes down to the mechanics of figuring out how to do it and then implementing it, I frequently fall short.

So, How to Change for the Better?

This time the desire to do this resonated deep inside me. The one thing that eluded me was ‘how?’.

I thought, I can just let it set like all the other neat things I came across that never actually got done or I could make concrete plans on how. I chose the latter.

Now, how do I do that??

I sat in front of my charts and stared at them wondering, what can I do (or not do) that would make me a better trader, a better version of me? So many things came to mind. How could I possibly address them all?! I have to admit, there was a bit of overwhelm and I wanted to run and hide.

Well, that won’t accomplish anything I told myself.

Then a light bulb went on, what is the biggest thing I do now that hurts my P&L? That, if I stopped doing that one thing, would make me a better version of myself?

I found my answer.

Changing to a Better Version

Before I started with Hawkeye’s trend following system, I was a counter trend trader. I had success with it for some time until the market volatility changed about three years ago and trading that way killed me.

But, because I had had success with it, I still had a nasty habit of taking counter trend trades (and getting killed in the process.) If I just stopped doing that, not only would I not be losing my profits gained by my trend trades but I would also be following my Trade Plan more effectively.

That is my one thing to concentrate on changing.

Every morning I set my intentions to be a better version of myself from the day before. I bring it to the front of my mind and let it sit there. I form a plan around how I am going to accomplish my goal.

First, I had to identify how I started to feel and act prior to taking the counter-trend trade. For me, I would get antsy to ‘do something besides just watching the charts waiting for the trend to develop.’ I would start to sit closer to the charts, start reaching for the mouse and start clicking around looking for a reason to take a trade.

Once I had identified my physical and emotional reactions, now I could work on relaxing myself when they appeared. And that was what I did.

Every day I concentrated on achieving my goal for the day. And every day it got easier and easier to do.

My P&L got better also.

Being a Better Version – Every Day

Now I do not have to worry about that urge and subsequent giving in to it hurting my trading. It is gone and a thing of the past. I am a better version of myself in that regard.

I have not taken a counter trend trade in three weeks!

And I have also learned a new skill that I am using to work on other trading issues that I want to make better.

I hope this note helps you to also be a better version of you as it has me.

Great trading everyone and speak with you again soon.


Join Randy in the next free LIVE Hawkeye Demonstration Room held every Wednesday at 9.30am EST US. You will learn more about volume and volume price analysis and see more examples and live trade setups. It is open to all.

Click this link for more information or to join us in class.

Learn to trade the Hawkeye way.

Randy Lindsey
Hawkeye Traders, LLC

[sg_popup id=13743]