This may be one of the most valuable pieces of information I’ve ever sent you.
Last week we discussed forensic analysis.
And as promised, today we’ll look at some applications of volume price analysis.
More specifically:
We’ll look at 5 concrete examples of what volume price analysis (aka forensic analysis) allows you to see in charts.
Ok, let’s jump right into it:
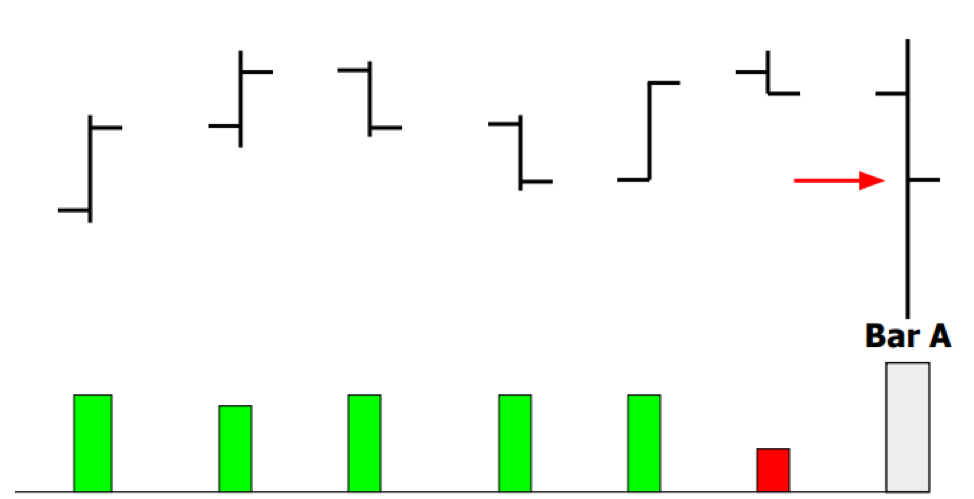
Wide Price Bar With High Volume

So as you can see in this example, Bar A is noticeably wider than the other “normal volume” bars.
This means you should expect greater than average volume.
The relationship of the close on Bar A is an indication of whether it is buying or selling.
In this example the close is in the bottom 1/3 of the range indicating selling pressure, which is also reflected in the red bar.
Wide Price Bar With Low Volume
If you have a wide price bar with low volume, that tells you something completely different.
In this case you should still expect a greater than average volume…
Yet, even though Bar A appears to have more volume than previous bars…
…for the price range of that bar, it should have had substantially more volume.
So this low volume bar is indicating a trend pause.
This is confirmed with the close being at the midpoint of the range.
Narrow Price Bar With Low Volume

With Narrow price bar you should expect low volume.
If you have a narrow price bar with low volume, this is telling you there’s no pressure to buy or to sell.
Bar A shows a narrow range and low volume – indicating a pause.
Even though the close is less than the open, it shows that there was no demand for selling.
You should expect for the next price bar to give you a confirmation of whether price is going to break out or break down.
Narrow Price Bar With High Volume in Uptrend

This is the same price bar as the example above, but the volume is much greater for such a narrow price bar.
Even at the top of the trend, Bar A shows that there is above average volume for that range, which indicates buying pressure.
If it was selling, the range would have been far greater as the bid and offer would have expanded.
Even though the close is less than the open, it is showing that this share was not being sold, in fact it is a sign of strength.
There was a failure to sell, which validates the buys.
Narrow Price Bar With High Volume in Downtrend

This is a narrow price bar in a downtrend.
It’s an indication of buying pressure.
Bar A shows there is above average volume for the range indicating buying.
Even though the close was less than the open, it indicates accumulation, for if it was selling the range would have been far greater.
Those are just some of the applications volume price analysis can have.
Inside Hawkeye we teach you how to make the most out of it — and we give you the tools to make it an easy process.
Plus, you can ask me anytime you have a question!
