Market Dynamics in Real-Time Trades

Join countless traders worldwide who use
the Hawkeye algorithms day in and day out to gain a powerful edge

Market Dynamics in Real-Time Trades

Global Market Dynamics: Lack of Buying Interest at Key Resistance Area Identified LIVE

Anthony Speciale here with Hawkeye Traders. I hope you’re having a wonderful day!

Today, I want to take you inside my trading process with a detailed breakdown of a trade I placed this morning.

This isn’t just about sharing my thought process; it’s about helping you understand how to make informed trading decisions in real-time.

In this blog post, I’ll walk you through the trade, the analysis behind it, and the outcomes, all backed by a video of the live trade.

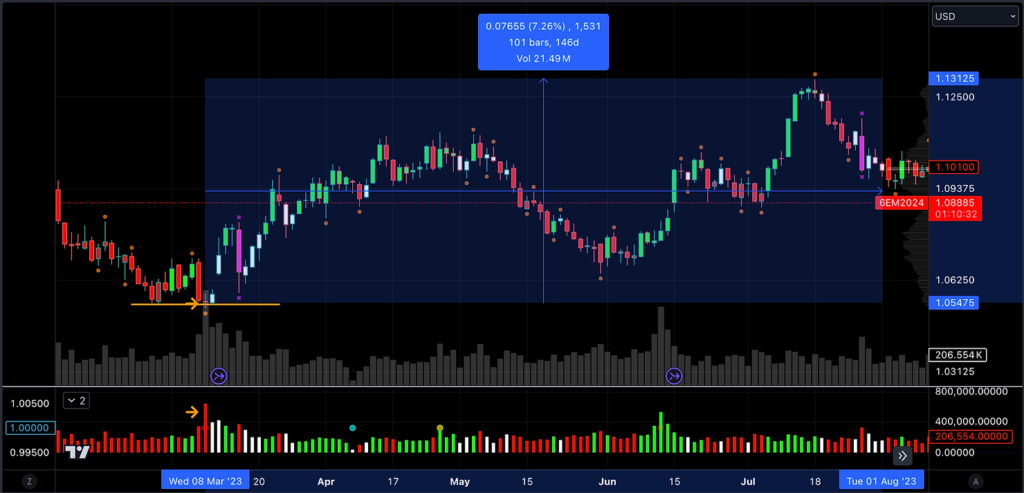
Analyzing the Trade: Sweet Crude Oil

As many of you know, I frequently trade sweet crude oil.

This morning’s trade is a perfect example of how understanding market dynamics and volume can lead to successful trades.

market dynamics

Let’s dive into the setup:

Overnight Market Movement: During the overnight session, the market made a high but then pushed lower, failing to retake that high before continuing to sell off. This initial movement set the stage for our trade.

Identifying Key Levels: As the market pushed higher, it fell into a consolidative state. By cloning the price action, we could clearly see the resistance level where the market was unsuccessful in pushing higher. This resistance was a critical line in the sand.

Volume Analysis: One of the most telling indicators was the lack of new buying interest. Despite occasional pushes in buying volume, there was no significant momentum to break through the resistance. Instead, every push resulted in a lower high, signaling a potential sell-off.

Executing the Trade

https://vimeo.com/987134236?share=copy 

Entry Point: Recognizing the signs of weakness and lack of buying enthusiasm, I entered a short position into momentum as the market started to break down from the consolidative state.

Profit Target: I identified a support level from previous analysis and set this as my profit target. The trade played out quickly, moving about 23 ticks in my favor. Though it was a short move, it was highly rewarding due to the leverage involved.

Volume and Price Action: Throughout this trade, volume was the key indicator. The absence of strong buying volume in an area of previous resistance suggested a high probability of a price decline. This understanding allowed me to confidently execute the trade and exit with a profit.

The Bigger Picture: Volume and Price Action

This trade underscores the importance of understanding the relationship between volume and price action. Volume tells the story of market intentions, and by reading these signals accurately, you can make informed trading decisions.

Join Me for an In-Depth Training Webinar

To help you master these concepts, I invite you to join my upcoming training webinar.

In this session, we will:

  • Dive deeper into the relationship between volume and price action.
  • Analyze real-time market movements and identify trading opportunities.
  • Provide access to the Hawkeye indicators and the Volume Mastery series.
  • Discuss how to apply these strategies to your own trading.

By attending this webinar, you will gain the tools and insights needed to improve your trading performance.

You’ll learn how to identify low-risk, high-probability trades and execute with confidence.

Why You Should Attend

Understanding volume and price action is crucial for any trader looking to succeed in the markets. This webinar will provide you with practical, actionable knowledge that you can apply immediately. Whether you’re a day trader or a swing trader, these insights will help you navigate the markets more effectively.

Register Now

Don’t miss this opportunity to enhance your trading skills and learn from a seasoned professional. Register for the training webinar today and take the first step towards more successful trading.

Register Here for the Training Webinar

I look forward to seeing you there and helping you achieve your trading goals.

Happy Trading,

Anthony Speciale

Hawkeye Traders

Big Energy Profits

High Probability Reversal Strategies

Tiny Candle + Massive Volume = High Probability Reversal

Welcome, traders! Anthony here with Hawkeye Traders. I hope you’re having a fantastic day.

Welcome to the video. Today, I’m excited to dive into a topic that often gets overlooked but holds immense potential for traders—volume and price action analysis.

Specifically, I’ll be sharing insights on how these tools can help you spot massive opportunities in the market.

Let’s jump right in . . .

Have you ever experienced that feeling of missing out on a golden opportunity?

You’re not alone. But what if I told you there’s a way to identify low-risk setups that others might overlook? That’s where volume and price action analysis come into play.

Imagine this: it’s Wednesday, March 8th, 2023, and you’re analyzing the Euro FX Futures Market. You notice an extraordinarily tiny candle with ultra-high selling volume.

Now, this might seem insignificant at first glance, but it could be the key to unlocking a major reversal in the market.

High Probability Reversal

Here’s the thing: when it comes to analyzing currency volume, I strongly recommend turning to the Futures Market.

Why? Because it offers a more accurate depiction of who’s in control of the market.

With legit volume readings from the CME, you can trust the data you’re working with.

Now, back to that tiny candle.

Tiny Candle + Massive Volume = High Probability Reversal
High Probability Reversal

Despite its size, the volume behind it speaks volumes (pun intended). It indicates a lack of follow-through from sellers, suggesting that a high probability reversal may be on the horizon.

This phenomenon isn’t exclusive to Futures—it applies to stocks, Forex, cryptocurrencies, and more.

But how can you leverage this insight to your advantage?

That’s where Hawkeye Traders comes in. Our tools are designed to help you identify key market dynamics, from volume surges to price action patterns.

With indicators like the Hawkeye paint bar and volume radar, you can gain a deeper understanding of market sentiment and potential reversals.

By focusing on volume and price action, you’re tapping into the most reliable data available.

Whether you’re a day trader, swing trader, or position trader, these principles hold true across all time frames.

It’s about understanding the relationship between volume and price movement and using that knowledge to your advantage.

Ready to take your trading to the next level? Reach out to us today and gain access to the Hawkeye Mastery Library.

With our tools and resources at your fingertips, you’ll be equipped to tackle the markets with confidence and precision.

Don’t underestimate the power of volume and price action analysis.

It’s the foundation of successful trading, and with the right tools, you can uncover hidden opportunities that others might miss.

Here’s to your success in the world of trading!

Happy Trading,

Anthony Speciale

Hawkeye Traders

Big Energy Profits

Double Top Strategy: Achieving Success in Trading

Double Top Strategy: Achieving Success in Trading

Welcome, traders! Anthony here with Hawkeye Traders. I hope you’re having a fantastic day and are ready to dive into a real, live trade that I identified and executed, focusing on the double top pattern.

This wasn’t just any trade—I called it live in front of other traders who were trading with real money.

While I can’t say whether they took the trade or not, my analysis was based on volume and price action, which led to what I believe was a great trading opportunity.

The Importance of Volume and Price Action

At Hawkeye, we emphasize the significance of volume and price action in trading.

Let’s break down the trade that highlights how crucial these elements are. The key moment occurred at 3:54 a.m. Eastern Standard Time. A Hawkeye Wide Bar formed, showing the highest buying volume since the overnight open.

However, what happened next is crucial: we saw rejection immediately after this high buying volume, indicating a potential exhaustion or volume climax.

Identifying the Set-Up

I drew a box around this significant bar and monitored price action every time it retraced into this area. We noticed a push below, a high that couldn’t be overcome at 77.15, and a double top pattern—a clear sign of buyer exhaustion.

This double top, coupled with a downward trend line from the overnight highs, suggested a strong shorting opportunity.

Trading the Double Top

A double top is formed when the price fails to surpass a particular high on two occasions, creating a resistance level. In our scenario, the double top at 77.15 indicated a high probability of a downtrend.

The neckline, or the low between the double tops, becomes the initial target.

As the price pushed below this neckline, it targeted prior lows and continued lower, hitting all projected targets and even exceeding them.

Double Top Strategy: Achieving Success in Trading
Double Top

Achieving Targets

From the double top, the market pushed down to $74.

Initially, I identified targets below the session’s prior lows at 76.30, 76.10, 75.80, 75.60, 75.30, 74.70, and 74.50.

The market eventually hit $74, well beyond the initial target, demonstrating the power of understanding volume and price action.

The Power of Live Analysis

Analyzing and predicting market movements live in front of an audience adds an extra layer of accountability.

It’s not about hindsight but about real-time interpretation of market signals.

This particular trade underscored the importance of recognizing high buying volumes without follow-through as a sign of buyer exhaustion.

Simplicity in Trading

One of the core philosophies we advocate at Hawkeye is the simplicity of focusing on volume and price action. Before adding various indicators to your charts, consider how much clarity you can gain from understanding these two fundamental aspects.

Often, less is more. A clean chart with multiple time frames focused on volume and price action can provide all the information you need for successful trading.

I invite you to watch the training webinar and reach out to the Hawkeye team.

Many traders rely on strategies that don’t prioritize volume and price action, and this often leads to inconsistent results. Our volume-driven tools and mastery library can transform your approach, making your trading clearer and more effective.

Trading with a focus on volume and price action, complemented by Hawkeye indicators, simplifies the process and enhances clarity.

It’s about mastering your emotional state, trading psychology, and analytical skills. This focus can be the pivotal change in your trading career.

Thank you for taking the time to read this post. I look forward to seeing you in our next video.

Don’t hesitate to reach out with any questions—we’re here to help you on your trading journey. Volume and price action are the keys to success, and with Hawkeye, you can unlock your full trading potential. Your journey to volume and price action mastery awaits you!

Happy Trading,

Anthony Speciale

Speciale Analysis 

[sg_popup id=13743]