Hello, traders! Anthony Speciale here with Hawkeye Traders. I hope you’re having a fantastic day. Today, I want to take you through my recent analysis of the S&P 500, focusing on a significant market reversal. While I didn’t pinpoint the exact low, I accurately identified a crucial level that the market respected, leading to a robust reversal. Let’s dive into the price action and volume dynamics to understand this better.
Analyzing Market Reversals
The Predictable and Unpredictable Nature of Markets
Markets can be both predictable and unpredictable. However, by focusing on specific indicators such as volume and price action, we can often identify potential reversal points. This morning, I highlighted an area of interest in the S&P 500 live, sharing my insights with other traders.
The Core of Market Analysis
Volume and price action are the foundation of any effective trading strategy. If your trade plan doesn’t prioritize these elements, you might be experiencing inconsistent results. Let’s break down how I use these indicators in real-time analysis.
Dissecting the S&P 500
Identifying Key Levels Using Hawkeye Volume Analysis
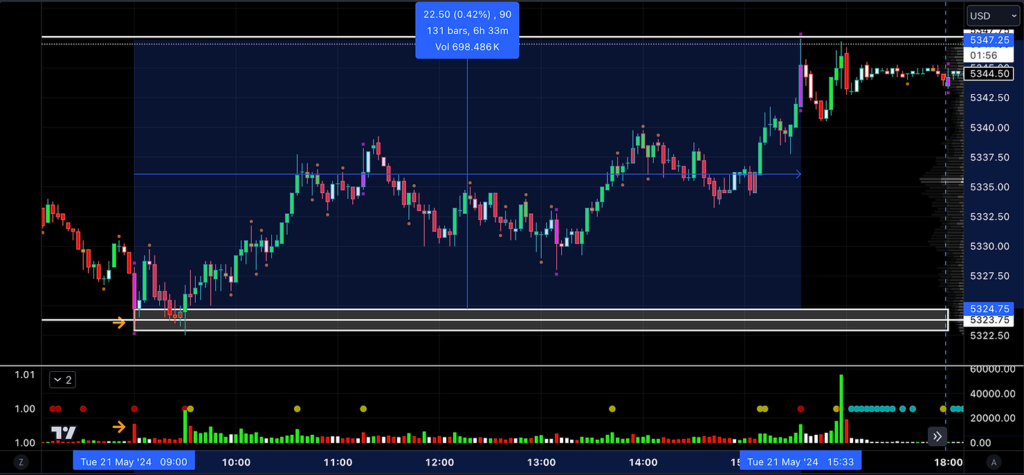
This morning, I focused on the 9:00 AM candle, which showed very high selling volume, the highest since the Globex open. Despite the heavy selling, the market did not follow through but instead reversed. This suggested a potential low point.
Here’s a step-by-step breakdown:
- Ultra-High Selling Volume: The 9:00 AM candle printed with substantial volume, indicating significant selling pressure.
- Rejection at Yesterday’s Low: This selling pressure brought us to the previous day’s low, a critical level where strong rejection occurred.
- No Follow-Through: Despite the high volume, there was no immediate continuation of the downtrend, hinting at a potential reversal.
Real-Time Reversal And Market Response
During the live session, I pointed out this critical area to fellow traders. As expected, the market reversed from this low.
Here’s the detailed action:
- Initial Reversal: After hitting the previous day’s low on high volume, the market reversed.
- Confirmation with Buying Volume: The 9:30 AM US open saw a surge in buying volume, confirming the reversal.
- Targeting Immediate Highs: I identified immediate highs as potential targets, using basic price action analysis to set these levels.
Practical Application – How To Use Hawkeye Volume Analysis
By understanding the relationship between volume and price action, you can make more informed trading decisions.
Here’s how you can apply this:
- Identify High-Volume Areas: Look for candles with significant volume, especially at key support or resistance levels.
- Analyze Follow-Through: Determine if the market continues in the direction suggested by the volume spike or if it reverses.
- Set Targets and Manage Risk: Use price action to set realistic targets and manage your risk effectively.
Building a Consistent Trading Strategy
Understanding and utilizing volume and price action is crucial for consistent trading success. This approach works across various market conditions and helps in identifying both opportunities and potential risks.
If you found this analysis helpful, please like and subscribe to our channel so you don’t miss our future videos. If you have any questions, leave a comment below, and I’ll personally respond. For more detailed guidance, reach out to us via email or phone – all the contact details are provided below the video.
Trading is a business of probability. By focusing on volume and price action, you can build a replicable trade plan that enhances your edge in the market. The tools and strategies offered by Hawkeye Traders are designed to make this process easier and more effective. Thank you for reading. God bless, and I’ll see you in the next video!
Access Hawkeye Volume Tools and Trading Mastery Strategies NOW
Happy Trading,
Anthony Speciale
